2016 International Congress on Computation Algorithms in Engineering (ICCAE 2016) ISBN: 978-1-60595-386-1
1 INTRODUCTION
In all power quality problems, the voltage sag is one of most hot topics in dynamic electric energy prob-lems. Voltage sag differs from sudden power failure, and the load is still connected to the power supply system when voltage sag occurs. Only the supply voltage suddenly drops very low. With a very short duration, special equipment is often difficult to detect transient process and determine the cause. Voltage sag has become one of the most important problems of electromagnetic interference the users face. Therefore, it has great significance to analyze the causes and occurrence category which are generated by voltage sag and develop appropriate measures for suppressing the transient phenomenon. Methods of using wavelet transform are used in reference [2, 3]. Short-time Fouri-er transform is used in refFouri-erence [4] to identify and analyze the voltage sag disturbances sources. But short-time Fourier transform doesn’t have the charac-ter of time-frequency locality so that it cannot be well applied to the voltage sag analysis of the transient phenomenon. S transform (S transform) is a time-frequency geophysics reversible analysis in the field of Stockwell who proposed in 1996. This idea is a kind of continuous wavelet transform and short-time Fourier Transform combinations and extensions. S
Transform and wavelet transform has similar charac-teristic frequency resolution, having a frequency re-lated to the resolution and the transformation matrix results by frequency and time-frequency image ex-pression. Compared with the continuous wavelet transform, the result of S transform is more intuitive and easy to understand and in the high frequency part which is more detailed than the continuous wavelet transform decomposition. Therefore, S transform oc-curs, and it also provides a compelling analysis tools for the power system, especially the power quality disturbance analysis. In this paper, the use of S trans-form is to detect and analyze voltage sags.
2 ANALYSIS OF THE DISTURBANCE SOURCE
CHARACTERISTIC VOLTAGE SAGS
Induction motor is an important grid load because its simple structure, reliable operation and so on are widely used in industry, agriculture and daily work.
However, the start-up performance of the induction motor is relatively poor. When you start, the initial speed of the rotor is zero, and this has a great start on the stator current. The starting current depends on the motor type and startup mode. As the power factor decreases, the current flowing through the system impedance increases, thus the partial pressure of the system impedance increases, resulting in PCC voltage
A Novel Method Based on S Transform of Induction Motor Sags
Detection During Startup
Shulin Zhang, Zhiming Li* & Fan Yang
HOPE Senlan Science and Technology Holding Corp. Ltd., Chengdu, Sichuan, China
ABSTRACT: Power quality issues are now considered to be essential features of successful power system due to the load, which results in a rapid increase in noise. Voltage sag is one of the hottest topics in dynamic power issues. In this paper, the short duration power quality disturbance detection method based on S-transform is cho-sen. The complex matrix and the amplitude matrix of the results of the S transform are used to extract waveforms to analyze the amplitude, phase jump, duration and harmonic of the disturbances of voltage sag under various circumstances. Simulation results show that the proposed detection method could detect the characteristics of voltage sag quickly and correctly.
Keywords: detection; short duration power quality disturbances; voltage sag (dip); S transform
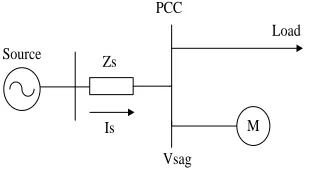
drop which is caused by voltage sags. Figure 1 shows a model for the induction motor starting illustration:
[image:2.516.76.231.87.177.2]Zs Load Vsag PCC Is Source M
Figure 1. A model for voltage sag of the induction motor starting.
3 VOLTAGE SAG DETECTION BASED ON S
TRANSFORM
3.1 S transform fundamentals
3.1.1 One-dimensional continuous S Transform
The S transform was proposed by Stockwell and his coworkers in 1996. The property of S Transform is that it has a frequency-dependent resolution of time-frequency domain and entirely refers to local phase information.
The idea is the wavelet transform and the short-time Fourier transform expansion. S transform is defined as following signals:
2 2 2 2, e e
2
t f ft f
S f h t dt
(1)And the inverse transform is:
,
ei2 fth t S f d df
(2)The CWT (Continuous-time Wavelet Transform) is defined as:
1
, t b
W a b h t dt
a a
(3)The S Transform is defined as CWT with a specific mother wavelet multiplied by the phase factor, where the mother wavelet is defined as:
2 2
2 2
, e e
2
t f i ft f
t f
(4)
However, the mother wavelet in formula (4) does not satisfy the property of zero mean. In other words, the S Transform is not equal to CWT.
S transform and Fourier transform are closely linked.
Fourier and convolution theorem can be used to
deduce formula (5) from the formula (1), which ena-bles fast calculation of S Transform on the use of ex-isting fast Fourier transform algorithm at the spectrum and frequency.
2 2 2 2 2, e f ei
S f H f d
f 0
(5)3.1.2 One-dimensional discrete S Transform
According to the one-dimensional continuous S Transform, discrete S Transform can be obtained by the following way: Let a continuous time series of discrete the sampled time signal, the sampling interval is T, the total number of samples is N, then the se-quence of discrete Fourier transform is:
21 0 1 e i nk N N k n
H h kT
NT N
0,1, 2,..., 1
n N (6)
The one-dimensional discrete transform is:
2 2 2
2 2
1
0
, e e
m i mj N
n N
m
n m n
S jT H
NT NT
(7)Where j, m and n = 0, 1,…, N-1. If n = 0 voice, it is equal to the constant which is defined as:
10 1 , 0 N m m
S jT h
N NT
(8)Obviously, Z transform result sampling time series is a complex time-frequency matrix (denoted as S matrix), the column vector for a moment varies with frequency distribution, and the row vector for a fre-quency distribution changes over time. Therefore, S matrix modulus value of a row and column element is at the appropriate frequency and amplitude of time signal S transform.
Therefore, using the signal S transform results can extract multiple time-frequency characteristics. S transform is more direct than wavelet transform with stronger anti-noise feature vector, and it is one of mathematical analysis methods that preferred a per-turbation analysis. Besides, S transform has good ren-dering capabilities of time-frequency characteristics, and it is suitable for voltage sags and other feature extractions of transient power quality disturbance signal.
3.2 Sag detection voltage S transform
3.2.1 S transform realize Matlab programming
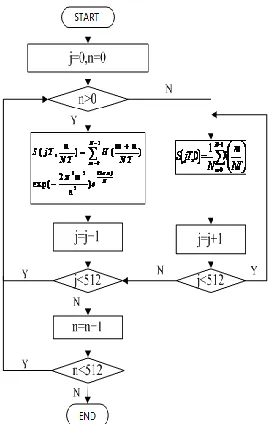
Figure 2. Flow chart of S transform.
(1) Translate fast Fourier transform calculated
sig-nals H m
NT
to
m n
H NT
;
(2) Calculate
2 2
2
2
,
m n
G m n e
for
each frequency gt, f in fast Fourier transform; (3) By frequency and sampling point, calculate
, m n . ,
B m n H G m n
NT
;
(4) Inverse fast Fourier transform calculation, the S-transform spectrum isS jT, n
NT
.
[image:3.516.86.220.323.535.2]The specific flow chart is shown in Figure 3:
Figure 3. The specific flow chart of S transform.
3.3 Voltage sag detection feature quantity
Voltage sag detection feature quantity include: the magnitude of the voltage sag characteristics, the phase transition, duration and harmonic content. After the disturbance signal on the S transform section disturb-ance signal S transforms results for the two-dimensional complex time-frequency matrix (512×512), with an image to describe it is a time-frequency-amplitude three-dimensional map. The
principle of voltage sag disturbance source detection is to choose corresponding characteristic and extract the characteristic parameter of curve.
(1) Temporary decline in the value of the detected voltage: There are two ways for the amplitude detec-tion voltage sags: One method is to extract the S-mode baseband matrix row vector magnitude curve to obtain the corresponding time, and the second method is to give time by S matrix amplitude envelope curve, namely calculate the amplitude envelope curve volt-age sag depth according to the fundamental row vector magnitude curve and time.
sag ref
MFU U (9)
Formula (9) means a state before the RMS voltage sag; when showing RMS voltage sag, the occurrence of asymmetric voltage sag means the fundamental positive sequence component of RMS voltage.
(2) Voltage sag phase jumping detection: Extract the S matrix phase vectors of sag frequency signal, and then point-by-point comparison of adjacent two phase increment is calculated as:
Xij X X
PH PH iPH j (10)
Wherein PHXij is a vector of length,1 i n 1 and
j i
1
.(3) Voltage sag duration detection: The detection of the mutation point is by the method of voltage sag signal, and non-stationary signals have characteristic mutations in the amplitude of the mutations which will also produce wider band transient component, there-fore, S-mode matrix in characterizing the signal fre-quency distribution and mutation will be inevitably reflected in its high frequency signals. Taking into account the impact of harmonics and noise, and then extract the fundamental frequency vector (i.e. 550Hz) from S-mode matrix row for 11 times to detect point mutations;
(4) Harmonic detection of voltage sags: We extract the frequency amplitude envelope according to S-mode matrix, and we use frequency amplitude en-velope method based on the extracted waveform to detect whether they contain harmonics. If they contain harmonics, it should be calculated according to the magnitude of harmonic content.
4 SIMULATION AND RESULTS ANALYSIS
4.1 Simulation
Simulink simulation and mathematical models are built in this chapter based on the method mentioned above to produce a variety of voltage sag disturbance source waveform.
Figure 4. Induction motor starting waveform.
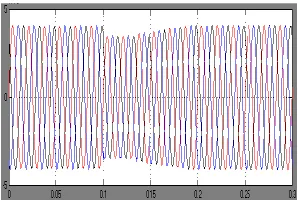
The induction motor starting can be seen according to the waveform diagram which causes a voltage sag in the literature: The process of decline with the de-cline in the current-voltage amplitude is gradually recovered; this process is relatively slow, and the mu-tation of magnitude occurs only once with no har-monic generation when the three-phase voltage sag is under the same circumstance. The balance of induc-tion motor driving load is general, so it causes sub-stantially symmetrical three-phase voltage sag.
[image:4.516.68.236.352.446.2]Therefore, we extract the waveform according to the above characteristics of the induction motor mathematical model, and here we take only a single phase for analysis. The waveform is shown in Figure 5:
Figure 5. Induction motor starting waveform caused by voltage sags.
4.2 S transform simulation results
After separating sampling S transform from various voltage sag waveforms mentioned above, we extract various feature amounts from S-mode, S complex matrix and comparative analysis with the standard sinusoidal signal.
Induction motor starting is shown in Figure 6:
(a) The fundamental frequency amplitude curve
(b) Time amplitude envelope curve
(c) Phase transition curve
(d) Discontinuity curve
(e) Time and mean squared amplitude curve
(f) Frequency amplitude envelope curve
[image:4.516.78.229.576.656.2](g) Three-dimensional image of sampling-point frequency amplitude
4.3 Analysis
1) Amplitude detection of voltage sag:
Method one:
From Figure 6(a), the curve of fundamental frequency amplitude can be solved before the voltage sag, 124 sampling points are minimum in the first voltage am-plitude, and the sag depth
0.8612
sag ref
MFU U .
Method two:
From Figure 6(b), time amplitude envelope curve can be solved before the voltage sag, 124 sampling points in the first voltage amplitude at a minimum, and the sag depthMFUsag Uref 0.8768.
The temporarily declined value is set as 0.85. And a higher accuracy can be obtained after the method of comparison.
2) Voltage sag detection of phase jumps:
We can obtain the maximum value 0.1084 at 65 sam-pling points in solving the phase transition curve of Figure 6(c).
3) Voltage sag detection duration:
From Figure 6(d), the mutation point in the waveform can be solved to achieve the maximum value 7.0457e-004 in the first 65 sampling points, and the mutation occurs only once.
4) Harmonic detection of voltage sags:
Through solving the frequency amplitude envelope curve from Figure 6(f), we achieve a great value 0.4796 in the first 17 sampling points of frequency, that is, only the fundamental frequency exists, ex-cluding harmonics.
5) It is more visual to show the results of S transform which is a two-dimensional matrix from the three-dimensional image of sampling-point frequency magnitude in Figure 6(g).
5 CONCLUSION
In this paper, as the detection voltage sag S transform is regarded as the main research content, we achieve the following results:
(1) Relevant literature on the basis of various short-term power quality detection methods is ana-lyzed and compared with S transform. The result of the disturbance signal by the S transform complex is a two-dimensional time-frequency matrix. And S trans-form has good characteristics capabilities.
(2) The characteristics interference source of the induction motor which causes voltage sag is analyzed, and the factors that affect voltage sag depth in induc-tion motor starting are pointed out.
(3) A deep understanding of the basic principles of S transformation is processed. And we summarize up the method of voltage sag S transform based on fea-ture amount analysis.
(4) We extract from the results of S transform in a waveform corresponding to the various voltage dips, phase transitions, duration and harmonic detection and analysis, and then we draw conclusions.
REFERENCES
[1] Xiao Xiangning. 2006. Analysis and Control of Power Quality. Beijing: China Electronic Power Press, pp: 124-128.
[2] Wang Kexing, Song Zhengxiang, Chen Degui & Wang Jianhua. Geng Yingsan. 2003. Interference source iden-tification of voltage sag in distribution system based on wavelet transform. Proceedings of the CSEE, 23(6): 29-34.
[3] Liu Yingmei, Bai Xiaomin & Wang wenping, et al. 2004. A dynamics-based method for voltage sags detec-tion, Automation of Electric Power System, 28(2): 45-49. [4] Zhao Fengzhan & Yang Rengang. 2007. Voltage sag disturbance detection based on short time fourier trans-form. Proceedings of the CSEE, 27(10): 28-35. [5] Zhang Bo. 2004. Voltage Sags’ Characters Extraction