ISSN: 1992-8645 www.jatit.org E-ISSN: 1817-3195
4020
HANDWRITTEN ELECTRONIC COMPONENTS
RECOGNITION: AN APPROACH BASED ON
HOG + SVM
1 LAKSHMAN NAIKA R, 2R DINESH, 3SANTOSHNAIK
1, Research Scholar, Jain University, Bangalore, India
2, Research Supervisor, School of Engineering and Technology, Jain University, Bangalore 3Associate professor, School of Engineering and Technology, Jain University, Bangalore [email protected], [email protected]
ABSTRACT
Recognition of hand drawn electronics components has application in academic and research in electronics engineering. In this paper, we propose an approach to recognize hand drawn electronic components using histogram of oriented gradient (HOG) features and subsequently Support Vector Machine (SVM) classifier is used to classify the components. The objective is to recognize the hand drawn electronics components. In order to achieve best recognition, we consider hand drawn scanned images and converted them to bi-level image then applied morphological operation to remove discontinuity. Further, the proposed method extracts features of intensity gradient and direction. We trained ten components with large data set each with 200 samples and tested with tenfold cross validation. To establish the efficacy of the proposed method, we have conducted experiment on large dataset of about 2000 images. From experiments it is revealed that the proposed method has yielded 96.9% recognition rate.
Key Words: Classifier, Circuits, Hand Written Components, HOG Descriptor
1. INTRODUCTION
In general sketch and character recognition has been focused from past many years. Recently, due to importance of electronic circuit analysis, many researchers are actively working towards developing algorithms to automatically analyze the circuit. In order to analyze the circuits, Components detection is very impotent, it helps to solve practical problem through analysis, design and implementation of circuit. There is a need for a system to generate circuit and detect the components automatically from hand written schematic. However, very few research works have been reported for hand written components recognition.
Recognition of electronics component from [1] hand written circuit schematic is preprocessed to remove noise and converted into a binary image. Each component is extracted from hand drawn circuit. Statistical features are captured from each component by considering some geometric properties like rectangular box, curvature, slope, width and number of intersects by Appling conditional probabilities between consecutive features are applied to the Hidden Markov Model
ISSN: 1992-8645 www.jatit.org E-ISSN: 1817-3195
4021 and orientation changes in the images. To address the problem of similarity transformation, [4] the method which works for online hand drawn circuit is recognized with scale, translation and rotation invariant recognition. The system uses a structural and topological relation matching for recognition. [5] In this approach concentrated on circuit, text and figure. Each component associated with component label and value are recognized using popular character recognition approach the components are recognized by collection of horizontal, vertical and diagonal lines are clustered together based on production rule. After recognizing each component and its label construct the netlist of components and their connection. [6] On the other hand the digital logic circuit diagram comprises of AND, OR and NOT gates. All the logic circuit symbols having one or more loop structures the symbol recognition is carried out under a decision-tree control strategy. However, this method is capable of recognizing the components and circuits it lags scalability with complex circuits with various electronic components. [7] Compare the performance of different techniques such as template matching, chain vector and Hough transform. The components are classified using neural network. [8] Segments the components using topology based technique from circuit and features are extracted using the Fourier descriptors and achieved an accuracy of 90%. [9] Address the recognition problem between different component like DC power supply and capacitor also similarity between roughly drawn wire and resistor by considering length and slope of stroke. [10] Address the recognition of analog and digital components based on loop and non loop symbols using syntax-based and statistical classifier. [11] HMM model to segment the component, it allows symbol hypothesis generation using 2D dynamic programming and components can be classified using neural network back propagation algorithm [12][13] in this approach the objects are recognized based on its physical appearance by considering length breadth and connecting leads of components. All the above methods have complex and hybrid techniques in feature extraction but HOG single method can give best recognition and computationally less complex. In the proposed work first importance given towards hand written electronics components recognition the input image is capture by scanning paper document or by high resolution camera. The gray level image converted to binary image then preprocessed. We are not focused on segmentation, individual component images are captured. We
proposed HOG feature extraction techniques and classified using SVM classifier.
2. PROPOSED METHOD
ISSN: 1992-8645 www.jatit.org E-ISSN: 1817-3195
4022
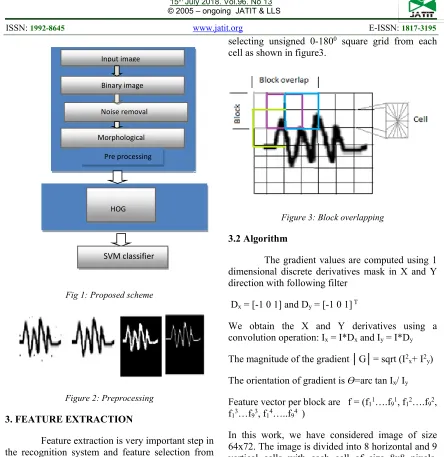
Fig 1: Proposed scheme
[image:3.612.85.529.64.521.2]
Figure 2: Preprocessing
3. FEATURE EXTRACTION
Feature extraction is very important step in the recognition system and feature selection from image also important task to improve the classification accuracy. There are many feature extraction techniques are available. In this work, we have proposed Histogram of oriented gradient feature extraction technique
3.1 Histogram of Oriented Gradients Features
The HOG features are used in object detection. This technique first introduced by Navneed Dalal and Bill trigs [25]. The feature or descriptor can be describing the intensity gradient and direction. For histogram computation the image divided into small connected region called cell. The contrast and illumination can be normalized by selecting 2cells x 2cells connected regions called block. This block overlap all the cells horizontally and vertically, to generate cell histograms of each pixel gradient will be calculated with histogram channel called bin by
selecting unsigned 0-1800 square grid from each
cell as shown in figure3.
Figure 3: Block overlapping
3.2 Algorithm
The gradient values are computed using 1 dimensional discrete derivatives mask in X and Y direction with following filter
Dx = [-1 0 1] and Dy = [-1 0 1] T
We obtain the X and Y derivatives using a convolution operation: Ix = I*Dx and Iy = I*Dy
The magnitude of the gradient │G│= sqrt (I2 x+ I2y)
The orientation of gradient is ϴ=arc tan Ix/ Iy
Feature vector per block are f = (f11….f91, f12….f92,
f13…f93, f14…..f94 )
In this work, we have considered image of size 64x72. The image is divided into 8 horizontal and 9 vertical cells with each cell of size 8x8 pixels. 16x16 sized block is created using 2x2 cells. The block is overlap across the image horizontally 7 times and vertically 8 times. Totally it takes 56 overlaps across the image with unsigned 9 histogram channel by 200 spacing called bin. The
boundary details is retain from one block to another block by selecting 2cells x 2cells in the connected regions of the image. This block take 50% overlap all the cells horizontally and vertically, this normalized result is invariance to changes. It would generate 2016 feature values as shown in table1 in the proposed work, we have used linear Support vector machine (SVM) [17].
Input image
Binary image
Noise removal
Morphological
Pre processing
HOG F
ISSN: 1992-8645 www.jatit.org E-ISSN: 1817-3195
4023
Table 1 : Feature description
4. EXPERIMENTATION
In this experiment we have considered around 2000 samples from 10 classes of components where each class has 200 images the Samples from each class were validated using ten fold cross validation method. The recognition accuracy is shown in the subsequent section.
4.1 Result analysis
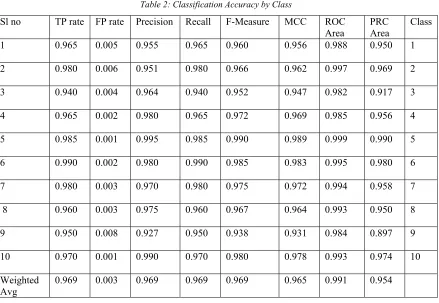
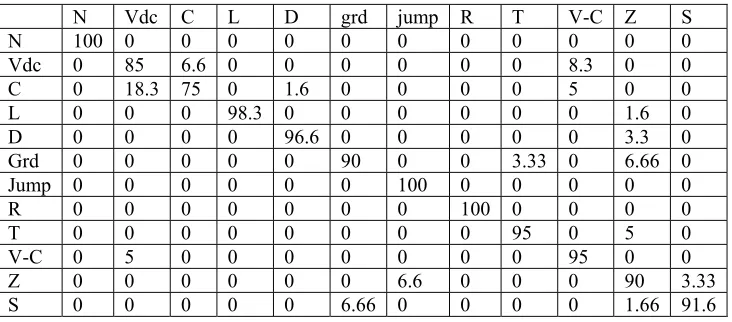
In this work, we have present experimental result analysis using large data set for 10 components with 2000 samples, each component with 200 samples. Data set collected from various users hand written samples with different sizes. The algorithm is implemented in Matalab. The experimental classification accuracy and confession matrices of proposed method shown in table 2 & table3 also confusion matrix of existing system in table 4& table 5. In order to demonstrate the generalization and stability about the classifier, we also carried out the experimentation with varying number of training samples and its recognition response. The ROC curves from the above experimentation have been given in the Figure 5.
Figure4: Result Comparison 0
20 40 60 80 100 120
D T R C L Vdc
proposed
Edward
ISSN: 1992-8645 www.jatit.org E-ISSN: 1817-3195
4024
[image:5.612.90.529.100.403.2]Table 2: Classification Accuracy by Class
Table 3: Confusion matrix of proposed method
Sl no TP rate FP rate Precision Recall F-Measure MCC ROC
Area PRC Area Class
1 0.965 0.005 0.955 0.965 0.960 0.956 0.988 0.950 1
2 0.980 0.006 0.951 0.980 0.966 0.962 0.997 0.969 2
3 0.940 0.004 0.964 0.940 0.952 0.947 0.982 0.917 3
4 0.965 0.002 0.980 0.965 0.972 0.969 0.985 0.956 4
5 0.985 0.001 0.995 0.985 0.990 0.989 0.999 0.990 5
6 0.990 0.002 0.980 0.990 0.985 0.983 0.995 0.980 6
7 0.980 0.003 0.970 0.980 0.975 0.972 0.994 0.958 7
8 0.960 0.003 0.975 0.960 0.967 0.964 0.993 0.950 8
9 0.950 0.008 0.927 0.950 0.938 0.931 0.984 0.897 9
10 0.970 0.001 0.990 0.970 0.980 0.978 0.993 0.974 10
Weighted
Avg 0.969 0.003 0.969 0.969 0.969 0.965 0.991 0.954
Diode Transistor Resistor capacitor Inductor DCsource ACsource ground Zener Amplifier
96.5 1 1 1 0 0 0 0 0.5 0 Diode
0.5 97.5 0 0 0 0 0 1.5 0 0.5 Transistor
2.5 1 94 0.5 0 0 0.5 0 1 0.5 Resistor
1 0.5 1.5 96.5 0 0.5 0 0 0 0 capacitor
0 0 0.5 0.5 98.5 0.5 0 0 0 0 Inductor
0 0 0 0 0.5 99 0.5 0 0 0 DCsource
0 0 0 0 0 1 97 0.5 0.5 0 ACsource
0 1 0 0 0 0 1.5 96.5 3 0 Ground
0.5 1.5 0.5 0 0 0 0 2 95 0.5 Zener
ISSN: 1992-8645 www.jatit.org E-ISSN: 1817-3195
[image:6.612.125.491.376.537.2]4025
Table 4: confusion matrix of Chandan and Edward method
Table5: Confusion matrix of Palo salo method
R C L D Grd Vdc Vac NPN pnp
R 100% 0 0 0 0 0 0 0 0
C 0 53.8% 0 0 0 46.2% 0 0 0
L 0 0 100% 0 0 0 0 0 0
D 0 10% 0 90% 0 0 0 0 0
Grd 0 0 0 0 100% 0 0 0 0
Vdc 0 22.2% 0 0 0 77.8% 0 0 0
Vac 0 9.1% 0 9.1% 0 0 81.8% 0 0
NPN 0 0 0 0 0 0 0 82.3% 17.6%
PNP 0 0 0 0 0 0 0 0 100%%
N Vdc C L D grd jump R T V-C Z S
N 100 0 0 0 0 0 0 0 0 0 0 0
Vdc 0 85 6.6 0 0 0 0 0 0 8.3 0 0
C 0 18.3 75 0 1.6 0 0 0 0 5 0 0
L 0 0 0 98.3 0 0 0 0 0 0 1.6 0
D 0 0 0 0 96.6 0 0 0 0 0 3.3 0
Grd 0 0 0 0 0 90 0 0 3.33 0 6.66 0
Jump 0 0 0 0 0 0 100 0 0 0 0 0
R 0 0 0 0 0 0 0 100 0 0 0 0
T 0 0 0 0 0 0 0 0 95 0 5 0
V-C 0 5 0 0 0 0 0 0 0 95 0 0
Z 0 0 0 0 0 0 6.6 0 0 0 90 3.33
ISSN: 1992-8645 www.jatit.org E-ISSN: 1817-3195
4026
Fig5: ROC Of Different Components
5. DISCUSSION
The proposed method has been evaluated for its efficacy on the large number of images from 10 classes. The experimental results are tabulated in the table 4. For the purposes of establishing superiority of the proposed method we are compared the results of the proposed method with the existing method [1][3]. The results of the existing method from the above tables 5 &6, it is observed that from the proposed method little better than the existing method an average case. It is also observed from table some of the existing method performs little better than proposed method. However we can take all
classes the proposed method reduces consistency across classes. From this study it is evident that the proposed method is consistent, efficient and outperforms the existing method. However, to improve the overall accuracy of the proposed method, we are in the process of refining the method by adding more number of features and tuning the classifier this, will be the our future work.
6. CONCLUSION
ISSN: 1992-8645 www.jatit.org E-ISSN: 1817-3195
4027 vector machine. The efficacy of the proposed method is established with extensive experiment on relatively large dataset. From the experiment it is evident that the proposed method has produced desirable results. Also, in order to establish the superiority of the proposed method with existing contemporary algorithm we compared the results of the proposed method with that of existing methods. From the comparative analysis it is evident that the proposed method is more consistent and produced better accuracy across the classes. This demonstrate that the proposed method outperforms existing contemporary method
REFERENCES:
[1] Pablo salao. “A recognition system for symbols of electronics components in hand –written circuit diagrams.” In proceeding of the IEEE, pages 257-286
[2] Yingmin Zhang, Christian VIard and Limong WU. “An online hand drawn Electric circuit diagram recognition system using Hiden Markov Models”. IEEE International symposium on information science and engineering pages 143-147 2008
[3] B. Edward and V. Chandan. “Machine recognition of hand-drawn circuit diagrams”. In proceeding of 2000IEEE international Conference on Acoustics, Speech and Signal processing, number 6, pages 3618-3621, Istanbul, Turkey, June 2000
[4] J. P Valois, M. Cˆot´e, and M. Cheriet. “Online Recognition of Sketched Electrical Diagrams”. In ICDAR, pages 460–464, 2001 [5] Donald Bailey, Andrew Norman and Giovanni Moretti. “Electronics Schematic Recognition” 147-151
[6] A.Okazaki, T.Kondo, K.Mori, S.Tsunekawa, and E.Kawamoto.”An Automatic Circuit Diagram Reader with Loop- Structure-Based Symbol Recognition.” ieee transactions on pattern analysis and machine intelligence, vol. 10, no. 3, may 1988
[7] R B Johnson “Recognizing electronics symbols using neural networks” The institution of electrical engineering, Savoy London, UK 1999
[8] Yachi Liu, Yao Xiao “Citcuit Sketch Recognition” Stanford University, Stanford [9] O’tega Ejofodomi, Shani Ross, “online
Handwritten Circuit Recognition on a tablet PC” proceeding of the 33rd applied imagery
pattern recognition workshop from IEEE computer society 2004
[10] E O Jesus and R A Lotufo “ECIR-An Electronic circuit diagram image recognizer “ Anais SIBGRAPI, 1998
[11] G Feng, C V Gaudin, Z Sun “On-Line hand-drawn electric circuit diagram recognition using 2D dynamic programming” Elseviewer, pattern recognition, 42, 3215-3223,2009.
[12] Manasa K chigateri, Manjuvani K M, “The detection of electrical and electronics components using K nearest neighbor classification algorithm” international research journal of engineering and technology, volume 03, 2016
[13] Christine Alvarado “multi-domain hierarchical fresh-stroke recognition using graphical model” Verlag London limited 2011
[14]H. Bunke, “Automatic interpretation of lines and text in circuit dia-grams,” in Pattern Recognition Theory and Applications, J. Kittler, K.S. Fu, and L. F. Pau,Eds. D. Reidel, 1982, pp. 297-310
[15] Yuhong Yu, Ashok Samal.A System for Recognizing a Large Class of Engineering Drawings. ieee transactions on pattern analysis and machine intelligence, VOL. 19,NO. 8, AUGUST 1997
[16] Xinyu Wang, Huosheng Xu, and Heng Wang. On-line Sketch Recognition for Course of Action Diagrams. Proceedings of the 2010 IEEEInternational Conference on Mechatronics and Automation August
4-7, 2010, Xi'an, China [17] S.-W. Lee, J. H. Kim, and F. C. A. Groen,
“Translation-, Rotation-, and Scale- Invariant Recognition of Hand-Drawn Electrical Circuit Symbols with Attributed GraphMatching,”SSPR90 Workshop, pp. 273-292, 1990
[18] Otsu, N., "A Threshold Selection Method from Gray-Level Histograms," IEEE Transactions on Systems, Man, and Cybernetics, Vol. 9, No. 1, 1979, pp. 62-66.
[19] L. O'Gorman & R. Kasturi, Document Image
Analysis,IEEE Computer Society Press,
Los Alamitos, 1995.
ISSN: 1992-8645 www.jatit.org E-ISSN: 1817-3195
4028 [21] B B. Nasution and A I, Khan, “A
hierarchical graph neuraon scheme for real time pattern recognition,” IEEE Trassactions on neural networks vol 19. February 2008
[22] Francesco Camastra, “ A SVM based cursive character recognizer,” pattern recognition society published by Elsevier 14-03-2007
[23] U Pal and B.B. chaudari, “Machine printed and hand-written text line identification,” I pattern recognition society published by Elsevier, 431-441, 2001
[24] Vapnik (1995), The Nature of Statistical Learning Theory. Springer, Berlin.