2017 International Conference on Computer Science and Application Engineering (CSAE 2017) ISBN: 978-1-60595-505-6
SARS Time Series Modeling and Spatial Data Analysis
Mei Zhang* and Jinghua Wen
School of Information, Guizhou University of Finance and Economics, 550025 Guiyang, China
ABSTRACT
By using ArcGIS9.3 SARS information on data collection and management, it was established that the spatial database containing information on SARS epidemic factors; the activities of SARS cases range control was simulated, and the best path for treatment of SARS cases was got by spatial analysis. S-type non-linear regression function is utilized in the cumulative number of confirmed deaths and cumulative curve fitting during SARS lasted; for cumulative number of confirmed, Logistic of s-shape function fitted better, while for cumulative number of deaths, Gompertz of s-shape function fitted better. Experimental results show that the fitted curve can effectively predict the SARS epidemic, and all preparedness and proactive actions would decrease SARS fatalities.
INTRODUCTION
In 2003, severe acute respiratory syndrome appear to humans posed a serious threat to human health and safety, and also directly impacted the economic development and social stability [1]. Although the SARS epidemic is over, but for the characteristics and laws of SARS occurred, communication and control, still needs further research, but also for the future of emerging infectious diseases like SARS early warning, prevention and countermeasures to establish theoretical and methodological basis [2].
Long-term research on infectious diseases of people shows that geographic prevalence of infectious diseases is one of the most serious factors. In recent years, the development of geographic information systems GIS[3] on the spatial distribution of infectious diseases provides new ways and means to solve the problems related to the development and treatment of infectious diseases, such as the best path.
GIS BASICS
Applications of GIS in Epidemiology
GIS applications are extensive, both in the application of epidemiological or other disciplines, the method is similar. Mainly includes the following three aspects: information visualization, exploratory data analysis and model building. GIS is to operate through a combination of geographical coordinates multiple databases through multiple elements (such as transportation, health institutions, human and animal infection or development, etc.) to collect data, and display. Depending on the needs of GIS users to make various types of maps, such as the distribution base maps, and other diseases and the media, or the many factors added together.
Development of GIS for epidemiological studies [4] plays an important role in providing a new technique, using geographic information system's powerful data management capabilities and display functions, you can get more information than an ordinary map, such as in SARS control, with ordinary map to find areas within 100 meters of HIV is more difficult, but can quickly GIS buffer at 100 meters, and select out qualifying place.
Of course, the different characteristics of diseases, and the distribution of the distribution of the different regions in different time periods, different analysis models can be constructed, different factors, tool collection and display maps are not the same. This article is mainly about the choosing of the optimal path to display and rescue in a dangerous area where SARS cases are sever.
ArcGIS9.3 Tools
ESRI was founded in America, and ESRI's ArcGIS geographic information systems is one of the most widely used software platform, its two main Desktop is a desktop tool ArcCatalog and ArcMap [5].
ArcCatalog is referred to as geographic data explorer. It is mainly for data acquisition and processed to manage and store them in a spatial database, recording, preview and manage the metadata stored in the database. ArcCatalog application module can help users organize and manage all of their GIS information.
Spatial visualization tool ArcMap is the map data capture and editing tool, that map data for editing, display, query and analysis, and its core is the map data. ArcMap is a professional charting system, is a professional editing systems, complex systems than the average. ArcMap is a specialized object-oriented spatial data editor, is a spatial data sheet generator.
SARS TIME SERIES MODELLING
In order to explore the law that the number of confirmed and deaths of SARS over time, we are in Beijing April 20, 2003 to June 23 total daily numbers and statistics confirmed deaths (see [6]) conducted the nonlinear fitting. By the scatter plot of these two statistical variables [7] shows that they were tested S-type changes over time, so we chose the two most commonly used nonlinear regression model S-Logistic model and Geometry model [8].
( )
1 ct
a y t
be
(1)
Geometry model fitting function is:
( ) exp( ct)
y t a be (2)
[image:3.612.100.497.196.236.2]Where a, b, c are undetermined coefficients. The nonlinear regression command programming of MATLAB7 software can be used to obtaining a total of confirmed cases of the two models above parameters are shown in TABLE І:
TABLE I. TWO MODEL PARAMETERS OF THE CUMULATIVE NUMBER CONFIRMED OF SARS AND STANDARD DEVIATION.
Model a b c standard deviation
Logistic 2518.50 5.56 0.18 18.92
Geometry 2539.25 2.31 0.13 22.80
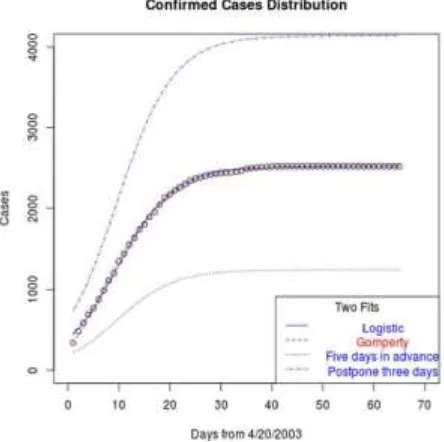
Choose a standard curve, see [8], what kind of curve fitting on the selection of the types of error is small, so choose a smaller standard deviation Logistic model fitting cumulative number of confirmed, the corresponding fitting results shown in Figure 1. Substituting the parameters in TABLE 1 Logistic model into the formula (1) to obtain Logistic model fitting curve function, its derivative, the growth rate can be a function of the number of cumulative diagnosed in point is worth to seek, to find value, which is five days in advance, we get the same, we evaluated three days delay is to give.
Figure 1. The cumulative confirmed cases distribution diagram.
[image:3.612.179.401.362.583.2]diagnosed cause delayed greatly increased the number of accumulated contrary, greatly reduced.
The number of deaths we have done a similar analysis, using nonlinear regression command MATLAB7 software programming model calculated the cumulative deaths of two cases of the above parameters is shown in TABLE II:
TABLE II. TWO MODEL PARAMETERS OF THE CUMULATIVE DEATH NUMBER OF SARS AND STANDARD DEVIATION.
Model a b c standard deviation
Logistic 189.460 5.54 0.11 4.69
Geometry 194.53 2.28 0.08 2.92
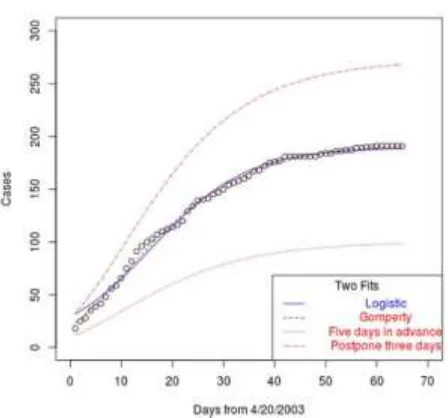
[image:4.612.169.393.375.584.2]So choose a smaller standard deviation Gompertz model fitting cumulative number of deaths, corresponding fitting results shown in Figure 2. Substituting the parameters in TABLE II Gompertz model into equation (2), the fitting curve model function obtained Gompertz its derivative can be obtained by the cumulative growth of deaths function evaluates to the point of evaluation, which is five days in advance, we get the same, we evaluated three days delay is to give. That is, if we find that five days ahead of the epidemic and to take measures, only the actual growth rate of the number of diagnosed cases, on the contrary, if delayed three days, then the growth rate will rise to the original times, indicating that the early discovery and SARS to take effective preventive measures tied to the cumulative impact of death also is very important.
Figure 2. The cumulative death cases distribution diagram.
SARS SPATIAL DATA ANALYSIS
According to SARS infectious analysis, it itself infectious, the virus-carrying cases and cases of contact with the source of infection, in order to properly control the source of infection, approach is timely isolation and treatment, and timely treatment of SARS on the scale or level of the hospital has a high demand for hospital information collected and stored, when one region discovered this virus, we can search around their nearest hospital, shorten its carriers turnaround time for timely treatment of SARS played a decisive role.
Therefore, we must carry out the relevant information collected and stored. Use ArcCatalog[9] to create a spatial database SARS, SARS created property database contains information on SARS cases and hospitals with SARS cases Table to store personal information, contact information, epidemic and epidemic information, designated quarantine information, and hospital information. Geospatial data for use ArcMap[10] to add, delete and modify editing and browsing in ArcCatalog presented.
Display of SARS Danger Zones
[image:5.612.127.452.401.586.2]When they find an area of a large number of virus carriers, we advance a particular range of the region's isolation. SARS infection most important factor is the source of infection. So we want to isolate the source of infection in order to better control the spread and proliferation of the virus. Through access to relevant treatment, we found that the SARS virus from human contact with animal viruses, which infect the population density and population flows in a region has great relevance.
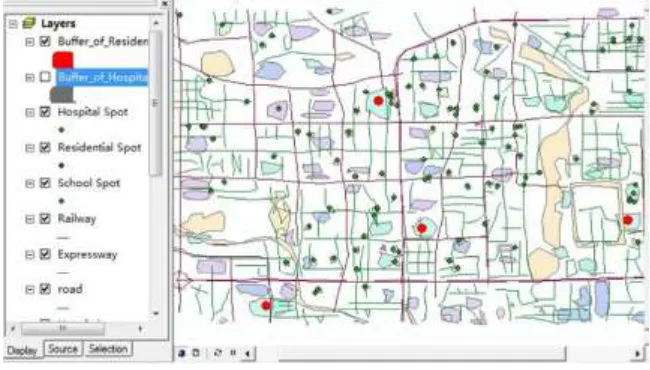
Figure 3. SARS danger zones.
In the space map above, the red dots displayed are 4 large residential areas around, and formed 4 buffers with a radius of 100 meters. When the SARS virus carriers found in the buffer, you can search through the map around the hospital, the medical understanding of the scale and level of the hospital, and then choose the optimal path to the hospital.
Display of SARS Danger Zones
In path analysis methods typically have the following categories:
(1) The shortest path: to determine the start and end points as well as to go through the intermediate point and the intermediate chain, and then use an algorithm calculated the shortest distance path
(2) Static optimal path: the right to determine the value of the relationship, the equivalent of curvature given each property, and then determine the best path based on the path attributes associated weights.
(3) Dynamic optimal path: network analysis in practical applications, the weights based on the weight of the relationship between the change in the path, sometimes temporary point of failure appears inevitable, so we need to make the network system can dynamically calculating the optimal path.
In these analyses, the most common and most basic is to find the shortest path between two nodes.
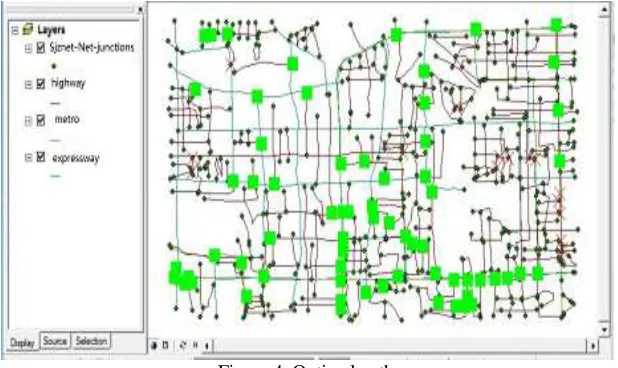
The incubation period of SARS is 2-10 days, and its onset speed is very rapid. In order to timely rescue the SARS carriers and the cases have been diagnosed in some region, defense work must be prepared in advance. Traffic congestion may have missed the best opportunity for treatment or infection may expand its scope. Therefore, in order to make SARS virus carriers or confirmed cases have been very good treatment, you must choose their transportation routes, which is the best route choice. And we chose the shortest path through the position of SARS cases appeared to find the location of the starting point and end point, there is a blue dot showing its shortest path.
[image:6.612.143.452.495.679.2]You can see from Figure 4 that the green mark in the picture means that it can pass, and the red mark stands for congestion, which is inconvenient to pass.
CONCLUSIONS
In this paper, we first create and analyze SARS spatial data, and use ArcGIS ArcMap 9.3 for data acquisition and collection of data stored in ArcCatalog create space database. Buffer and were analyzed using the network in ArcMap display range of the spread of SARS, the hospital's medical staff on the case be the shortest path selection. Its purpose is to disseminate effective control of SARS, and the person has been infected with effective treatment in the shortest possible time. Then the SARS time series modeling and simulation. The numerical calculation software MATLAB7 cumulative number of confirmed SARS deaths and cumulative nonlinear regression curve fitting. For cumulative number of confirmed, Logistic of s-shape function fitted better, while for cumulative number of deaths, Gompertz of s-shape function fitted bette. The occurrence of SARS made the appropriate control and prevention work to minimize harm once again. Of course, control of SARS precautions can be applied to other similar infectious diseases.
ACKNOWLEDGEMENT
Thank Project Supported by Regional Science Fund of National Natural Science Foundation of China (Project approval number: 41261094. Thank Project Supported by Science and Technology Foundation in Science and Technology Agency of Guizhou Province (Contract number: Qiankehejichu [2016]1020). Thank Project Supported by Science and Technology talent in National Science Foundation of Guizhou Province Education Department (Contract number: Qianjiaohe KYzi [2016]069 ).
REFERENCES
1. Zhang Mei, and Wen Jinghua. 2010. “Modeling and Simulation on Time Series of Transmission and
Control of SARS,” Chinese Perspective On Risk Analysis And Crisis Response, 13: 885-890.
2. Gong Jianhua, Zhou Jieping, Xu Shan, And Wang Wei-hong. 2006. “Dynamics Model and
Multi-Agent Based Simulation of SARS Transmission,” Journal Of Remote Sensing, 10(6):829-835.
3. Zhu Guang. 2010. Geographic Information Systems Principles and Applications, Sciences Press.
4. Yinxia. 2004. Analysis of the SARS epidemic environmental factors and Information System Based
on GIS, Master's Thesis of Central South University.
5. Wu Jing. 2011. ArcGIS 9.3 Desktop GIS Application Tutorial, Tsinghua University Press.
6. Hu Shouxin, and Li Bolin. 2004. Mathematical experiments based on MATLAB, Sciences Press.
7. Yu Chengxiao, Li Xin, and Wang Jun. 2010. “Design and implementation of GIS spatial analysis
modeling module,” Computer Engineering and Design , 31(14):3305-3308.
8. Qian Yongqiang, Sun Zhenyuan, and Han Lei. 2011. “Giant bison grass Logistic shut up and
Gompertz based nonlinear model clonal growth simulation and analysis,” Chinese Agricultural
Sciences, 44 (11):2252 -2259.
9. Yangyue. 2011. “Research and development of urban road maintenance system based on GIS,”
Beijing Jiaotong University.
10. Qiang Sheng. 2009. “Analysis, design and test of government geospatial information system,”