Timely Efficient Automated System by
Segmentation Using Wavelet Transform
ARULMOZHI RAJARATHINAM AKSHAYADEVI ARIVAZHAGAN
PG Scholar Research Scholar
Department Of ECE, Department Of ECE Meenakshi Ramaswamy Engineering College Periyar Maniammai University
Thathanur, India Vallam-Thanjavur, India.
ABSTRACT--- For early detection of infected part of skin
from captured digital images analyses automatically in order to increase the survival rates of humans with early detection for skin cancer diseases by reducing cost for dermatologist to screen every patient. A new approach for the segmentation of skin lesions in digital image based on wavelet network (WN). The WN presented here is a member of fixed-grid WNs that is formed with no need of training. In this WN, after formation of wavelet lattice, orthogonal least squares algorithm is used to calculate the network weights and to optimize the network structure. R, G, and B values of a digital image are considered as the inputs for the network and for the formation of network structure. Then, the image is segmented and the skin lesions exact boundary is determined accordingly. This proposed automated system with wavelet transform yields better performance results in comparison to other tested algorithms with accurate as well as faster detection of infected skin part.
Index Terms: segmentation, least square, wavelet
transform.
I. INTRODUCTION
Artificial intelligence field, especially using fuzzy and artificial neural network (NN) approaches for segmentation of medical images, has gain special popularity [5],[6]. One of the most promising computational intelligence methods that have been widely used for various applications in different areas is wavelet network. The main advantage of WNs over similar architectures such as multilayer perceptron (MLP) and networks of radial basis functions (RBF) is the possibility of optimizing the WN structure by means of efficient deterministic construction algorithms. Skin lesion is a superficial growth or a patch of skin which is not unique with surrounding area.
It is usually 5mm in diameter above which may be suspected as cancer[1]. Fortunately, despite its increasingly spread, Skin cancer is not an untreatable
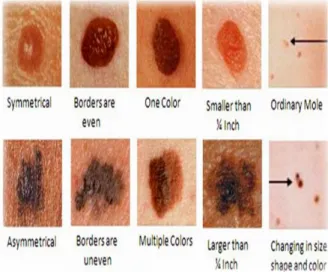
disease if diagnosed at rudimentary stages. The various features such as color, shape, and texture were extracted. Later on, the more precise and advanced imaging technique, namely skin images offered a noninvasive method for in vivo observation of pigmented skin lesions used in dermatology [1]. The standard approach in automatic skin image analysis has usually three stages: 1) image segmentation; 2) feature extraction and feature se-lection; and 3) lesion classification. Due to different shapes and colors of skin, segmentation is the most important stage of all. Different pattern of skin lesion with varying shape, size, color and texture is shown in Fig 1.
Fig: 1 Different pattern of skin lesions
There have been a great number of algorithms for segmenting [9] skin images, such as fuzzy c means clustering, thresholding, gradient vector flow (GVF), quantitative assessment of tumor extraction, j-image segmentation algorithm, independent histogram pursuit algorithm, k-means++, statistical region merging, dermatologist-like tumor are extraction algorithm, adaptive snake, thresholding based on type-2 fuzzy logic, wavelet trans-form (WT) fuzzy algorithms,
International Journal of Science, Engineering and Technology Research (IJSETR), Volume 4, Issue 8, August 2015
iterative classification, modified random walker algorithm and hybrid thresholding on optimal color channels. Many segmentation algorithms have been proposed to locate skin lesion in images automatically. The majority of algorithms only use features derived from pixel color to drive the segmentation. This includes the blue channel from the RGB color space, or an orthogonal transform applied to the color channels.
II. BACKGROUND
A. IMAGE SEGMENTATION
Image segmentation is the process of partitioning a digital image into multiple segments. The goal of segmentation is to simplify and change the representation of an image which is easier to analyze image [9]. More precisely, image segmentation is the process of assigning a label to every pixel in an image such that pixels with the same label share certain characteristics. The result of image segmentation is a set of segments that collectively cover the entire image, or a set of contours
Fig: 2 Image segmentation
Each of the pixels in a region is similar with respect to some characteristic or computed property, such as color, intensity or texture. Adjacent regions are significantly different with respect to the same characteristics. Segmentation of the image is shown in Fig.2.
B. WAVELET NETWORK 1. Structure of WN
The output signal of a WN with one output y, d inputs x =(x1, x2….Xn) T and q wavelons (wavelet neurons) in the hidden layer is defined in (1)
𝑦 = 𝜔𝑖 𝑞 𝑖=1 𝜑𝑚𝑖∙ 𝑛𝑖 𝑥 (1) 𝑦 = 𝜔𝑖 𝑞 𝑖=1 2(−𝑚𝑖𝑑 /2)𝜑 2𝑚𝑖𝑥 − 𝑛𝑖 (2)
here 𝜔i =1, 2,...,q , are weight coefficients, 𝜑𝑚𝑖 , 𝑛𝑖 are
dilated and translated versions of a mother wavelet function 𝜑 :Rd→R, and mi, 𝑛
𝑖 are scale and shift
parameters, which is defined in (2) respectively. NNs are known to suffer from lack of robustness toward outliers. In contrast, due to time-frequency localization of the WT and the self-learning characteristic of NNs, WN is more effective and robust than NN [7][8]. 2. Segmentation Algorithm
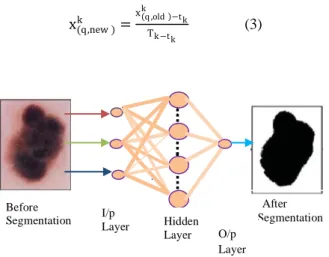
At first the values of R, G, and B matrices of each color skin image are mapped into [0, 1] range by performing normalization process which is defined by [3]
x(q,new )k =
x q ,old −tkk
Tk −t k (3)
Fig: 3 WN for Segmentation of Skin Images. Then, a WN is formed with three inputs, a hidden layer, and an output as shown in Fig: 3. In order to form the WN, the values of three color matrices are considered as network inputs. These matrices are related to the five chosen images from the selected images for segmentation. From these images, some pixels are selected randomly (ranging from 1000 to 5000 pixels for a 485 × 716 image). If the pixel is inside the lesion, network output will be considered as zero, and if the pixel is outside the lesion, the output will be considered as one [2].
III. PROPOSED SYSTEM A. INPUT IMAGE
The infected Skin image is captured from digital camera whose illumination variation is corrected is taken as an input image. Skin lesion image is taken as the infected skin image. Here wavelet based segmentation yields higher accuracy when compared to texture distinctiveness lesion segmentation algorithm.
I/p Layer After Segmentation
Before Segmentation Hidden Layer O/p Layer
International Journal of Science, Engineering and Technology Research (IJSETR), Volume 4, Issue 8, August 2015
Wavelet signals can be able to operate at much faster rate. As the wavelet segmentation adds more accuracy in order to find the infected boundary of skin because only if the segmentation is accurate it can be able to detect the intensity level of skin lesion that is how far deep the infected part[3]. Here taken input image using fixed grid network so at some random axis an wavelet lattice is formed. Grid is a framework of spaced bars that are parallel to or cross each other. The input image is shown in Fig: 4 is the model for a lesion image of skin area obtained. It is followed by a Gabor filter.
.
Fig.4 Input Image
B. GABOR FILTER
Input image is resized using Gabor filter. Gabor filter are band pass filter used mainly in image processing. They are a kind of linear filter used for edge detection process. They have been found to particularly appropriate for texture representation and discrimination. The Gabor filter is used to extract the original image by filtering unwanted components mainly to predict the edges [11]. The filtered image is in gray scale format. It is transformed to an RGB format by using RGB wavelet segmentation.
C. RGB WAVELET TRANSFORM
R, G, and B values of a digital image are considered as the inputs of the network and the formation of network structure. The advantage of using a wavelet feature minimizes multiple segmenting processes and also provide most accurate lesion boundary. A three-layer (RGB) WN is implemented after filtering process. At first the input data are normalized, one hidden layer and one output layer. In Hidden layer Least Square type algorithm is used by neural network concept. The Eigen values and Eigen vectors are calculated for three layers in the network. Based on the Eigen values for each pixel in the segmented image of R, G, and B components the probability of maximum combination of 0’s and 1’s are determined. If the pixel lies inside the lesion, network output will be treated as 0, and if the pixel lies outside
the lesion, the output will be treated as 1. Then, by using orthogonal least square algorithm squared boxes with least values are found out.
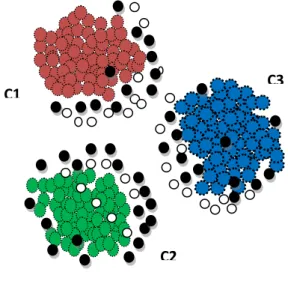
D. CLUSTERING PROCESS
Clustering is the process of organizing objects into Groups whose members are similar in some way. A cluster is therefore a collection of objects which are
Fig: 5 clustering process
Dissimilar to the objects belonging to other clusters as shown in Fig: 5. Image is divided into k clusters in which cluster centers are picked randomly [4]. Then by assigning each pixel in the image to the cluster that minimizes the distance between the pixel and the cluster center which is followed by averaging all the pixels. From the obtained least square values the probability of maximum combination of 0’s are grouped using this clustering process and boundary of lesion is found out as shown in Fig: 6 of overall block diagram.
Fig.6 Overall Block Diagram
INPUT IMAGE OUTPUT DETECTION OUTPUT IMAGE C1 C2 C3 INPUT IMAGE PREPROCES METHOD GABOR FILTER RGB WAVELET NETWORK OUTPUT DETECTION OUTPUT IMAGE
International Journal of Science, Engineering and Technology Research (IJSETR), Volume 4, Issue 8, August 2015
ILLUSTRATION STEPS:
Illumination corrected input image taken Using fixed grid wavelet lattice is formed Image is resized using Gabor filter. Transformation to RGB format If
Pixel lies inside lesion boundary,
Network output is zero.
Else
Network output is one
Probability of 0’s calculated using OLS algorithm Grouping done needs clustering.
By wavelet network thus lesion boundary located. IV. RESULTS & DISCUSSION Our experiment is done using mat lab tool version R2009b, a scalable simulation environment with Intel core processor speed 1.5GHz and memory of Up to 512 MB RAM in image processing. The algorithm here used is wavelet based segmentation. The proposed framework has higher segmentation accuracy compared to all other tested algorithms. The main advantages of using wavelet are intensity of infected region accuracy is higher. And also time taken to compute total 260° iterations is low thus processing speed is high by achieving high computation efficiency compared to tested TDLS segmentation method which is based on texture distinctiveness. Wavelet provides more robust segmentation results with high sensitivity and specificity.
Fig: 7 Input image
Fig: 7 show results of input image of the infected skin part. This image is captured using a digital camera whose illumination variation is corrected is taken as an input to this initial process. The image is read in Jpg
format with values of lambda =8, theta =0, psi =[pi/2], gamma=0.5, BW=1, N=8.
Fig: 8 show a converted Gabor output image. Wavelet lattice is formed on fixed grid of the network.
Fig: 8 Gabor output image
The gray scale image of skin pointing with detected edges of the image. This is an increased performance of Gabor filter with true edge detection
Fig: 9 RGB model
Fig: 9 shows RGB network. Here network shows three layers with inner red, middle blue, outer green. From the RGB wavelet network images, pixel with calculated Eigen values are arranged in R, G, B layers respectively. Eigen values are formed with most combination of 0’s and 1’s. The probability of most combination of 0’s are grouped to locate lesion.
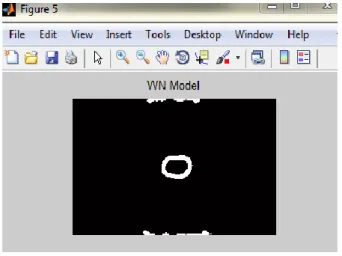
Finally Fig: 10 presents obtained segmentation boundary of infected area of skin. Thus the performance of wavelet network with robust accuracy
Fig: 10 WN model
Boundary of infected part increases segmentation results Compared to texture disintinctiveness based Segmentation results. The image shown here gives specifically the infected tissues in the skin with high intensity.
Fig: 11 3-D image of skin lesion
Fig: 11 present the 3-D pattern of obtained output image. Above the red line mark shows the intensity of infected part of skin. The taken input image first starts with initial level set function after completing 260 iterations gives the final level set function of infected depth.
V. CONCLUSION AND FUTURE WORK
Wavelet network used here for the segmentation process acts with faster rate with Elapsed time of 1.834731 seconds in order to complete the whole segmentation process with calculated value of PSNR = 50.77166. The entire proposed framework using wavelet signals to locate skin lesion infected level has the highest
segmentation accuracy. But this proposed work contains only fixed input images for segmentation using wavelets. A larger collection of data, analysis including additional testing of more samples of data images will be undertaken as future work. While the obtained output image shows that proposed method can be able to segment the skin lesion image with higher accuracy with less time consuming.
REFERENCES
[1] H. Ganster, A. Pinz, R. Rohrer, E. Wildling, M. Binder, and H. Kittler,‖ Automated melanoma recognition, ‖ IEEE
Trans.Med.Imag., vol. 20 ,no. 3, pp. 233– 239, Mar. 2001
[2] M. E. Celebi, H. A. Kingravi, H. Iyatomi, Y. A. Aslandogan, W. V. Stoecker, R. H. Moss, J. M. Malters, J. M. Grichnik, A. A. Marghoob, H. S. Rabinovitz, and S. W. Menzies, ―Border detection in dermoscopy images using statistical region merging,‖ Skin Res.Technol., vol. 14, no. 3, pp. 347–353, 2008.
[3] M. Zortea, S. O. Skrvseth, T. R. Schopf, H. M. Kirchesch, and F.Godtliebsen, ―Automatic segmentation of dermoscopic images by iterative classification,‖ Int. J. Biomed. Imag, vol. 2011, p. 19, 2011.
[4] Z. Wu and R. Leahy, ―An Optimal Graph Theoretic Approach to Data Clustering,‖ IEEE Trans. Pattern Analysis and Machine Intelligence, vol. 15, pp. 1101-1113, 1993. [5] M. Hintz-Madsen, L. K. Hansen, J. Larsen, E.
Olesen, and K. T.Drzewiecki, ―Design and evaluation of neural classifiers—application to skin lesion classification,‖ in Proc. 1995 IEEE Workshop Neural Networks for Signal Processing (NNSP’95), 1995, pp. 484–493. [6] M. Binder, A. Steiner, M. Schwarz, S.
Knollmayer, K. Wolff, and H.Pehamberger, ―Application of an artificial neural network in epiluminescence microscopy pattern analysis of pigmented skin lesions: A pilot study,‖ Br. J. Dermatol., vol. 130, pp. 460–465, 1994. [7] M. Antonini, M. Barlaud, P.Mathieu, and I.
Daubechies, ―Image coding using wavelet transform,‖ IEEE Trans. Image Process., vol. 1, no. 2, pp.205–220, Apr. 1992.
International Journal of Science, Engineering and Technology Research (IJSETR), Volume 4, Issue 8, August 2015
―Wavelets and curve lets for image deconvolution: A combined approach,‖ Signal Process., vol. 83, no. 10, pp. 2279–2283, 2003. [9] Y. J. Zhang, Image Segmentation. Peking,
China: Since Press, 2001
[10] R. Nock, ―Fast and reliable color region merging inspired by decision tree pruning,‖ in Proc. IEEE Int. Conf. Computer Vision and Pattern Recognition, 2001, pp. 271–276. [11] P. Vautrot, N. Bonnet, and M. Herbin,
―Comparative study of different spatial/spatialfrequency methods (Gabor filters, wavelets, wavelets packets) for texture segmentation/classification,‖ in Proc. Int. Conf.Image Processing, Sep. 16–19, 1996, vol. 3, pp. 145–148.
[12] L. G. Shapiro, G. C. Stockman. Computer Vision. New Jersey, Prentice-Hall (2001). [13] M. S. Lew, N. Sebe, C. Djeraba, R. Jain.
Content based multimedia information retrieval: State of the art and challenges, ACM Transactions on Multimedia Computing, Communications and Applications, 2(1): 1-19 (2006).
[14] F. D. Turek. Machine vision fundamentals, How to make robots see, NASA Tech Briefs 35 (6): 60-62 (2011).
[15] D. L. Pham, C. Xu, J. L. Prince. Current methods in medical image segmentation, Annual Review of Biomedical Engineering, 2: 315-337(2000). [5] F. Fleuret, J. Berclaz, R. Lengagne, and P. Fua. Multi-camera people tracking with a probabilistic occupancy map, IEEE Transactions on Pattern Analysis and Machine Intelligence, 30(2):267-282 (2008) [16] D. Aloise, A. Deshpande, P. Hansen, P. Popat.
NP-hardness of Euclidean sum-of-squares clustering, Machine Learning, 75: 245-249 (2009).
[17] R. P. Nikhil, J. C. Bezdek. On cluster validity for the fuzzy c-means model, IEEE Transactions on Fuzzy Systems, 3(3):370-379 (1995).
[18] K.-S. Chuang, H.-L. Tzeng, S. Chen, J. Wu, T. J. Chen. Fuzzy c-means clustering with spatial information for image segmentation, Computerized Medical Imaging and Graphics, 30(1):9-15 (2006).
[19] D. Martin. An empirical approach to grouping and segmentation, Ph.D. dissertation, University of California, Berkeley, 2002.
BIOGRAPHY
Miss Arulmozhi Rajarathinam has received her B.E
and M.E degree from Annamalai University, Chidambaram, Tamilnadu, India and Meenakshi Ramaswamy Engineering college, Thathanur, in the year of 2011 and 2015.Her interested area includes Image segmentation, Image processing and network security. She has published one national conference.
Miss Akshaya Devi Arivazhagan has received her B.E
and M.Tech degree from Annamalai University, Chidambaram, Tamilnadu, India and Periyar Maniammai University, vallam, Thanjavur in the year of 2013 and 2015. She is an research scholar in Periyar Maniammai University vallam, Thanjavur, Tamilnadu., India. Her Research interested includes Ad hoc Networks, Mobile Communication, Remote sensing and GIS. She has published technical papers at various National / International Conference and Journals.