a
Corresponding author: [email protected]
Bubble shape and breakage events in a vertical pipe at the boiler flow line
Andrew Fsadni1,a, Yunting Ge2
1
Grenfell-Baines School of Architecture Construction and the Environment, Kirkham Room 124, University of Central Lancashire, Preston, PR1 2HE, UK
2
Department of Mechanical Engineering, Room H118, Brunel University, Uxbridge, UB8 3PH, UK
Abstract. The theoretical and experimental aspects concerning the typical bubble shape at the flow line of a standard domestic central heating system are investigated. This is done in support of the on-going research on two-phase flows in domestic central heating systems. Bubble nucleation and detachment at the primary heat exchanger wall of a domestic central heating boiler results in a bubbly two-phase flow in the system pipe work. Bubbly flow results in undesired cold spots at higher points in the system, consequently diminishing system performance. An experimental analysis was done on the bubble shape at the exit of the boiler through the application of photographic techniques. The results are presented in terms of the measured bubble aspect ratios at some principal system operating conditions. The dimensionless Eotvos and bubble Reynolds number were calculated and tabulated with the measured mean diameters. The data was subsequently correlated to the bubble shape regime diagram. Results suggest that most bubbles are quasi-spherical in shape with a noticeable elongation at lower bulk fluid Reynolds numbers.
1 Introduction
The typical bubbly flow in a wet domestic central heating system, finds its origin at the boiler primary heat exchanger. Such a phenomenon occurs due to the elevated temperatures at the heat exchanger that lead to bubble nucleation due to gas super saturation levels [1]. Hence, the subsequent bubble growth and detachment into the turbulent flow, results in a bubbly two-phase flow in the system flow line. Experimental investigations into the two-phase flows in domestic central heating systems are essential to develop a fundamental knowledge of the typical bubbly flows in such systems. The latter is an essential prerequisite for the development of more efficient system deaerators that could consequently improve the overall system efficiencies [1]. The studies done by Thang and Davis [2], Van der Welle [3], Michiyoshi and Serizawa [4], Winterton and Orby [5] and Winterton and Munaweera [6] in vertical two-phase bubbly flow, have assumed a perfectly spherical bubble shape. However, Liu [7] reported that bubble elongation along the flow is observed with the presence of larger bubbles, with minimal elongation observed with smaller sized bubbles. Similar conclusions were made by Thorncroft et al. [8] in their studies in vertical up flow and down flow boiling. When discussing the bubble shape in horizontal bubbly flow, Kocamustafaogullari et al. [9] reported that due to the negligible relative velocity between the two phases, the
average pressure fluctuations generated by the turbulent liquid fluctuations acting across a bubble diameter are the only means which could cause a distortion to the bubble shape.
Hesketh et al. [10] linked the bubble shape to bubble breakage events. They reported that prior to breakage, bubbles were observed to stretch up to four times their original diameter in turbulent vertical pipe bubbly flow. Furthermore, Iskandrani and Kojasoy [11] reported that bubble coalescence is expected at a void fraction above 65 % in bubbly flows. Winterton [12] discussed the shape of bubbles detaching from a wall in supersaturated solutions. They reported that as bubbles get larger they would vibrate in the flow. However, the contact area would remain fixed in position.
Winterton [12] reported that just before breaking off from its point of nucleation, the typical bubble shape would be considerably distorted. Very often, the bubble would move jerkily along the surface before finally being carried into the mainstream flow. Similar trends were reported by Prodanovic et al. [13] in sub-cooled flow boiling. They reported that upon inception at their nucleation point, bubbles are flattened due to strong inertial forces. However, as they grow, possibly sliding on the wall surface prior to detachment, they become more rounded thus developing a spherical shape near the maximum diameter. Prodanovic et al. [13], reported typical aspect ratios in the range of 0.8 to 0.85 at detachment while similar studies done by Akiyama and
C
Owned by the authors, published by EDP Sciences, 2014
Tachibana [14] and Faraji et al. [15] reported typical ratios of 0.8. Furthermore, Hepworth et al. [16] stated that the assumption that bubbles must be almost a complete sphere at their nucleation point is only valid for low contact angles. Through the application of direct numerical simulations for bubbly air water two-phase downward flow, Lu and Tryggvason [17] reported quasi spherical bubbles with diameters of 1.53 m m and slightly ellipsoidal bubbles with diameters of 1.84 m m.
Mishima et al. [18] and Singh and Shyy [19] classified the shape of a single isolated bubble rising in a stagnant pool in terms of the dimensionless Eotvos number, Eo given in Eq. (1) and the bubble Reynolds number, Re given in Eq. (2), through the use of the bubble shape regime diagram as illustrated in figure. 1.
=
∆
(1)
=
(2)
Figure 1. Bubble shape regime diagram (Mishima et al., [18], Page 231).
In this paper we will investigate the typical shape characteristics of bubbles suspended in a bubbly flow in vertical pipework on the flow line of a domestic central heating system.
2 Experimental set-up and methodology
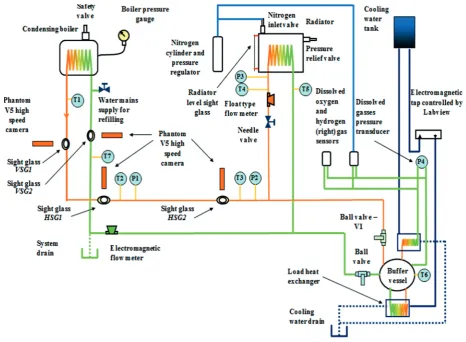
A schematic diagram of the experimental set up is illustrated in figure 1. The test rig consists of a Vaillaint eco TEC pro 24 condensing boiler that is connected to 20mm (inner diameter) copper tubing which supplies a radiator and a buffer vessel. A condensing boiler is used as this is mandatory equipment for new buildings in most European Union member states [20]. Three pressure transducers monitor the system pressure. A fourth
pressure transducer monitors the dissolved gas partial pressure in combination with a semi-permeable silicone membrane. Seven stainless steel sheathed Type K thermocouples are used to measure the fluid temperatures along the circuit.
The system fluid flow rate is monitored through an Electromag 500 Series electromagnetic flow meter. A National Instrument cDAQ-9172 chassis and relevant data modules receive all the signals from the transducers, thermocouples and electromagnetic flow meter. As tabulated in Table 1, experiments were conducted to analyse the bubble shape characteristics across the vertical pipe sections. Therefore, sight glass VSG 1 was used as illustrated in figure 2.
The saturation ratio was calculated through the application of Eq. (3), as defined by Jones et al. [21]. This is the ratio of the actual dissolved gas concentration present in the bulk fluid to the maximum concentration at saturation conditions. An analysis of the dissolved gas present in the closed loop system has shown that nitrogen is the dominant gas. This is a result of a limited oxidation following the system filling with fresh water. The oxidation process releases iron oxide and some hydrogen gas. The analysis of dissolved gases through the use of Orbisphere 3655 oxygen and Orbisphere 3654 hydrogen sensors resulted in very low concentrations of oxygen and hydrogen present in their dissolved form. In fact, both gases were present in concentrations of circa 9 PPB. Hence, nitrogen properties were used for the dissolved gas properties in the present study. The actual gas content was calculated through the application of Eq. (4). The partial gas pressure was calculated by subtracting the vapour pressure from the gas transducer reading as defined by Lubetkin and Blackwell [22].
=
(3)
= (4)
A system pressure of 2.6 Bars (abs) was used for the experiments at a constant pressure, whereas a pressure in the range of 2 to 3.75 bars was used for the second experimental run. The pressure was set through the use of a nitrogen gas cylinder connected to a standard cylinder regulator. A heating load in the range of 7.5 to 21.5 k W was applied.
The system flow rate or velocity is varied through the use of a ball valve on the supply line. The bulk fluid velocities in the system pipe work were set in the range of 0.3 – 0.85 m / s. This is equal to a system volume flow rate ranging from 4.5 to 12.5 litres per minute. The saturation ratio or gas concentration in the system flow line was set through the variation in the nitrogen head contained in the upper part of the radiator with nitrogen gas.
due to light refraction. A Vision research Phantom V 5 high speed camera connected to a PC was used to film and store the video clips.
The bubble shape characteristics were measured across sight glass VSG 1 (figure 2) at a representative focal plane at the centre of the sight glass. The main errors of this study originate from the limitations of the image analysis as discussed in Section 2.1 of the present study.
2.1 Image analysis
The main errors of this study originate from the limitations of the video images due to the computer
Figure 3. Schematic diagram of the test rig.
image pixel size. Illumination shadowing and manual measurement errors are also considered as potential errors. Repeatability tests done using actual experimental results and round steel bearings placed in the test section with water, resulted in a mean absolute error of 3 %. The method given by Coleman and Steele [23] was used to calculate the error in the hydraulic diameter and estimated as a mean absolute value of 1.7 %. Other errors are due to the flow meter that has an accuracy of 0.5 % whereas the pressure transducers have an accuracy of 0.3 %. The stainless steel sheathed K-type thermocouples resulted in an accuracy of ± 0.1 o C. The effect of these errors is considered to be minimal for this study’s bubble
measurement requirements. The resultant error for the Figure 2. Schematic diagram of the experimental setup.
Table 1. Experimental testing parameters
Test
Bulk fluid velocity in
heat exchanger
tubes (m / s)
System pressure
(abs) (Bars)
Heat flux (kW / m2)
System heating load (kW)
Maximum saturation ratio at wall
conditions (-)
System flow temp.
(oC)
System return temp.
(oC)
I 0.3 - 0.85 2.6 23 10.2 1.2 85 51 - 73
II 0.8 2 - 3.75 39 17 0.9 - 1.2 75 55
III 0.8 2.6 17 - 50 7.5 - 21.5 1.05 77 - 59 50
Figure 2. Schematic diagram of the test rig.
thermocouples placed on the boiler wall is larger than
that of the system’s thermocouples. This is due to the difficulty in installing these thermocouples on the inner side of the boiler tube wall. The readings were compared to a theoretical for predicting the boiler wall temperature and the error is estimated to be at 5 %.
3 Experimental results and discussion
An analysis of the two measurements recorded manually for each bubble at the boiler exit for the investigation, suggests that most bubbles are spherical in shape, with mean aspect ratios in the range of 0.9 to 1. The latter was calculated through the ratio of Dp / Dn, as illustrated in
figure 3.
Figure 3. The measured bubble geometrical parameters.
As discussed by Prodanovic et al. [13], this ratio provides a numerical quantification for the elongation of the free bubbles in bubbly flows. Figures 4 - 7 illustrate the calculated aspect ratios with the bulk fluid velocity, pressure, heat flux and saturation ratios.
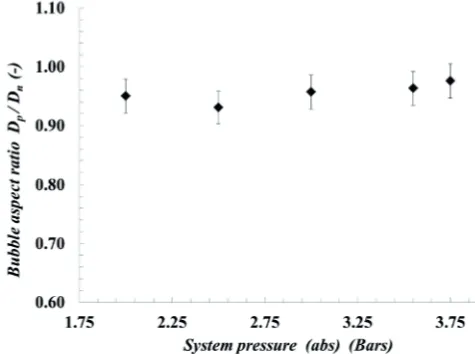
The quasi-constant mean aspect ratios illustrated in figures. 4 - 6 suggest that the pressure, heat flux and saturation ratio do not result in a measurable effect on the resultant bubble shape, while a mean aspect ratio of less than 1 for all experiments suggests a minimal bubble elongation along the fluid flow.
Figure 4. Bubble aspect ratio in vertical pipe flow at boiler exit with system pressure (abs) (Experiment II in Table 1).
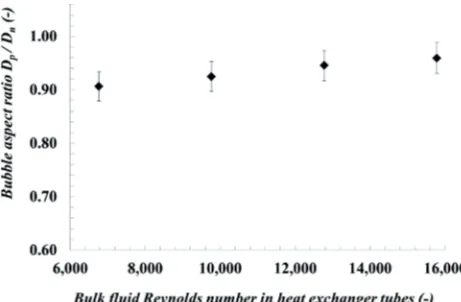
A shift in the bubble elongation was evident with a shift in the bulk fluid velocity represented through the dimensionless Reynolds number as in figure 7. Therefore, higher elongation ratios were observed with lower fluid velocities. This could be attributed to the significantly larger bubble diameters measured with reduced bulk fluid velocities, as discussed in Fsadni et al. [1]. These results are in agreement with the findings done by Liu [24] who reported that bubble elongation along the flow was observed with the presence of larger bubbles, with minimal elongation observed with smaller sized bubbles.
In view of the small bubble sizes measured in the current study, together with the negligible expected relative velocity between the two phases, the effects on the bubble shape of the average pressure fluctuations generated by the turbulent liquid fluctuations, as defined by Kocamustafaogullari et al. [9], are expected to be negligible.
Figure 5. Bubble aspect ratio in vertical pipe flow at boiler exit with heat flux. (Experiment III in Table 1)
Boiler unit
Phantom V 5 camera Vertical sight
glass VSG 1
Microscope lens
Direction of Flow Dn
Figure 6. Bubble aspect ratio in vertical pipe flow at boiler exit with maximum saturation ratio at the primary heat exchanger conditions (Experiment IV in Table 1).
Figure 7. Bubble aspect ratio in vertical pipe flow at boiler exit with bulk fluid Reynolds number in the heat exchanger tubes (Experiment I in Table 1).
The findings of the present study are also in agreement with studies done by Thang and Davis [2], Van der Welle [3], Michiyoshi and Serizawa [4], Winterton and Orby [5] and Winterton and Munaweera [6] who assumed a spherical shape for bubbles flowing in vertical pipe bubbly flow. Similarly, numerical studies done by Lu and Tryggvason [17] reported quasi spherical bubbles with diameters of 1.53 m m and slightly ellipsoidal bubbles with diameters of 1.84 m m through the application of direct numerical simulations for bubbly air water two-phase downward flow. In view of the relation between the bubble shape and bubble breakage events as discussed by Hesketh et al. [10], whereby breakage events are expected to occur as a result of substantial bubble elongation with the flow, the quasi-spherical shapes observed in the current study, suggests that bubble breakage can be assumed to be minimal.
Bubble coalescence events are also considered to be negligible in the current study due to the relatively low volumetric void fractions measured. In fact, Iskandrani and Kojasoy [11] reported that bubble coalescence is expected at a void fraction above 65 % in bubbly flows. Through the use of the dimensionless Eotvos number and the bubble Reynolds number as defined in Eqs. (1) and (2), the position of the typical bubbles measured in the current study on the bubble shape regime chart as
illustrated in figure 1, was established. The calculated dimensionless Eotvos and Reynolds numbers with the measured mean bubble diameters are tabulated in Table 2.
Table 2. Calculated dimensionless Eotvos and bubble Reynolds numbers with mean bubble diameter.
Mean bubble diameter
(m)
Eotvos number
(-)
Bubble Reynolds
number (-)
3.9 E - 4 2.36 E - 2 1.1
1.3 E - 4 1.00 E - 2 0.4
A relative velocity between the two phases of 1 E - 3 m / s was assumed [25]. The calculations tabulated in Table 2 resulted in distinctly low values for the dimensionless Eotvos and bubble Reynolds numbers, hence implying that the bubbles measured in the current study fall on the lower left corner of the bubble shape regime chart illustrated in figure 1. Therefore, this is in agreement with the findings of the present study which confirms that due to the relatively small bubble diameters measured, these being in the range of 0.13 m m to 0.39 m m [1], a quasi-spherical bubble shape can be assumed.
The present study did not allow a photographic visualization of the nucleating bubbles at the primary heat exchanger wall. Hence, the actual bubble aspect ratio at detachment was not measured. However, after consideration of the typical aspect ratios reported by the open literature at the bubble detachment point, and the mean aspect ratios at the exit of the boiler unit as measured in the present study, it can be assumed that following detachment, the smaller bubbles tend to gain a quasi-spherical shape.
4 Conclusions
This paper has presented an experimental study on the bubble shape characteristics measured in bubbly flow through the vertical pipework of a domestic central heating system. The experimental results suggest that the typical bubble is spherical in shape. Some elongation was evident with lower bulk fluid Reynolds numbers. This could be attributed to the larger bubbles that characterise such low flow rates. The present study has also compared the experimental results to the theoretical predictions manifested by the bubble shape regime diagram through the application of the dimensionless Eotvos number and the bubble Reynolds number. The prediction is in agreement with the experimental results and hence, spherical bubbles are predicted with the present experimental parameters.
heating systems has not been widely researched. Hence, the present study contributed towards the fundamental knowledge essential in understanding bubble behaviour in such systems. This could in turn lead to enhanced system performance as a result of improved deaeration technologies.
Notation
Cgas Gas concentration in system, (standard cm3/ Litre Water)
Csat Maximum gas concentration at system temperature, (standard cm3/ Litre Water)
Db Bubble diameter, (m)
Dn Bubble width as defined in figure 3, (m)
Dp Bubble width as defined in figure 3, (m)
Eo Eotvos number, (-)
g Acceleration due to gravity, (m / s2)
Pg Partial pressure of dissolved gas, (Pa)
Re Reynolds number, (-)
urel Relative velocity between phases, (m / s)
XT Gas solubility factor, (standard cm3/ Litre Water
/ bar)
Greek letters
α Saturation ratio, (-) ϒ Surface tension, (N / m) ρ Density of water, (Kg / m3) ν Kinematic viscosity, (m2/ s)
Acknowledgments
The authors would like to thank the University of Central Lancashire, the Engineering and Physical Science Research Council and Spirotech b.v. for supporting this research work.
References
1. A.M. Fsadni, Y.T. Ge, A.G. Lamers, Applied Thermal Engineering, 31, (14-15), pp. 2808-2818 (2011)
2. N.T. Thang, M.R. Davis, Int. J. Multiphase Flow, 5, pp. 17-37 (1979)
3. R. Van der Welle, Int. J. Multiphase Flow, 11
(3), pp. 317-345 (1985)
4. I. Michiyoshi, A. Serizawa, Nuclear Engineering and Design, 95, pp. 253-267 (1986)
5. R.H.S. Winterton, P. Orby, Proceedings of the 10th International Heat Transfer Conference, Brighton,6, pp. 259-299 (1994)
6. R.H.S. Winterton, J.S. Munaweera, Chemical Engineering and Processing, 40, pp. 437 – 447 (2001)
7. T.J. Liu, Heat and Mass Transfer, 19, pp. 99-113 (1993)
8. G.E.Thorncroft, J.F. Klausner, R. Mei, Heat and Mass Transfer, 41, pp. 3857-3871, (1998)
9. G. Kocamustafaogullari, W.D. Huang, J. Razi, Nuclear Engineering and Design, 148, pp. 437-453 (1994)
10. R.P. Hesketh, A.W. Etchells, T.W. Fraser Russel, Ind. Eng. Chem. Res., 30, pp. 835-841 (1991)
11. A. Iskandrani, G. Kojasoy, Nuclear Engineering and Design, 204, pp.117-128 (2001)
12. R.H.S. Winterton, Chemical Engineering Science, 27, pp. 1223-1230 (1972)
13. V. Pradanovic, D. Fraser, M. Salcudean, Int. J. Multiphase Flow, 28, pp. 1-19 (2001)
14. M. Akiyama, F. Tachibana, The Japan Society of Mechanical Engineers, 17(104), pp. 241-247 (1974)
15. D. Faraji, Y. Barnea, M. Salcudean, 10th International Heat Transfer Conference, 18-FB-4, pp. 425-430 (1994)
16. N.J. Hepworth, J.W.R. Boyd, J.R.M. Hammod, J. Varley, Chemical Engineering Science, 58, pp. 4071-4084 (2003)
17. J. Lu, G. Tryggvason, Chemical Engineering Science, 62, pp. 3008-3018 (2007)
18. K. Mishima, T. Hibiki, Y. Saito, H. Nishihara, Y. Tobita, K. Konishi, M. Matsubayashi, Nuclear Instruments and Methods in Physics Research,424, pp. 229-234 (1999)
19.
R.
Singh, W. Shyy, Journal of Computational Physics,224, pp. 150-167 (2007)20. Office of the Deputy Prime Minister, The Building Regulations, Conservation of Fuel and Power – Part L1A, Office of the Deputy Prime Minister, (2006)
21. S.F. Jones, G.M. Evans, K.P. Galvin, Advances in Colloid and Interface Science,80, pp. 27-50 (1999)
22. S. Lubetkin, M. Blackwell, Journal of Colloid and Interface Science, 26, pp. 610-615 (1988) 23. H.W. Coleman, W.G. Steele, Experimentation
and uncertainty analysis for engineers,2nd ed., New York, John Wiley & Sons Inc. (1999) 24. T.J. Liu, Heat and Mass Transfer, 19, pp. 99-113
(1993)
25. R.J. Adrian, Annual Review of Fluid Mechanics,
![Figure 1. Bubble shape regime diagram (Mishima et al., [18], Page 231).](https://thumb-us.123doks.com/thumbv2/123dok_us/8206397.1370921/2.595.63.272.258.567/figure-bubble-shape-regime-diagram-mishima-et-page.webp)