Article
A DNBR Analysis
to Patterns of Subchannel Control
Volume
Byeung-Seok Kim 1,*, Kang-Hoon Moon 1, Kang-Hoon Kim 1 and Jong-Seon Lim 1
1 Thermal-Hydraulic Design Team, KEPCO Nuclear Fuel Co., LTD, 242, Daedeok-daero 989 beon-gil, Yuseong-gu, Daejeon, 34057, Republic of Korea
* Correspondence: [email protected]
Abstract: The sensitivity of DNBR values to approaches of subchannel control volume selection has been investigated for the TS01 and TS03 out of HIPER17 CHF tests. In rod bundle analysis, most of the subchannel analyses used the coolant-centered subchannel nodal layout. But, it has been known that the rod-centered subchannel analysis showed good results for high quality critical heat flux. In this study, it was demonstrated that the rod-centered subchannel analysis showed more effective and conservative results than the coolant-centered subchannel analysis with the DNBR value, the quality, and the mass velocity. Also, it was verified that when the both results yielded from each subchannel analysis were compared, the subchannel locations at which DNBR occurred were similar.
Keywords: DNBR; Subchannel Control Volume; CHF; 5x5 rod bundle
1. Introduction
The critical heat flux (CHF) test is an important procedure in developing the nuclear fuel for the pressurized water reactor (PWR). The HIPER16 and HIPER17 fuels were developed by KEPCO NF (Korea Electric Power Corporation Nuclear Fuel) and the tests to verify the CHF correlations for two types of fuels are being performed at CEA(Commissariat à l'énergie atomique et aux énergies alternatives) in France. Several cases of many CHF test campaigns were chosen and verified to study the sensitivity of DNBR (Departure from Nucleate Boiling Ratio) values to approaches of subchannel control volume. The TS01 and TS03 campaigns out of HIPER17 CHF tests were analyzed for rod bundle CHF tests.
In rod bundle analysis, most of the subchannel analyses used the coolant-centered subchannel nodal layout. But, it has been known that the rod-centered subchannel analysis showed good results for high quality critical heat flux [1,2]. Little additional systematic work has been accomplished on the development of the constitutive relations required for this rod-centered nodal layout. For mass velocity greater than 500 kg/ s ∙ m2, agreement is satisfactory and the error is only about 7% for the
mass flux considered [3].
Various mechanistic models have been proposed so far [4,5]. Some of them predict successfully the DNB in rod bundles, however, the physical basis of these models still remains uncertain. Weisman and Pei [6] proposed a DNB model, which illustrated the DNB as the bubble congestion to reach over a constant critical void fraction in a bubbly layer close to the heated wall.
In this model, the local void fraction was evaluated by a simple two-layer model, which could not provide reasonable void fraction at thermal non-equilibrium condition in a non-uniform power distribution [7].
In our study, it will be described that the results of the rod-centered subchannel analysis are compared to those of the coolant-centered subchannel analysis with the DNBR value, the quality, and the mass velocity. Also, it will be shown that how the locations at which minimum DNBR occurs are different. So, it will be determined which subchannel analysis is more efficient, effective, and
conservative. The determined subchannel control volume will be used in the CHF correlation development for HIPER16 and HIPER17 fuels CHF tests.
2. Descriptions and Conditions
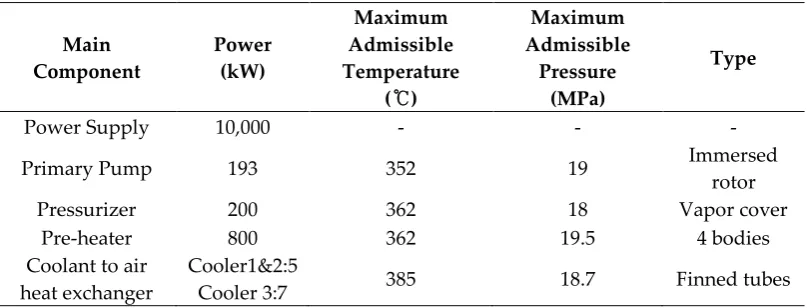
The OMEGA test facility at CEA Grenoble is a high pressure facility capable of simulating PWR bundle as 5x5 or 6x6 array fuel simulator with various heated length at PWR conditions of interest. The major loop components and their specifications are shown in Table 1. The 10 MW power supply (40kA @ 250 V DC) is equipped with a power regulation system that reduces the voltage and current fluctuation to a very low level. The loop is capable of operating with heater rods that could collapse at the high operating pressure. Therefore, a specific heater pressurization system was developed using 15 MPa nitrogen bottles. The geometrical characteristics of test bundle performed at OMEGA-2 facility in CEA are basically identical to reference HTRF (Heat Transfer Research Loop) CHF test facility of Columbia University.
Table 1.Specification of the main OMEGA loop components
Main Component
Power (kW)
Maximum Admissible Temperature
(℃)
Maximum Admissible
Pressure (MPa)
Type
Power Supply 10,000 - - -
Primary Pump 193 352 19 Immersed
rotor
Pressurizer 200 362 18 Vapor cover
Pre-heater 800 362 19.5 4 bodies
Coolant to air heat exchanger
Cooler1&2:5
Cooler 3:7 385 18.7 Finned tubes
It has a 5x5 typical cell, 9.5 mm of outside diameter heater rod, 12.6 mm of rod pitch and 3.0 m of heated length. The power distributions are radially non-uniform and axially uniform. The radial power factor of the outer 16 cold rods was approximately 82 percent of the inner 9 hot rods. The cold rods along the periphery were used to avoid CHF occurring near the non-typical wall. The desired radial power distribution was achieved by varying the overall tubing wall thickness among the rods. The rods which have high power are thick to draw more current for a given bus-to-bus voltage.
1 2 3 4 5
7 9 10
11 12 13 14 15
16 17 18 19 20
21 22 23 24 25
0 .2 5 9 c m 1 .2 8 5 c m 0 .3 3 5 c m TS01 (5by5) 6 8 Subchannel node number Rod number
Rod power factor
2 0.9252 3 0.9241 4 0.9252 5 0.9252 1 0.9252 16 0.9252 17 1.130 18 1.134 19 1.132 6 0.9263 15 0.9252 24 1.135 25 1.135 20 1.132 7 0.9241 14 0.9241 23 1.131 22 1.133 21 1.133 8 0.9252 13 0.9252 12 0.9263 11 0.9275 10 0.9263 9 0.9252 34
1 2 3 4 5 6
7 8 9 10 11 12
13 14 15 16 17 18
19 20 21 22 23 24
25 26 27 28 29 30
31 32 33 35 36
0 .2 5 9 c m TS01 (5by5) 1 .2 8 5 c m 0 .3 3 5 c m 2 0.9252 3 0.9241 4 0.9252 5 0.9252 1 0.9252 16 0.9252 17 1.130 18 1.134 19 1.132 6 0.9263 15 0.9252 24 1.135 25 1.135 20 1.132 7 0.9241 14 0.9241 23 1.131 22 1.133 21 1.133 8 0.9252 13 0.9252 12 0.9263 11 0.9275 10 0.9263 9 0.9252
(a) (b)
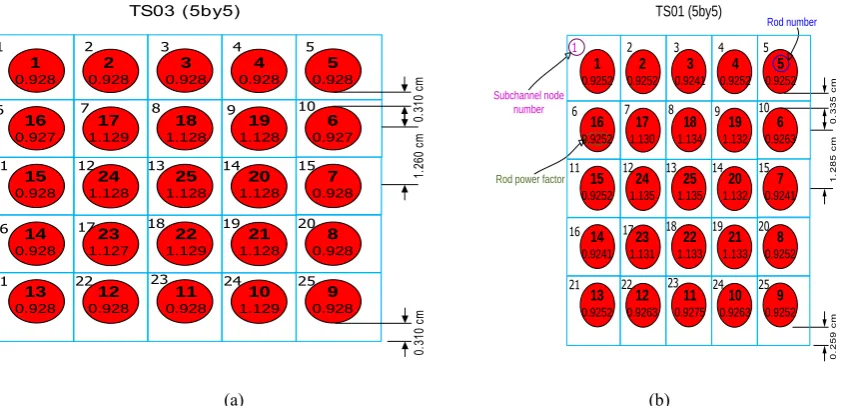
Figure 1. Patterns of subchannel control volume (a) Rod-centered subchannel; (b) Coolant-centered subchannel
In our study, using both approaches, the sensitivity of DNBR was investigated for TS01 and TS03. The geometry and subchannel nodal layout of calculation are shown in Figure 2 and Figure 3 for TS01 and TS03, respectively. Both TS01 and TS03 consist of 25 rods (5x5 array) and their rod radial powers for the tests are distributed more highly at the center. Axial rod lengths of them are 118.1 inches and their power distributions are uniform. And the rod diameter, rod pitch, rod-to-wall gap width are also shown in Figure 2 and Figure 3.
(a) (b)
Figure 2.Geometry and subchannel nodal layout for TS01 (a) Rod-centered subchannel; (b) Coolant-centered subchannel
(a) (b)
Figure 3. Geometry and subchannel nodal layout for TS03 (a) Rod-centered subchannel; (b) Coolant-centered
subchannel
1 2 3 4 5
7 9 10
11 12 13 14 15
16 17 18 19 20
21 22 23 24 25
TS03 (5by5) 6 8 1 0.928 2 0.928 3 0.928 4 0.928 5 0.928 16 0.927 17 1.129 18 1.128 19 1.128 6 0.927 15 0.928 24 1.128 25 1.128 20 1.128 7 0.928 14 0.928 23 1.127 22 1.129 21 1.128 8 0.928 13 0.928 12 0.928 11 0.928 10 1.129 9 0.928 1. 26 0 cm 0. 31 0 cm 0. 31 0 cm 0 .3 1 0 c m 1 .2 6 0 c m 0 .3 1 0 c m 34
1 2 3 4 5 6
7 8 9 10 11 12
13 14 15 16 17 18
19 20 21 22 23 24
25 26 27 28 29 30
31 32 33 35 36
The number of subchannel nodes is 25 for rod-centered subchannel and 36 for coolant-centered subchannel. The conditions for calculation are listed in Table 2. Flow area, wetted perimeter, heated perimeter, and gap width between subchannel nodes are compared with control volume approach for TS01 and TS03 shown as Table 3 and Table 4. The flow area of rod-centered approach is greater than that of coolant-centered approach. Its values are 69~228% above that of coolant-centered approach for corner and side types. This is resulted in more heat transfer rate per one subchannel node. The wetted perimeter of rod-centered approach is greater than that of coolant-centered approach. Its values are 54~159% above that of coolant-centered approach for corner and side types. This is resulted in more pressure loss per one subchannel node.
Table 2.Parameters spectrum for calculation
Parameter TS01 TS03
Pressure (MPa) 9.48~16.59 10.46~16.6
Inlet temperature (℃) 137.22~334.11 86.72~324.61 Mass velocity, G (kg/s∙m2) 1006.3~4768.5 1017.2~4871.6
Average heat flux (MW/m2) 1.3748~2.9006 1.6085~3.4196
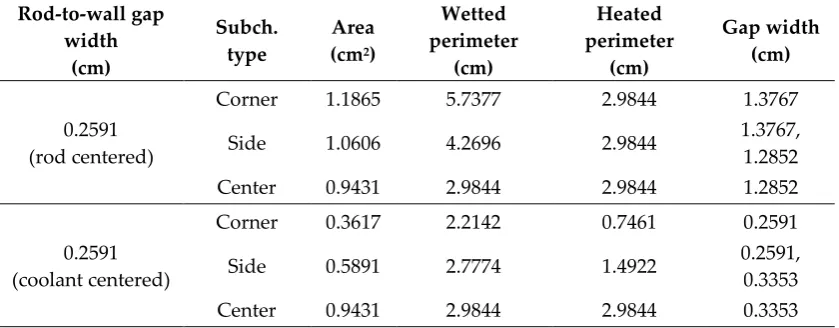
Table 3.Geometric data for rod-centered and coolant-centered subchannel for TS01
Rod-to-wall gap width
(cm)
Subch. type
Area (cm2)
Wetted perimeter
(cm)
Heated perimeter
(cm)
Gap width (cm)
0.2591 (rod centered)
Corner 1.1865 5.7377 2.9844 1.3767
Side 1.0606 4.2696 2.9844 1.3767,
1.2852
Center 0.9431 2.9844 2.9844 1.2852
0.2591 (coolant centered)
Corner 0.3617 2.2142 0.7461 0.2591
Side 0.5891 2.7774 1.4922 0.2591,
0.3353
Center 0.9431 2.9844 2.9844 0.3353
Table 4.Geometric data for rod-centered and coolant-centered subchannel for TS03
Rod-to-wall gap width
(cm)
Subch. type
Area (cm2)
Wetted perimeter
(cm)
Heated perimeter
(cm)
Gap width (cm)
0.3099 (rod centered)
Corner 1.2928 5.8139 2.9844 1.4148
Side 1.0736 4.2442 2.9844 1.4148, 1.2598
Center 0.8784 2.9844 2.9844 1.2598
0.3099 (coolant centered)
Corner 0.4388 2.3158 0.7461 0.3099
Side 0.6344 2.7520 1.4922 0.3099
Center 0.8784 2.9844 2.9844 0.3099
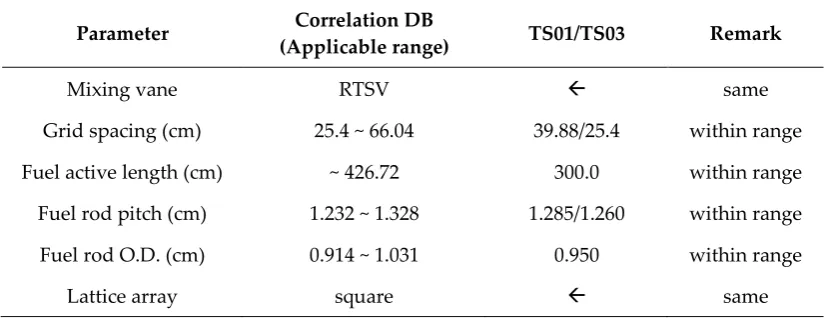
Table 5.Geometric data for rod-centered and coolant-centered subchannel for TS03
Parameter Correlation DB
(Applicable range) TS01/TS03 Remark
Mixing vane RTSV same
Grid spacing (cm) 25.4 ~ 66.04 39.88/25.4 within range
Fuel active length (cm) ~ 426.72 300.0 within range
Fuel rod pitch (cm) 1.232 ~ 1.328 1.285/1.260 within range
Fuel rod O.D. (cm) 0.914 ~ 1.031 0.950 within range
Lattice array square same
3. Comparison of Results
Figure 4 shows the variation of M/P with quality for TS01 and TS03. M/P is measured heat flux over predicted heat flux. The quality of rod-centered subchannel is a little bit higher than that of coolant-centered subchannel. Because the heat transfer rate of rod-centered subchannel which has a larger flow area predicts higher than that of coolant-centered subchannel.
(a) (b)
Figure 4.Variation of M/P with quality (a) TS01; (b) TS03
(a) (b)
Figure 5.Variation of M/P with mass velocity (a) TS01; (b) TS03
0.05 0.10 0.15 0.20 0.25 0.30 0.35
0.8 0.9 1.0 1.1 1.2 1.3 1.4 1.5 1.6 1.7 1.8 1.9
TS01
Rod-centered Coolant-centered
M/
P
Quality
0.02 0.04 0.06 0.08 0.10 0.12 0.14 0.16 0.18 0.20 0.22 0.24 0.7
0.8 0.9 1.0 1.1 1.2 1.3 1.4 1.5
TS03
Rod-centered Coolant-centered
M/
P
Quality
1000 1500 2000 2500 3000 3500 4000 4500 5000 0.8
0.9 1.0 1.1 1.2 1.3 1.4 1.5 1.6 1.7 1.8 1.9
TS01
Rod-centered Coolant-centered
M/
P
Mass velocity (kg/s m2
)
1000 1500 2000 2500 3000 3500 4000 4500 5000 0.7
0.8 0.9 1.0 1.1 1.2 1.3 1.4 1.5
TS03
Rod-centered Coolant-centered
M/
P
Mass velocity (kg/s m2
Figure 5 shows the variation of M/P with mass velocity for TS01 and TS03. Mass velocity of centered subchannel is lower than that of coolant-centered subchannel. The higher quality of rod-centered subchannel has the lower density and this relates the lower mass velocity. Figure 6 shows the variation of M/P with pressure for TS01 and TS03. When the results are compared, M/P of rod-centered subchannel is a little bit higher than that of coolant-rod-centered subchannel at the same pressure. It is concluded that the result of rod-centered subchannel is more conservative than that of coolant-centered subchannel due to higher quality. The averaged M/P of TS01 is 1.085 and 1.072 for rod-centered and coolant-centered, respectively. Its deviation is 12.1%. The averaged M/P of TS03 is 0.976 and 0.969 for rod-centered and coolant-centered, respectively. Its deviation is 7.2%.
(a) (b)
Figure 6.Variation of M/P with pressure (a) TS01; (b) TS03
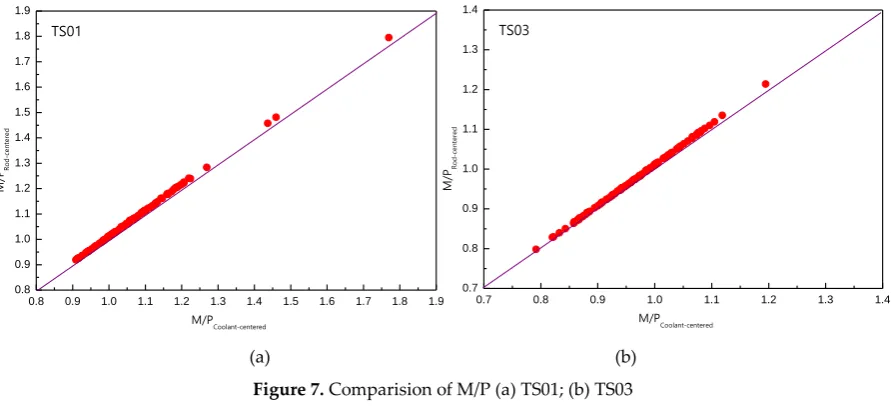
Figure 7 shows the comparison of M/P with each subchannel control volume for TS01 and TS03. Both cases show that the M/P with rod-centered subchannel is a little bit higher than that with coolant-centered subchannel. As mentioned in Figure 6, also, the results of rod-centered subchannel are more conservative than those with coolant-centered subchannel in a point of view of DNBR.
(a) (b)
Figure 7.Comparision of M/P (a) TS01; (b) TS03
Figure 8 and 9 show the location of MDNBR with each subchannel control volume for TS01 and TS03. The location at which minimum DNBR occurs is 13th subchannel node for rod-centered approach and 22th node for coolant-centered approach.
9 10 11 12 13 14 15 16 17
0.7 0.8 0.9 1.0 1.1 1.2 1.3 1.4 1.5 1.6 1.7 1.8 1.9
TS01
Rod-centered (=1.08496, =0.12536) Coolant-centered (=1.07187, =0.12244)
M/
P
Pressure (MPa) 10 11 12 13 14 15 16 17
0.7 0.8 0.9 1.0 1.1 1.2 1.3 1.4 1.5
TS03
Rod-centered (=0.97852, =0.07888) Coolant-centered (=0.96862, =0.07671)
M/
P
Pressure (MPa)
0.8 0.9 1.0 1.1 1.2 1.3 1.4 1.5 1.6 1.7 1.8 1.9
0.8 0.9 1.0 1.1 1.2 1.3 1.4 1.5 1.6 1.7 1.8 1.9
TS01
M/PCoolant-centered
M/
PRo
d-ce
nt
ere
d
0.7 0.8 0.9 1.0 1.1 1.2 1.3 1.4
0.7 0.8 0.9 1.0 1.1 1.2 1.3 1.4
TS03
M/PCoolant-centered
M/
PRo
d-ce
nt
ere
(a) (b)
Figure 8.Locations of MDNBR for TS01 (a) Rod-centered subchannel; (b) Coolant-centered subchannel
(a) (b)
Figure 9.Locations of MDNBR for TS03 (a) Rod-centered subchannel; (b) Coolant-centered subchannel
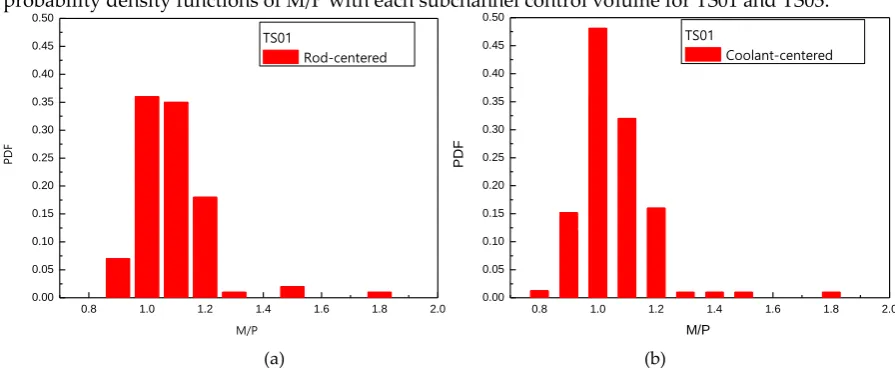
The locations at which minimum DNBR occurs are very adjacent. Figure 10 and 11 show probability density functions of M/P with each subchannel control volume for TS01 and TS03.
(a) (b)
Figure 10.Probability density function of M/P for TS01 (a) Rod-centered subchannel; (b) Coolant-centered subchannel
1 2 3 4 5
7 9 10
11 12 13 14 15
16 17 18 19 20
21 22 23 24 25
TS01 (5by5) 6 8 2 0.9252 3 0.9241 4 0.9252 5 0.9252 1 0.9252 16 0.9252 17 1.130 18 1.134 19 1.132 6 0.9263 15 0.9252 24 1.135 25 1.135 20 1.132 7 0.9241 14 0.9241 23 1.131 22 1.133 21 1.133 8 0.9252 13 0.9252 12 0.9263 11 0.9275 10 0.9263 9 0.9252 34
1 2 3 4 5 6
7 8 9 10 11 12
13 14 15 16 17 18
19 20 21 22 23 24
25 26 27 28 29 30
31 32 33 35 36
TS01 (5by5) 2 0.9252 3 0.9241 4 0.9252 5 0.9252 1 0.9252 16 0.9252 17 1.130 18 1.134 19 1.132 6 0.9263 15 0.9252 24 1.135 25 1.135 20 1.132 7 0.9241 14 0.9241 23 1.131 22 1.133 21 1.133 8 0.9252 13 0.9252 12 0.9263 11 0.9275 10 0.9263 9 0.9252
1 2 3 4 5
7 9 10
11 12 13 14 15
16 17 18 19 20
21 22 23 24 25
TS03 (5by5) 6 8 1 0.928 2 0.928 3 0.928 4 0.928 5 0.928 16 0.927 17 1.129 18 1.128 19 1.128 6 0.927 15 0.928 24 1.128 25 1.128 20 1.128 7 0.928 14 0.928 23 1.127 22 1.129 21 1.128 8 0.928 13 0.928 12 0.928 11 0.928 10 1.129 9 0.928 34
1 2 3 4 5 6
7 8 9 10 11 12
13 14 15 16 17 18
19 20 21 22 23 24
25 26 27 28 29 30
31 32 33 35 36
TS03 (5by5) 1 0.928 2 0.928 3 0.928 4 0.928 5 0.928 16 0.927 17 1.129 18 1.128 19 1.128 6 0.927 15 0.928 24 1.128 25 1.128 20 1.128 7 0.928 14 0.928 23 1.127 22 1.129 21 1.128 8 0.928 13 0.928 12 0.928 11 0.928 10 1.129 9 0.928
0.8 1.0 1.2 1.4 1.6 1.8 2.0
0.00 0.05 0.10 0.15 0.20 0.25 0.30 0.35 0.40 0.45 0.50 TS01 Rod-centered PDF M/P
0.8 1.0 1.2 1.4 1.6 1.8 2.0
(a) (b)
Figure 11. Probability density function of M/P for TS03 (a) Rod-centered subchannel; (b) Coolant-centered subchannel
4. Conclusions
The results with rod-centered subchannel are more conservative than those with coolant-centered subchannel in a point of view of DNBR. The locations at which minimum DNBR occurs are similar. So, rod-centered subchannel control volume analysis is more efficient with for CHF tests with HIPER16 and HIPER17 fuel. This reliable rod-centered approach will be considered as an alternative to the more rigorous approach used for CHF prediction in a rod bundle.
Also, the sensitivity of transverse momentum parameter was investigated, but its effect was not so much to DNBR for very high mass velocity. The each subchannel can be considered separately without considering the effects of its adjacent subchannels.
Funding: This work was supported by KEPCO NF’s Project(Assessment to the Effect of RCS Zinc Injection System Implementation for BNPP Units 1&2), and authors would like to appreciate this support.
Acknowledgments: The authors wish to thank Manager Dong UK Choi for the helpful comments to prepare this study.
Conflicts of Interest: The authors declare no conflict of interest.
References
1. Gaspari, G.P.; Hassid, A.; Vanoli, G. Some Consideration on Critical Heat Flux in Rod Clusters in Annular Dispersed Vertical Upward Two-Phase Flow. Proc. of 4th Int. Heat Trans. Conf. Session B6, Paris, France, 1970.
2. Gaspari, G.P.; Hassid, A.; Lucchini, F. A Rod-Centered Subchannel Analysis with Turbulent(enthalpy) Mixing for Critical Heat Flux Prediction in Rod Clusters Cooled by Boiling Water. Proc. of 5th Int. Heat Trans. Conf. Session B6, Tokyo, Japan, 1974.
3. Talebi, S.; Kazeminejad, H. A Mathematical Approach to Predict Dryout in a Rod Bundle. Nucl. Eng. and Design, 2012; 249, pp. 348-356.
4. Nahm, K.Y.; Lim, J.S.; Chun, C.K.; Park, S.K.; Song, S.C. Development Status of THALES Code. Trans. of the Korean Nucl. Soc. Autumn Meeting, Pyeongchang, Korea, 2008.
5. Lee, C.H.; Mudawar, I. A Mechanistic Critical Heat Flux Model for Subcooled Flow Boiling Based on Local Bulk Flow Conditions. Int. J. of Multiphase Flow, 1988; 14, pp. 711-728.
6. Weisman, J.; Pei, B.S. Prediction of Critical Heat Flux in Flow Boiling at Low Qualities. Int. J. of Heat and Mass Trans. 1983; 26, pp. 1463-1477.
7. Sasakawa, T; et al. Mechanistic DNB Model for an Advanced Sub-Channel Analysis of Rod-Bundle. Proc. of the 13th Int. Topical Meeting on Nucl. Reactor Thermal Hydraulics (NURETH-13), Kanazawa, Japan, 2009.
0.7 0.8 0.9 1.0 1.1 1.2 1.3 1.4 1.5
0.00 0.05 0.10 0.15 0.20 0.25 0.30 0.35 0.40 0.45 0.50
TS03
Rod-centered
M/P
0.7 0.8 0.9 1.0 1.1 1.2 1.3 1.4 1.5
0.00 0.05 0.10 0.15 0.20 0.25 0.30 0.35 0.40 0.45 0.50
TS03
Coolant-centered