a
Combining the merits of experiments and numerics in flow stability
analysis
Rick de Lange1,a
1
Dept. Mech. Engineering, Eindhoven University of Technology, 5600 MB Eindhoven, the Netherlands
Abstract. Boundary layer transition is a determining factor for drag and convective heat transfer for solid bodies moving through a fluid. The transition zone is known to depend on the level of main stream turbulence. Heat transfer experiments will show the different intermittency profiles. Numerical analysis will show the influence of velocity streaks. Detailed flow experiments are used to determine a possible breakdown mechanism, which, in its turn, will be studied in a model numerical analysis.
1 Introduction
This paper presents the results of a combination of experimental and numerical studies of bypass transition in boundary layers exposed to free-stream turbulence. An important practical example of this type of transition is the boundary layer transition process in a gas turbine. The inlet temperature of the turbine section is a very important parameter in the gas turbine process. Increasing this temperature results in an increase of the specific power and in the efficiency of the gas turbine unit. This is an important aspect in relation to the increasing demand for light and powerful turbines. The limiting aspect for this trend is the metallurgic load of the turbine blades; the high rotational velocities of the turbine blades in combination with the high gas inlet temperature results in a load near the maximum allowable load. To put the gas inlet temperature to the limit and avoid damage to the turbine blades detailed knowledge on the heat transfer from the hot combustion gas to the turbine blade is essential.
As the hot combustion gasses flow along the surface of the blades a boundary layer develops and the heat transfer is directly related to the flow conditions in this layer. As the boundary layer transits from laminar to turbulent the heat transfer increases. As result the heat transfer in the turbulent parts of the boundary layer is around a factor three larger compared to the laminar parts. At this point it is important to note that the standard flow conditions in a gas turbine are so that around half of the chord of a turbine blade is located in the transitional regime of the blade boundary layer. Therefore it is essential to study the turbine blade transition process.
The combustion process and rotor stator interaction introduces a lot of disturbances in the main gas stream. Due to these strong free-stream disturbances the
curvature of the turbine blades has a negligible influence on the turbine blade transition process. Therefore, an important simplification is justified: the turbine blade transition process can be modelled as a flat plate transition process.
In the transition region the flow experiences an intermittent behaviour. Some part of the time the flow is laminar and some part of the time it is turbulent. The intermittent behaviour in the transition region is a result of the presence of turbulent spots in a laminar flow field. They appear randomly in time and in space in the boundary layer. A turbulent spot is a result from the fact that the boundary layer flow on a flat plate is not unconditionally stable. While proceeding downstream, the turbulent spot increases in size and merges with other spots or even can generate new spots itself. After a certain downstream location, individual spots can no longer be recognized; here the boundary layer has become completely turbulent.
In this paper, first the effect of main stream turbulence on the heat transfer profile will be examined using Ludwig tube heat-transfer experiments. Next, the generation process of turbulent spots is studies in a combination of numerical simulations and PIV-waterchannel experiments. The results will indicate that it is the unsteady generation of so-called velocity streaks (through optimal growth) which lead to streak-streak interactions causing breakdown to turbulence.
2
Heat transfer experiments in Ludwig
tube
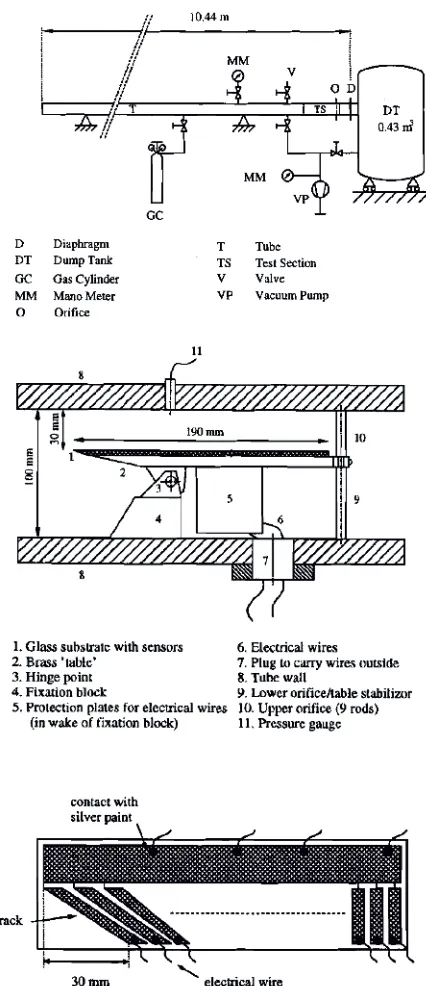
Our first experiments in the 1990’s were performed in a Ludwig tube (figure 1). Where we use the expansion wave travelling time to perform subsonic turbulent flow C
Owned by the authors, published by EDP Sciences, 2014
measurements on a flat plate. To find the heat transfer (extremely) fast temperature measurements [ref 1] are used with a flux reconstruction technique.
The flat plate is mounted in the square tube cross section as shown in figure 1 with thin titanium film gauges used as temparture sensitive resisitance.
The experiments [ref 2] performed show that for ~1% main stream turbulence levels (induced using static grids), the transition region can be described using the Narashima (or Johnson) intermittency description (figure 2). Experiments at higher turbulence intensities show a forward shift of the intermittency profile and a (slight) change in its initial stage (figure 3)
Figure 1. A schematic of a Ludwig tube experiment (top) with a flat plate mounted in its squre cross section (middle) using titanium thin film gauges on a glass substrate (bottom).
Figure 2. The measured intermittency for Tu ~1% compared to the Narashima/Johnson models.
Figure 3. The measured intermittency for Tu 1.6-4.0%.
The Narashima/Johnson intermittency models are based on the assumption of turbulent spots being created starting from some streamwise position and as these spots grow and merge the intermittency rises. These spots were already described in the paper by Emmons [ref 4]. A turbulent spot is a wedge shaped patch of turbulence in a laminar surrounding with a height approximately equal to the expected turbulent boundary layer height. Behind the trailing edge, a stable flow is observed: the “calmed-region” where the laminar boundary layer restores. The passing of these spots in the transition region causes the intermittent behavior. In our experiments we were able to show the typical heat transfer signature of a spot (figure 4).
After proper scaling we were also able to show that this signature is self-similar (figure 5). This means that the structure of the turbulent spot remains the same as it grows and flows downstream.
transfer in a boundary layer, they give, unfortunately, no explanation as to how spots are generated and how this process is influenced by the main stream turbulence.
Figure 4. The heat transfer signature of a turbulent spot.
Figure 5. The self-similarity of the heat transfer signature turbulent spots.
Figure 6. A visualisation of bypass transition from a numerical study (courtesy P. Schlatter).
4 Streaks
At the turn of the century, the first publications on non-modal growth in a boundary layer were published. The non-modal growth theory is a linear extension of the modal stability analysis and is based on the assumption
that perturbations in a shear layer can grow to a certain extend (after which they shrink). If the initial perturbation is strong enough, this growth can lead to a non-linear sustained structure, which in its turn could lead to turbulent breakdown. The optimal disturbance (which experiences maximum temporal growth) consists of spanwise vortices, which give rise to a spanwise alternating pattern of low and high speed streaks.
At KTH several numerical studies have been done using DNW and LES (figure 6) to study the generation of streaks under moderate levels of main stream turbulence. Due to a number of numerical restrictions, these calculations start with an undisturbed developed laminar boundary layer (with certain thickness). Therefore, the development of early disturbances nor leading edge phenomena can be taken into account. To study the bypass-transition process experimentally we have set up a waterchannel experiment (figure 7) in which the flow can be visualised and studied with PIV.
Figure 7. Schematic of the waterchannel setup.
The PIV experiments are performed in a plane parallel to the flat plate surface (at a constant wall normal distance of 4 mm). For different experiments, we either use a stationary or streamwise traversing measuring section.
The experiment shown in figure 8 shows a large measuring section (of about 500 mm wide “z”) travelling with the flow. The combination of all images adds to a streamwise (“x”) view of the full plate length. For each measurement the mean speed is subtracted, which leaves the velocity disturbances. Clearly, the image shows very long high and low-speed streaks, which appear to be stable for this run.
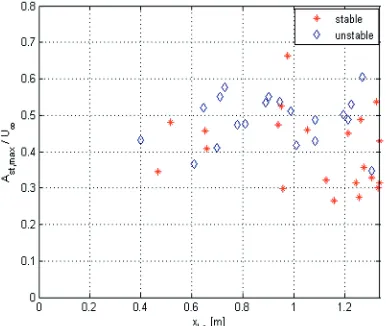
From these types of experiments, it is easy to deduce the streak amplitude as a function of streamwise distance during different runs as is shown in figure 9. Furthermore, the markers indicate whether the streaks are breaking down into turbulence or not.
Figure 8. A PIV result indicating the velocity disturbances (blue is low and red is high).
Figure 9. PIV result for the amplitude of streamwise streaks during different runs.
5 Breakdown
Our first investigation in the breakdown mechanism was a visualisation with a stationary camera to observe the changing of ink-line patterns in time, where the ink was injected near the leading edge of the plate (within the boundary layer). The results of these experiments showed that at irregular positions and times, one could observe strong oscillations in the ink-streak pattern which lead to turbulent spots as shown in figure 10.
To study to initiation of these spots, we again turn to a camera moving with the flow. Naturally, this leads to a large number of experiments which do not show breakdown or show breakdown at positions in the camera where it can only partly be observed. Figure 11 shows a sample of experiments, where the growth of a disturbance is clearly visible. Sequences of this breakdown have been published in [5].
As figure 11 indicates, we observed two distinctly different breakdown patterns: sinuous (a long single wave-like pattern) and varicose (a shorter double
anti-symmetric wave). Although different occurrences of breakdown all had slightly different features, their main characteristics could be quantified (see [5]).
Figure 10. Inc-patterns showing three turbulent spots
Figure 11. Inc-patterns during sinuous (top) and varicose (bottom) breakdown.
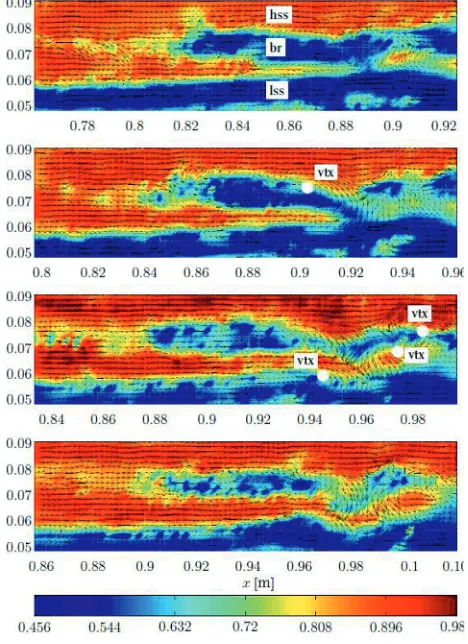
With the breakdown patterns have been identified, we turn to PIV to further investigate what drives the breakdown (see [6]). Naturally, the only way to do this is to use the moving camera again. Therefore, we used two cameras simultaneously: one to record the PIV-images and one to observe the inc-patterns to show whether breakdown takes place at a proper position for analysis. Only if such breakdown occurs the PIV-images are processed. Figure 12 shows a sequence of PIV images recorded during varicose breakdown.
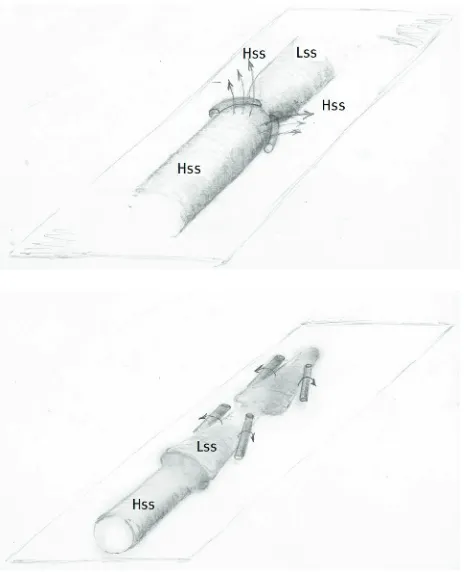
(stream upward). As the high-speed streak moves faster through the boundary layer, the streaks are bound to meet. This happens during the recorded sequence (unfortunately at the far left of the picture). As the collision region develops, (counter-rotating) vortices are generated on both sides of the streaks. In figure 13, we have drawn an artist impression of the developing structure. This led us to believe that it is in fact the irregular generation of the streaks, which leads to streak collisions and that in its turn is responsible for streak breakdown (thus occurring in the collision area between low- and high-speed streaks).
Figure 12. PIV experiments during the development of a varicose breakdown.
It is unfortunately extremely hard to generate PIV data for these phenomena. As stated, the breakdown occurs irregularly, in different modes and (with the restricted measuring section of 100x100 mm for PIV) almost always in the edges of the measuring plane. The hypothesis of breakdown in streak collisions was
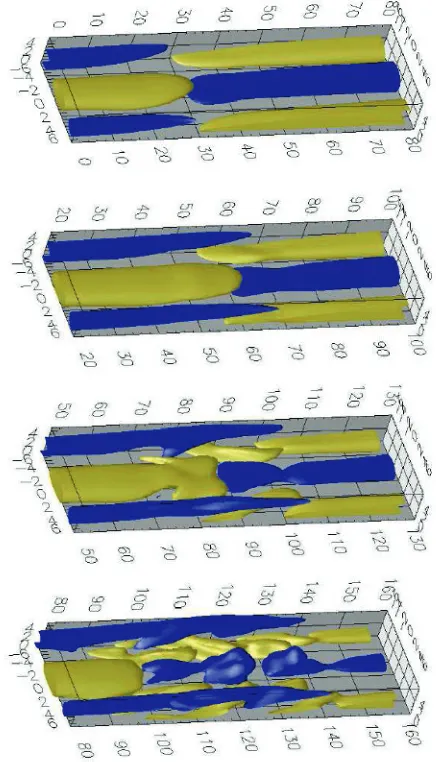
therefore put to the test in a numerical setup (published in [7]). To do so, the KTH-code was used in a much more confined numerical domain. As inflow condition the optimal streaks (as predicted in optimal growth theory) are superimposed on the laminar boundary layer. After a while this leads to developed (steady) streaks in the full domain. Next, the inflow condition is changed (taken a smoothed path over a certain time) to a spanwise shifted pattern of the same optimal streaks. With this procedure, two subsequent streak patterns are generated at some streakwise interval (proportional to the time lapse between the two optimal streakpatterns). In figure 14, the result of such a simulation can be seen. Obviously, the shown pattern shows a clear resemblance to the artist impression in figure 13.
Figure 13. Artist impression of the start (top) and development (bottom) of vortical structures in a varicose breakdown (hss and lss are high-speed and low-speed streak, respectively).
The conclusion of this simulation must be that varicose breakdown can indeed be generated at the interface of two subsequently generated streak-patterns. Now, it is tempting to try different spanwise shifts. As the full-shift led to varicose breakdown, could a partial shift be the cause of sinuous breakdown? Figure 15 shows a typical example of a simulation using a smaller spanwise shift (of course a very small shift leads to such similar streak-patterns that no breakdown occurs). The breakdown shown here has distinctly different features from those in the varicose case. However, these features do not include the long wave-like structures which are characteristic for sinuous breakdown.
these structures occurring experimentally. Firstly, we looked into the inc-visualisations, to see if there were breakdown occurrences which might classify as different from sinuous and varicose. The structure we found in shown in figure 16, we named it single branch breakdown.Its structure appears to be very similar to sinuous breakdown. However, the wave is much shorter and breakdown occurs much faster.
The PIV images in figure show a short intrusion area of and high-speed fluid in opposite high- and low-speed streaks. The vortex which develops at this interface is amplified by the shear at the interface.
Figure 14. Numerical simulation of a streak-streak interaction leading to varicose breakdown (blue is low and yellow is high speed disturbance).
The remaining breakdown structure, sinuous breakdown, has also been analysed in the PIV sequences (figure 18). In this case, the streaks are lying side by side and while they are moving upstream, they bend more and more. At some point (already visible in the second frame) small breakpoints in the streaks start to occur. And, after a while, this develops into the vortical structure, which is visible in the lower frame. The shape and development of the instability, again seems to point towards a shear
instability at the interface of a low- and high-speed streak (as shown in the artist impression in figure 19). As it seems, that this cannot be merely caused by the shear itself (otherwise all streaks should breakdown). The most probable explanation is that the instability is triggered by a penetrating mainstream disturbance. This hypothesis has been tested numerically in ref [8].
Figure 15. Numerical simulation of a streak-streak interaction for a small spanwise shift.
Figure 16. Inc visualisation for single branch breakdown
6 Conclusion
for different main stream turbulence levels: the higher the turbulence level the more streaks are generated, which leads to a higher rate for breakdown collisions. The most challenging question which still needs to be answered is the leading edge problem: how does the flow at the leading edge influence the generation of streaks. Unfortunately neither experimental nor numerical tools are available to study this process.
References
1. C.J. Hogendoorn, H.C. de Lange, A.A. van Steenhoven, Measurement Science and Technology, 9(3), 428 (1998)
2. C.J. Hogendoorn, H.C. de Lange, A.A. van Steenhoven, M.E.H. van Dongen, ASME, 97-GT-47 (1997)
3. H.C. de Lange, C.J. Hogendoorn, A.A. van Steenhoven, Int. Comm. in Heat and Mass Transfer, 25(3), 331 (1998)
4. H.W. Emmons, J. Aero. Sci. 18, 490-498, 1951
5. J. Mans, H.C. de Lange, A.A. van Steenhoven,
E.F.M.C. 6, 74 (2006)
6. J. Mans, Streak development and breakdown during bypass transition, PhD thesis TU/e (2007)
7. L. Brandt, H.C. de Lange, Phys. Fluids, 20: 024107, (2008)
8. P. Schlatter, L. Brandt, H.C. de Lange, D.S. Henningson, Phys. Fluids, 20:101505 (2008)
Figure 17. PIV result of a single branch breakdown.
Figure 18. PIV sequence during sinuous breakdown.