a
Corresponding author: [email protected]
CFD simulation of vented explosion and turbulent flame propagation
Aleš Tulach1,a, Miroslav Mynarz 1 and Milada Kozubková2
1
VSB – Technical University of Ostrava, Faculty of Safety Engineering, Department of Fire Protection, Lumírova 630/13, Ostrava - Výškovice, 700 30, The Czech Republic
2
VSB – Technical University of Ostrava, Faculty of Mechanical Engineering, Department of Hydromechanics and Hydraulic Equipment, 17.listopadu 15/2172, Ostrava -Poruba, 708 33, The Czech Republic
Abstract.Very rapid physical and chemical processes during the explosion require both quality and quantity of detection devices. CFD numerical simulations are suitable instruments for more detailed determination of explosion parameters. The paper deals with mathematical modelling of vented explosion and turbulent flame spread with use of ANSYS Fluent software. The paper is focused on verification of preciseness of calculations comparing calculated data with the results obtained in realised experiments in the explosion chamber.
1 Introduction
At present number of incidents increases, where there gas exploded in residential homes. In the fire-fighting safety engineering we can use a functioning mathematical model for prediction of the risks and consequences caused by the explosion. It is moreover possible to determine the strength and possible propagation of the pressure wave and of turbulent flames.
We used for simulation of explosion in this task the software ANSYS Fluent [1], which belongs to the programs designed for advanced simulation of physical-chemical processes, which address the processes associated with flow, kinetics of chemical reaction and heat transmission.
2 Experimental part – Physical model
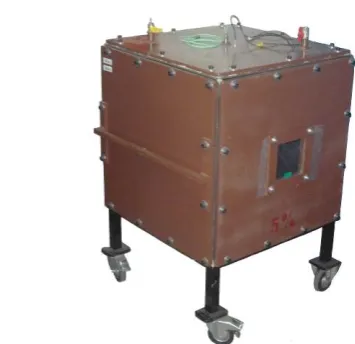
Experimental measurements were performed on the test device, the primary component of which was a blast chamber in the shape of a cube with the edge length of approx. 650 mm (Figure 1). Total internal volume of the device is 250 dm3. The test device comprises a stirrer, which serves for homogenisation of the investigated explosive mixture. It consists of a high speed motor with a clarifying propeller powered by low voltage. Explosive mixture was prepared in the chamber with use of inlet valves. Concentration of the mixture is determined by gas detection devices, in several points of the chamber [2].
Figure 1 Variable blast chamber VVK 250
The reduced explosion pressure was determined by dynamic pressure sensor with the frequency response of 20 kHz. The signal from the pressure sensor was recorded via the charge amplifier and A/D converter by computer. The temperature was measured by a temperature sensor and it was recorded in computer via the digital thermometer. Reading of the response of the chamber shell was performed by the digital sensor with accuracy of 0.01 mm, located in the centre of the wall. Evolution of explosion and length of the flame was measured by high-speed and digital camera. Initiation was performed by an electrical pyrotechnical match EMP-SO with initiating energy of 86 J, and it was by low voltage. The match consists of a pyrotechnic pill, containing pyrotechnic component and supply leads with a total weight of 8 g (Figure 2).
C
Owned by the authors, published by EDP Sciences, 2015
Figure 2 Electrical pyrotechnical match EMP-SO
Initiation of the mixture was realised in the centre of the chamber, where the matchwas mounted (Figure 3).
Figure 3 Location of electricpyrotechnical match EMP-SO
2.1 Measuring procedure
The measurement consisted of three specific parts, within which specified tasks were preformed. In the first stage a set of venting diaphragms from wax paper with average thickness of 0.06 mm was prepared; their specific weight was determined to be 0.092 kg · m2. These membranes were therefore almost without the moment of inertia and they thus did not decelerate the venting process. The membrane was installed with use of a mounting flange on the square hole of 200 × 200 mm with the area A = 0.04 m2 in the shell of the test device. Five experiments were made for determination of the values of static activation pressure of the membrane [3] and the average value was 0.23 bar. The measurements were carried out at atmospheric pressure patm = 0.961 bar and at room temperature Ti = 14 °C [4].
In the second stage an explosive mixture was prepared in the device. We chose methane (CH4) as flammable gas for creation of an explosive mixture. It is the most widely used and the simplest alkane and therefore also the simplest hydrocarbon at all. After homogenisation of the mixture of methane and air an idle period followed, which was necessary for calming of the flow in the chamber, so that the turbulence of air mass was close to zero. The test device contained no obstacles that would cause a significant increase in turbulence.
The third phase involved the initiation of the mixture (in the centre of the chamber) and recording of all monitored parameters.
3 Theoretical part – numerical model
Used mathematical models are given by the continuity equation, equations of motion, equations for transfer of turbulent variables with the additional transfer of mass fractions of impurities, or of molar concentrations. Transfer of admixtures (of mass fraction) is solved using the balance equation, which in the changing time calculates with the time-averaged variables, i.e., with mass fractions of present gases and velocity components and pressure of the flow. We assumed a diffusion flow of the ith component of the mixture, the rate of production of impurities due to the chemical reaction and rate of formation of increments from distributed admixture. Distribution of admixtures varies according to the diffusion flow. Generally the diffusion flow is divided for laminar or turbulent flow [5].
Modelling of combustion process can be made in the program ANSYS Fluent in the following manner [6]:
1) either by defining the source of heat and of combustion products, which does not take into account chemical reactions (for complex tasks with difficult determination of chemical reaction), and by defining the combustion parameters by direct value of thermal performance of the heat source and of the main components of combustion products formed during combustion.
2) or by defining the chemical reaction of combustion at presence of heat and chemical agents. In this case, however, we must know the stoichiometric equations of reactions. It is also necessary to know the detailed information about the physical and chemical properties of the substances involved in chemical reactions. This calculation method is suitable in terms of time for a small number of chemical reactions (for example for simplified models of methane combustion).
The method of combustion is very important for entering the equations of chemical reactions into the program ANSYS Fluent. If all combustible components in the fuel are burnt and the reaction mixture does not contain any inflammable substance, we describe it as perfect combustion. Incomplete combustion occurs when the present flammable substance is not completely burnt and the reaction mixture still contains flammable substances newly formed by chemical reaction. In such case it is necessary to describe the action of the chemical reaction by a larger number of equations [8].
It is possible to enter into the program ANSYS Fluent virtually any number of equations for chemical reactions. Apart from this feature the program contains already preset two chemical models for combustion of methane (chemical equations with stoichiometric coefficients, with the order of the reaction, with the pre-exponential factors, and activation energies), which differ by selection of the present gas mixture [5].
Combustion of methane in the solved task runs according to the single-equation description of the chemical reaction.
We entered also the values of the Pre-Exponential Factor (1.35e + 20) and of Activation Energy (1.225e + 08 J / kmol) [5].
The time-dependent tasks are much more demanding to computation time. Balance equation must be discretised in time and space. Spatial discretisation for time-dependent equations is identical to the stationary task. Temporal discretisation involves the integration of each member of the differential equation with the defined time step. Magnitude of the time step can be estimated on the basis of the nature of the solved task and the number of external iterations at each time step. Calculations usually begin with a small time step, which gradually increases during the calculation. Calculation time is influenced also by a plethora of other factors. For example, the quality of the computer network, the number of calculated equations in one time step, setting of the calculation accuracy, and many others [7].
3.1 Model geometry
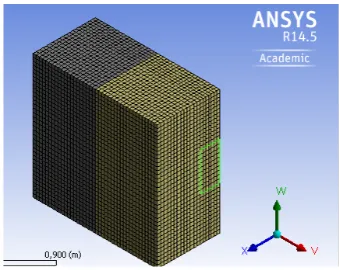
Geometry of numerical model was designed in the program Design Modeler. Symmetric character of the experiment was used in the task. We thus modelled only half of the blast chamber VVK 250 (Figure 5). The second half of the chamber was replaced with an boundary condition of the type “Symmetry”, which enable acceleration of calculation and refinement of the calculation network.
The geometry ignored the thickness of walls of the blast chamber. Heat transfer between the walls was solved by the function “Coupled” and by entering the wall width.
The geometry consists of the blast chamber VVK 250 and of six volumes adjoining the chamber (areas of propagation of turbulent flame) (Figure 4).
Figure 4. Geometry of the whole calculation space
The hole, in which the membrane was placed during the experiment, was simulated by extraction of the area of 200 × 100 mm.
3.2 Calculation network of the model
Due to the fact that the geometry is composed of regular blocks, it was possible to use the method of „extraction of calculation network by identical cubic cells“, with use of
the pre-defined number of elements at the edges delimiting the calculation space.
Splitting of geometry to several volumes simplified the cross-linking. Each volume could thus be cross-linked with different size of cells.
In the case of cross-linking of the internal volume of the blast chamber the network is composed of 28,800 elements (Figure 5).
The figure shows the difference between a fine network in the area of the blast chamber and in the space in front of expected propagation of turbulent flame, and a rough network in the remaining surrounding space (Figure 6).
Figure 5 Calculation network of the blast chamber
Figure 6 Densification of the calculation network of the blast chamber and areas of backfiring
The final version of the calculation network consists of 305 760 elements (Figure 7), and parameter for determination of quality of the 3D cell (degree of its deformation) is 0.445. The network is therefore satisfactory.
3.3 Models of fluid flow and boundary conditions
In the assessed case we have a strong turbulent flow. We chose five mathematical models of turbulent flows, which were compared with realised practical measurements.
The „k-# Standard“ was chosen as the first model. Other used turbulent models were k-# RNG; ,k-# Realisable; k-$ Standard and k-$ SST. These are ordinarily used models for solution of engineering tasks [7].
A methane-air mixture from the program database was chosen as the ”Mixture Material” [1]. For evolution of chemical reaction we chose the ”Volumetric reactions”, where the following models were used for calculation of combustion kinetics:
• ”Eddy-Dissipation”,
Turbulent model, were total reaction speed is controlled by turbulent mixing and where Arrhenius relationship is not used.
• ”Finite-Rate/Eddy-Dissipation”,
Combined model, in which the speed of chemical reaction is determined both according to the Arrhenius relationship, and also according to the Eddy-Dissipation model. Local speed of reaction is given by the minimal value from those two approaches.
• ”Eddy-Dissipation Concept”.
Model comprising very detailed combustion kinetics, which contains kinetics of several step mechanisms. If the chemical reaction is too quick, it includes into calculation also constants of activation energy and a pre-exponential factor.
The best agreement was so far achieved with the turbulent model ”k-$ SST” and with the combustion model ”Eddy-Dissipation Concept”.
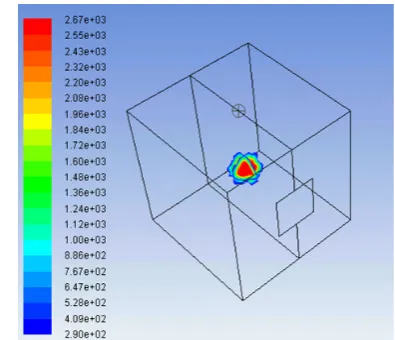
All boundary conditions were taken from the performed experimental measurements. Boundary conditions concerned particularly specification of the fixed obstacles (chamber walls, membrane and surface area) and of the space surrounding the blast chamber (pressure-outlet). After the initialisation the mass fractions of oxygen (O2= 0.22) and of methane (CH4 = 0.055) in the whole space of the blast chamber were defined using the "Patch" function, as well as initial temperature of 2673 K situated into a ball in the centre of the chamber, which simulated the temperature of the pyrotechnicalmatchused in the experiment (Figure 8).
A monitoring point “Surface monitor” was in the numerical model entered at the same place, where a pressure sensor was installed on the blast chamber.
After reaching the measured opening pressure of the membrane the membrane boundary condition was changed from the type "wall" to the type "interior" [9].
The whole mathematical model consisting of partial differential equations was solved numerically using finite volume method.
Figure 8 Initiation of explosive mixture (K)
4 Results
4.1 Comparison of experiment and model
The subject of investigation was so far only the overpressure part of the explosion (Figure 9).
Figure 9 Pressure evolution of venting explosion
Comparison of experimental measurements with mathematical simulation (Figure 10) was performed using pressure curves (dependence of pressure change over time).
Due to high demandingness only 3 measurements were made. Character of the curves is corresponding, but some differences are visible, which are caused mainly by the following reasons:
• missing synchronisation of reading of explosion pressure time with the explosive mixture initiation time,
• insufficient specification of orientation of pyrotechnical match after the explosion,
• separation of cover or pill of the match during ignition,
• influence of the methane concentration in the chamber due to limited accuracy of the measuring instrument.
Figure 10 Comparison of pressure curves
4.2 Temperature evolution during explosion
Temperature or flow velocities were not measured. This is a very fast physical-chemical process, which imposes high requirements on the measuring device. It was therefore possible to measure only the pressure on the blast chamber wall.
Evolution of temperatures was evaluated during the simulation. The temperatures were monitored at position of the pressure sensor and in the centre of the chamber, where the explosive mixture was initiated.
Figure 11 Temperature next to the pressure sensor
We can see at the pressure sensor an immediate increase in temperature, which is proportional to the increase in pressure (Figure 11). At the maximum explosion pressure the temperature reached 2500 K. When the pressure dropped, the temperature stabilised approximately at the value of 2100 K, which corresponded to the temperature of methane combustion.
At the point of mixture ignition we entered as a boundary condition the explosive temperature of gunpowder (2673 K), due to the impossibility of finding this value for the pyrotechnic composition. Instead of the expected temperature drop we can see a sharp increase exceeding the limit of 3500 K, which are unrealistic
values (Figure 12). High temperatures were reached at the beginning of the process, when the pressure just began to increase (at approx. p = 6 kPa). Before perforation of the membrane the temperature dropped and at the moment of rupture the temperature in the centre of the chamber was 3000 K (turning point of the curve at the time of approx. 0.03 s).
After the perforation the temperature at the point of initiation stabilised (T = 2 500 K) till the maximal explosion pressure was reached at the time 0.1 s. It then dropped to the temperature of methane combustion.
Figure 12 Temperature in the centre of the blast chamber
Initial high increase in temperature might have been caused by incorrect definition of initiation, which was so far treated as a constant value of the boundary condition and immediately after the start of calculation the maximum temperature of ignition was assumed.
The method of initiation will be further addressed by defining the boundary conditions, which will solve the dependence of the increase of initiation temperature over time. This requires more accurate investigation of ignition of the pyrotechnicalmatch.
4.3 Propagation of turbulent flame
Another area of research was propagation of a turbulent flame. This process is illustrated by temperature contours (Figures 13 and 14) and pressure contours (Figures 15 and 16).
Figure 13 Distribution of temperatures (interval from 286 to 2560 K; in time 0.1 s)
Temperature distribution is shown at the time, when the maximum explosion pressure was reached.
Figure 14 Distribution of temperatures (interval from 286 to 600 K; in time 0.1 s)
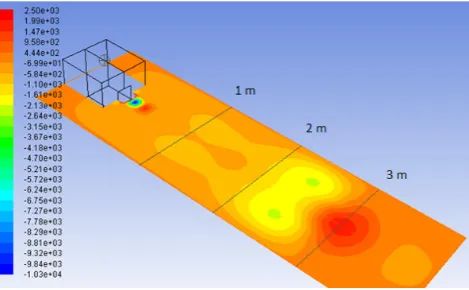
Figure 15 Distribution of static pressures (Pa; in time 0.1 s)
Figures 15 and 16 present distribution of pressure field in front of the opening at the moment of reaching maximum explosion pressure in the blast chamber. Suction wave immediately follows the front of pressure wave with overpressure within units of kPa. Slight pressure drop ahead of pressure wave is given by backward flow along the surface of terrain which causes sucking of air from this area. Marked pressure drop immediately behind the membrane is probably caused by change of flow velocity of post-explosion products through the chamber opening. Low velocity of flow in the chamber increases intensely around the opening as a result of small area of the opening.
Figure 16 Distribution of static pressures (Pa; in time 0.1 s)
5 Conclusions
The performed experimental measurements served for the initial setting of the boundary conditions for numerical calculation and for testing of the mathematical model describing the kinetics of methane combustion. We can see good agreement of the model with the experiment. Future investigation of this explosion process requires elimination of some uncertainties arising from the experimental equipment, as well as provision of the more detailed explosion parameters. It is also necessary to perform bigger number of measurements. Further tuning of the mathematical model will be performed in connection with the enhancement of the experiment. The biggest attention will be focused on the most precise definition of evolution of initiation of explosive mixture, which has probably the biggest influence on simulation of the explosion process by the numerical model.
Acknowledgements
This paper was financially supported by the project of grant competition for students under the Reg. No. 030/2101/SV0304431, entitled "Quantification, propagation and distribution of inflammable gas-air mixture at explosion ".
References
[1]Ansys, Inc. ANSYS FLUENT 14.5 - Theory Guide. (2013)
[2]&SN EN 14797: Explosion venting devices (in Czech), Praha, &NI (2007)
[3]&SN EN 14994: Gas explosion venting protective systems (in Czech), Praha, &NI (2007)
[4]M. Mynarz, P. Lepík, J. Serafín, Experimental determination of deflagration explosion characteristics of methane-air mixture and their verification by advanced numerical simulation, 12th conference SUSI, Kos, WIT Transactions on The Built Environment, Vol. 126, pp. 169-178, ISBN: 978-1-84564-612-7, ISSN: 1746-4498 (print). (2012) [5]M. Kozubková, J. Krutil, V. Nevrlý, Experiments and
mathematical models of methane flames and explosions in a complex geometry. COMBUSTION EXPLOSION AND SHOCK WAVES, vol. 50, No. 4, pp. 374-380. ISSN: 0010- 5082. (2014)
[6]M. Kozubková, M. Bojko, J. Krutil, T. Blejcha', Modelling the combustion of fuels. 1st edition. Ostrava: Edit centre VŠB – TUO, (2012)
[7]M. Kozubková, Modelling of fluid flow, FLUENT, CFX. 1. issue. Ostrava: Edit centre VŠB – TUO, (2008)
[8]J. Kalousek, Fundamentals of physical chemistry combustion, explosion and extinguishing. 2nd edition. Ostrava: SPBI, 203 pp. ISBN 80-861-1134-2. (1999) [9]H. Pedersen, G. Tomlin, P. Middha, H. Phylaktou, G.