SIMULATION STUDIES OF SURFACE AND
BULK PROPERTIES OF MATERIALS
SONIA OJO
A THESIS SUBMITTED FOR THE DEGREE OF
DOCTOR OF PHILOSOPHY
THE ROYAL INSTITUTION OF GREAT BRITAIN
ProQuest Number: 10015062
All rights reserved
INFORMATION TO ALL USERS
The quality of this reproduction is dependent upon the quality of the copy submitted.
In the unlikely event that the author did not send a complete manuscript
and there are missing pages, th ese will be noted. Also, if material had to be removed, a note will indicate the deletion.
uest.
ProQuest 10015062
Published by ProQuest LLC(2016). Copyright of the Dissertation is held by the Author.
All rights reserved.
This work is protected against unauthorized copying under Title 17, United States Code. Microform Edition © ProQuest LLC.
ProQuest LLC
789 East Eisenhower Parkway P.O. Box 1346
Abstract
This thesis addresses three related problems o f substantial interest in contemporary Chemistry: first, crystal growth inhibition; second, molecular diffusion in microporous materials and third, the interaction o f sucrose at the ice-water interface which is o f importance in the development o f commercial ice-cream.
The crystal growth studies have involved the utilisation o f robust modelling methodologies which included energy minimisation and molecular dynamics methods. The mode o f interaction o f a selection o f newly designed phosphonate crystal inhibitors was modelled in order to elucidate their mode o f interaction with respect to the stepped and planar { 1 0 Î4 } planes o f calcite. The phosphonates were chosen to elucidate the variation in their activity as a function o f structure. It has also been shown in this study that; a] poisons have a greater affinity for the defect containing surfaces compared to planar surfaces in accordance with experimental observations; b] the presence o f a hydrophobic functional group depletes poison efficacy; c] the presence o f electronegative atoms promotes the operation o f the poison; d] the diphosphonate HEDP is a superior poison to monophosphonate species. The mechanism o f action for these phosphonates is proposed.
Insights into long-range molecular diffusion have been investigated in the purely siliceous form o f Faujasite and CIT-I zeolites. Atomistic simulation studies involving the diffusion routes o f molecules and the calculation o f diffusion coefficients, obtained from the Einstein relation, have been undertaken for the rigid ion and shell model descriptions o f the zeolites using NVT, NVE and NPT simulation protocols. Inclusion o f oxygen polarizability via the shell model gives rise to decreased calculated diffusion coefficients as well as enhanced molecular contact with the zeolite channel walls, in contrast to the rigid ion model.
Contents
Abstract 2
List o f figures 7
List o f tables 10
Chapter 1
1. Introduction 12
1.0 Prologue 12
1.1 Surface phenomena:crystal growth inhibition 14
1.2 Bulk phenomena: molecular diffusion in zeolites 15 1.3 Interfacial phenomena: sucrose/ice-water interaction 16
Chapter 2
2. Theoretical techniques 17
2.0 Overview 17
2.1 Introduction 17
2.2 Interatomic potentials 18
2.3 Molecular force fields 19
2.3.1 Form o f the force field 20
2.3.1.1 Bond stretching term 21
2.3.1.2 Angle bending term 22
2.3.1.3 Torsional term 23
2.3.1.4 Inversion term 23
2.3.1.5 Van der Waals term 24
2.3.1.6 Electrostatic term 25
2.4 Interatomic potentials for ionic and semi-ionic solids 25
2.4.1 Introduction 25
2.4.2 The rigid ion model 26
2.4.3 The shell model 26
2.5 Charges 28
2.5.1 Phosphonate charges 28
2.5.2 Semi-Empirical methods 29
2.5.2.1 Mulliken population analysis technique 29 2.5.3 The Gasteiger and Marsili charge calculation method 30
2.6 Energy minimization 32
2.6.1 Introduction 32
2.6.2 The technique 32
2.6.3 The algorithms 33
2.6.3.1 Steepest descent 33
2.6.3.2 Conjugate gradient 34
2.6.3.3 Broyden-Fletcher-Goldfarb-Shanno 35
2.6.3.4 Summary 37
2.7 Molecular dynamics 38
2.7.1 Introduction 38
2.7.2 Methodology 39
2.7.3.1 Verlet Algorithm 41
2 .1 3 2 Leapfrog Algorithm 42
2.7.4 Equilibration 43
2.7.5 Ensembles 44
2.7.6 Calculation of diffusion coefficient 47
References 48
Chapter 3
3. Experimental Background 50
3.0 Overview 50
3.1 Mineral crystal growth 50
3.1.1 Introduction 50
3.1.2 Overview o f crystal growth 51
3.1.3 Mechanisms of calcite surface {1 0 1 4 } crystal growth 52
3.2 Crystal growth inhibition 55
3.2.1 Introduction 5 5
3.2.2 Background 55
3.2.3 Role of characterization techniques on Inhibition mechanism 58 3.2.4 Factors controlling crystal inhibition by anionic poisons 59 3.2.5 Role of pH, temperature and ionic strength on growth inhibition 62
3.2.6 Experimental methods 63
3.2.6.1 The constant composition technique 64
3.2.6.2 The free drift method 64
3.2.6.3 The Potentiostatic method 65
3.3 Diffusion in microporous zeolites 66
3.3.1 Introduction 66
3.4 Experimental techniques and self diffusion 70
3.4.1 Overview 71
3.4.2 Self diffusion and neutron scattering 71
3.4.3 Self diffusion and NMR methods 72
3.4.4 Chromatography 74
3.4.5 Zero length column method 75
3.4.6 Summary 76
3.5 Theoretical techniques and self diffusion 76
3.5.1 Molecular dynamics and self diffusion 76
3.5.2 Diffusion in microporous zeolites 77
References 82
Chapter 4
Crystal growth inhibition by phosphonates 91
4.0 Introduction 91
4.1 Phosphonate ions used in this study 92
4.2 Computational method 94
4.3 Interatomic potentials 97
4.3.1 Calcite 97
4.3.2 Modelling o f phosphonates 97
4.3.3 Charges 98
4.4 Inhibitor docking on planar and stepped {1014} surfaces 99
4.5 Simulation protocol for phosphonate docking 100
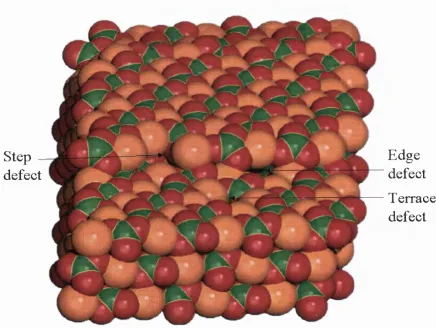
4.7 Solvation calculations 101 4.8 Replacement energy calculation at the planar calcite surface 102 4.9 Monophosphonate interactions at the ideal/stepped calcite {1014} 103 4.10 Incorporation of ions into terrace, steps and step edge defect sites 108
4.10.1 An overview 108
4.10.2 Results for the incorporation process 110 4.11 Binding o f calcium carbonate kink sites to steps containing ions 115
4.12 Discussion and Conclusion 117
4.12.1 Mechanism for prevention o f step flow and assembly 117 4.12.2 Phosphonate interaction modes as a function o f structure 118
4.12.3 Binding and replacement processes 119
4.12.4 Experimental correlation 120
4.13 Summary 123
References 124
Chapter 5
5. Diffusion in microporous zeolites: simulation studies 127
5.0 Overview 127
5.1 Introduction 127
5.2 Para-xylene/CIT-1 and ortho-xylene/CIT-1 systems 128
5.2.1 Background 128
5.2.2 GIT-1 zeolite model 128
5.3 Simulation methodology 131
5.3.1 Potentials 132
5.3.2 Trajectories 133
5.4 Diffusion of para-xylene within zeolite GIT-1 133 5.4.1 Function of isomer for 0.25 xylene molecules/unit cell systems 133 5.4.2 Function of loading for GIT-1/para xylene systems 135 5.4.3 Self-diffusion as a function of simulation time 136 5.4.4 Diffusion of ortho-xylene within GIT-1 : rigid ion model 141 5.5 Diffusion of xylene isomers isomers within zeolite GIT-1: shell model 143
5.5.1 Function of isomer and potential type 143 5.5.2 Function of simulation time: shell model 144 5.6 Effect o f shell model on xylene/GIT-1 system 148
5.7 Summary 149
5.7.1 Extended simulation times o f 0.4ns 149
5.7.2 Inclusion of the shell model 150
5.8 Benzene/Faujasite systems 150
5.8.1 Introduction 150
5.8.2 Siliceous Faujasite: structural information 150
5.9 Benzene/Faujasite: simulation methodology 151
5.10 Benzene/Faujasite: rigid ion model 152
5.10.1 Effect of simulation length 152
5.10.2 Effect o f ensemble 153
5.11 Benzene/Faujasite: shell model 156
5.11.1 Effect of simulation time 156
5.11.2 Effect of ensemble 157
5.12 Discussion 159
5.12.1 Overview 159
5.12.2 Diffusion : simulation/experimental studies [xylene/GIT-1] 160 5.12.3 Diffusion : simulation/experimental studies [benzene/Faujasite] 161
Chapter 6
6. Conclusion 164
6.0 Epilogue 164
6.1 Surface properties:phosphonate scale inhibitors on calcite { 1 0 Ï 4 } scale
prevention 164
6.2 Bulk Properties: self diffusion of templates within microporous zeolites 165
6.3 Further work 166
Appendix A
A. Sucrose and ice/water interface interactions A.O Overview
A. 1 Introduction A.2 Ice
A.2.1 Generation o f the ice-crystal interface A.2.2 The (001) plane
A.2.3 The (201) plane A.2.4 Water
A.3 Reproduction o f the SPC/E model A.3.1 Rationale
A.4 Generation of the ice-water interface:simulation method A.4.1 Methodology
A.5 Sucrose
A. 5.1 Background
A.5.2 Conformational searching A.5.2.1 Grid scan
A.5.2.2 Random sampling A.5.2.3 Boltzmann jump A. 6 Characterization
A.6.1 Radial distribution functions A.6.2 Oxygen density profile A. 7 Results and observations
A.7.1 Calculation of interaction energy A.7.1.1 Normalization o f energies A.7.1,2 Bulk SPC/E water simulation A.7.1.3 Bulk water/sucrose simulation A.7.1.4 Ice/water interface simulation
A.7.1.5 Ice/water interface/sucrose simulation A. 8 Discussion
A.8.1 Water/sucrose simulation A.8.2 Interface/sucrose simulation A. 9 Summary and further work
References 167 167 168 168 170 171 171 173 174 175 176 176 178 178 180 181 182 183 188 188 194 197 199 199 200 200 201 201 202 202 202 203 204
Appendix B
Appendix C
Comparison o f semi-empirical methods Oxygen density profile program
List of figures
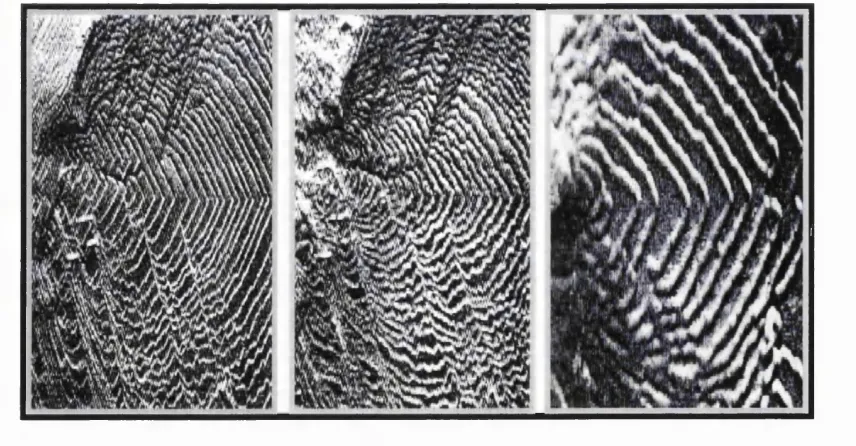
Figure 3.1. This schematic details the dynamic nature of a growing crystal surface. 51
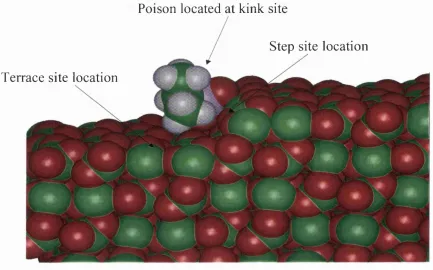
Figure 3.2. Schematic o f the terrace and step sites at a calcite { 1 0 1 4 } surface with inhibitor ion interacting at a nucléation site. 57
Figure 3.3. The evolution o f poison traits on a growing calcite { 1 0 1 4 } surface. 58
Figure 3.4. From top: (A) zeolite zinc silicalite [ZSM-48], (A l) unit cell o f zinc silicalite; from bottom: (B) zeolite ABW, (B l) zeolite ABW unit cell and middle diagram: (C) zeolite siliceous Faujasite. 68
Figure 3.5. Snapshot of a para-xylene molecule diffusing within a CIT-1 12MR channel [viewed along the [010] projection]. 69
Figure 4.1. Schematic o f the MARVIN simulation model. Region I atoms are allowed to relax whereas those in region II are kept fixed. 94
Figure 4.2. The MARVIN simulation cell used to dock the phosphonate poisons onto a calcite surface. 96
Figure 4.3. Calcite { 1 0 1 4 } plane showing location o f [21 ] obtuse and [21] acute steps. 99 Figure. 4.4. Conformations of a)HEDP ion [top diagram] and b)DHMP ion [bottom diagram] at the planar calcite surface after simulation. 105
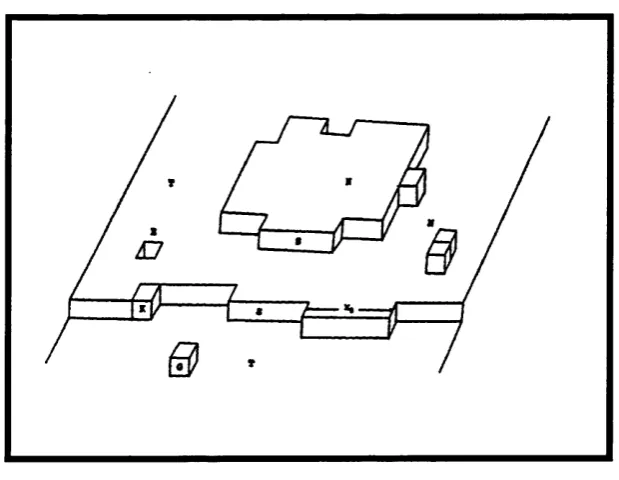
Figure 4.5. Schematic showing sites o f the three surface defects. 109
Figure. 4.6. Snapshots of a)PMP, b)PEMP, c)DHMP, d)HEDP and e)HEMP ions interacting at lower step ‘edge’, step and terrace defects, after 5ps o f constant temperature dynamics performed at 298K using MARVIN. 115
Figure 5.1. Snapshot of CIT-1 macrocell showing lOMR channels parallel to [010] crystallographic axis. 129
Figure 5.2. Zeolite CIT-1: 12MR channels parallel to [010] crystallographic axis. 130
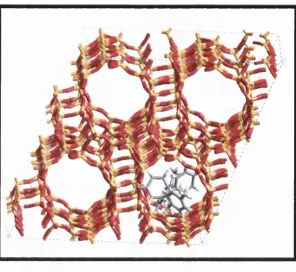
Figure 5.3. Snapshot of CIT-1 macrocell: 12MR channels parallel to [001] crystallographic axis. 130
Graph 5.1. MSD versus simulation time for lOOps NVT ensemble performed at 45OK for CIT-1/para isomer [black line] and MSD versus simulation time for lOOps NVT ensemble performed at 45OK for CIT-l/ortho isomer [white line]. 134
Figure 5.4. Outlines the area of the framework in which molecules are confined temporarily in transit to lOMR or 12MR channels. 137
Graph 5.3. Mean squared diffusion profile for the CIT-1/para xylene NVT ensemble system performed at 500K. 138
Graph 5.4. MSD versus simulation time plot for approximately 360ps NVE CIT-1/para system performed at 45OK demonstrating distinct diffusion processes. 139
Figure 5.5. Snapshot of overlaid para-xylene molecules within the lOMR channel showing molecule location during the course of an NVE simulation performed at 550K for 360ps. 140 Figure 5.6. Snapshot of overlaid para-xylene molecules within the 12MR channel viewed along the [010] projection showing molecule location during the course o f an NVE simulation performed at 45OK for 360ps. 140
Figure 5.7. Snapshot of overlaid para-xylene molecules within the 12MR channel viewed along the [001] projection showing molecule location during the course o f an NVE simulation performed at 45OK for 360ps. 141
Graph 5.5. Mean squared diffusion profile for the NVE CIT-1 /ortho-xylene system performed at450K. 142
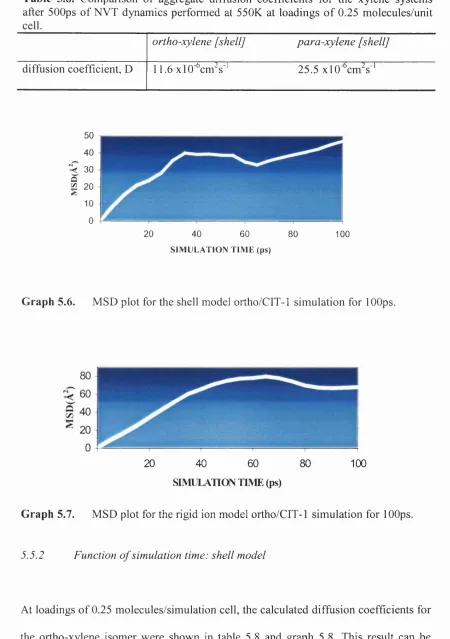
Graph 5.6. MSD plot for the shell model ortho/CIT-1 simulation for lOOps. 144 Graph 5.7. MSD plot for the rigid ion model ortho/CIT-1 simulation for lOOps. 144 Graph 5.8. MSD plot for the shell model ortho-xylene/CIT-1 500ps NVT
simulation. 145
Graph 5.9. MSD plot for the shell model para-xylene/CIT-1 500ps NVT simulation. 146 Plots 5.1-5.3 Trajectory plots of history files showing the evolution o f the molecule paths with simulation time for the x, y and z co-ordinates for the CITl/ortho and CIT 1/para systems using the shell model. 147
Figure 5.8. The disparate locations and diffusivities o f the para-xylene molecule can be distinguished by inspection of the regimes, labelled G, operating during the extended NVT simulation. 149
Figure 5.9. Snapshot of purely siliceous Faujasite showing the 12MR window labelled: A and 6 and 4 ring cages labelled: B and C respectively. 151
Graph 5.10. MSD plot for the benzene/Faujasite system generated at 300K using the NVT ensemble. 153
Graph 5.11. MSD plot of NVE ensemble for benzene/Faujasite system performed at 300K. 154
Graph 5.12. MSD plot o f NPT ensemble for benzene/Faujasite system performed at 300K. 154
Figure 5.11. Shell model simulation for Faujasite/benzene system after NVE dynamics showing superimposed benzene ring snapshots taken along the duration o f the simulation. 158 Graph 5.13. MSD plot o f NVE shell model simulation performed at 300K, increased benzene ring rotations occur after 375ps. 158
Plot 5.7 Faujasite/benzene history plot during NVE dynamics at 300K showing variation of x co-ordinates with simulation times for shell model versus rigid ion model for lOOps and 500ps runs. 159
Figure A.I. The phase diagram o f water [3]. Solid lines indicate a stable phase, hatched lines indicate a metastable phase and dotted lines represent estimated boundries. 169
Figure A.2. [top] Sketch of the hexagonal unit of the ice crystal structure.* The shaded area is the c-face; the hatched area is the prisms face. 172
Figure A.3 [bottom] schematic represents the internal (201) plane in the hexagonal unit cell of ice Ih. 172
Figure A.4. The simulated ice/water interface. 177 Figures A.5.-A.7. Conformations of sucrose.
Figure A.8. Snapshots o f the lowest energy conformers of sucrose using top.ihQ grid search/Dreiding force field model; bottom: the grid search/Universal force field model. 185 Figure A. 9. Snapshots o f the lowest energy conformers o f sucrose using /opithe random search/Universal force field model; bottom: the random search Dreiding force field model.
186
Figure A. 10. Snapshots o f the lowest energy conformers o f sucrose using /o/?:the Boltzmann Jump/Dreiding force field model; bottom: the Boltzmann Jump/Universal force field model.
187
Figure A .ll. Radial distribution function of hydrogen-hydrogen distances for SPC/E water at 300K. 191
Figure A. 12. Radial distribution fimction of oxygen-hydrogen distances for SPC/E water at 300K. 192
Figure A. 13. Radial distribution function of oxygen-oxygen distances for SPC/E water at 300K. 193
Figure A. 14. Oxygen density profile of the ice-water interface after 60ps o f NVE dynamics. 196
List of tables
Table 3.1 The phosphonate ions modelled during this work. 60
Table 4.1. Calculated solvation energies of anionic phosphonate ions. 102
Table 4.2. Calculated replacement energies used to establish most feasible CO3-CO3 distances occurring within the planar {1014} surface. 102
Table 4.3. Calculated binding energies for the phosphonate ions at the planar {1014} surface after 20ps NVT dynamics performed at 298K 104
Table 4.4. Calculated binding energies for the phosphonate ions at the stepped, obtuse calcite plane after 20ps NVT dynamics performed at 298K.106
Table 4.5. Calculated replacement energies/ kJmol ' at the {1 0 1 4 } calcite obtuse step. 110 Table 4.6. Calculated binding energies o f CaC0 3 units bound to kink sites containing phosphonate ions at the stepped} 1014} surface. 116
Table 5.1. Diffusion coefficients of ortho versus para isomers o f xylenes for DL POLY runs o f loops performed at 45OK, NVT dynamics. 134
Table 5.2. Calculated diffusion coefficients for one and two molecular CIT-1/para xylene systems; NVT simulations were performed at 400K. 135
Table 5.3. Comparison table for D values calculated for higher loadings of 0.25 para-molecules/unit cell in the Sastre et al study and the lower loading o f 0.125 para-molecules/unit cell for NVE simulations performed at 500K. 136
Table 5.4. Diffusion coefficients of para-xylene in the lOMR, 12MR and intra-connecting region o f CIT-1 for 300ps o f NVT dynamics performed at 500K for 0.125 loading. 137 Table 5.5. Diffusion coefficients of para-xylene in the lOMR, 12MR and intra-connecting region o f CIT-1 for up to 360ps of NVE dynamics performed at 500K. 139
Table 5.6. Comparison of aggregate diffusion coefficients for the two xylene isomers after 500ps of NVT dynamics. 141
Table 5.8. Comparison o f aggregate diffusion coefficients for the xylene systems after SOOps o f NVT dynamics performed at 550K at loadings o f 0.25 molecules/unit cell. 144
Table 5.9. Comparison of the diffusion coefficients for the Faujasite/benzene systems after loops of NVT dynamics performed at 300K. 153
Table 5.10. Comparison of the diffusion coefficients for the benzene/Faujasite systems after lOOps of NVT dynamics and NVE dynamics performed at 300K. 155
Table 5.11. Comparison of the diffusion coefficients for the benzene/Faujasite systems at different simulation times using o f NVT dynamics. 157
Table 5.12. A comparison o f diffusion coefficients determined theoretically and experimentally for the xylene/CIT-1 system. 161
Table 5.13. A comparison o f diffusion coefficients determined theoretically and experimentally for the benzene/Faujasite system. 161
Table A.I. Potential parameters for water models. 173 Table A.2. Preliminary results from SPC/E model. 175
Table A.3. Comparison Table for the lowest energy sucrose conformations obtained by the three search methods. 180
Table A.4. Data obtained from the bulk SPC/E water simulation. 200
Chapter 1
Introduction
1.0 Prologue
The work described in this thesis addresses surface, interfacial and bulk properties o f solids using computer simulation techniques.
A dramatic growth has occurred in the area o f molecular m odelling within the past fifteen years, making it both a valuable i f not indispensable tool to the scientific community. This growth has been driven by developments in techniques and algorithms and by faster computer processors making the m odelling o f thousands o f atoms achievable. The bulk and surface single processor simulations described in Chapters 4 and 5 o f this thesis, utilized Tyndall situated at the Royal Institution. Tyndall, comprises a 14 processor Silicon Graphics Origin 2000 machine with each processor containing a MIPS R 12000 300Mhz chip. Such a facility greatly exceeds in cpu powered memory the national supercomputers o f the 1980s.
The systems on which w e focus in this thesis each necessitated the m odelling o f thousands o f atoms. Consequently, ‘force-field’ or interatomic potential techniques were necessary for these calculations to be viable. The thesis exploits the capability o f m odem molecular modelling techniques to examine systems o f great complexity.
Regarding our first theme, crystal growth inhibition, few m odelling studies o f the processes involved in the inhibition o f mineral growth have been documented within the past twenty years. There is, therefore, huge scope for designing efficient poisons and characterizing further stmcture/activity relationships for many o f the systems o f importance to the water and petroleum industries.
Our second theme o f diffusion within zeolites has been studied extensively within the past thirty years due to increased numbers o f synthesized zeolites and the development o f a variety o f catalytic processes and adsorption/separation processes. Theoretical studies have been particularly useful in the elucidation o f zeolite/hydocarbon mechanisms which are operational within shape selective catalysis.
The fact that the taste o f commercially engineered ice-creams is impaired after re refrigeration offers another example o f how simulations have been applied to commercially important problems. In the third theme, our aim was to build an ice/water interface and determine feasible sucrose conformations at the interface.
1.1 Surface phenom ena: crystal growth inhibition
This component o f the thesis has the central aim o f elucidating a mechanism o f action for a variety o f the phosphonate class o f crystal poison, ultimately resulting in the
crystal growth inhibition o f the { 1 0 1 4 } surface o f calcite. These calculations were performed by using the classic simulation methodologies o f energy minimization and molecular dynamics. Specifically, the following systems and features o f additive/calcite systems were modelled:
■ Totally deprotonated poisons o f the phosphonate class o f poison. ■ Variation o f the functionality o f the additive backbone.
■ The roles o f terrace, step and kink nucléation sites in the growth o f calcite.
■ The roles o f terrace, step and kink nucléation sites in the inhibition o f calcite growth.
■ The relationship between additive selectivity and functionality.
■ The differences in additive interaction between acute and obtuse steps on the
{ 1 0 1 4 } calcite surface.
■ The mechanisms o f replacement and binding processes.
■ The differences in interaction between diphosphonates and monophosphonates.
suggested that diphosphonate class o f poison was able to associate with the calcite stepped surface via binding rather than double carbonate ion replacement; the diphosphonate ion enabled higher calculated binding energies compared to the singly substituted monophosphonate counterparts.
1,2 B ulk phenomena: molecular diffusion in zeolites
As noted, sorbate diffusion in microporous materials is a crucial process controlling their operation in catalysis and molecular sieves.
In this thesis, diffusion studies in purely siliceous zeolites have been investigated using rigid ion and shell model descriptions. The zeolite frameworks studied were the Faujasite and siliceous CIT-1. Systems under observation included CIT-1/para-xylene, CIT-1/ortho-xylene and Faujasite/benzene. The topics and problems investigated included:
■ The application and effect o f the inclusion o f polarizability on the magnitude o f the diffusion coefficient.
■ The application o f the rigid ion model to zeolite/m olecule systems and the calculation o f corresponding diffusional properties.
■ The effect o f simulation temperature on the magnitude o f the diffusion coefficient. ■ The effect o f molecular loading on the magnitude o f the diffusion coefficient. ■ The investigation o f the role o f ensemble choice on the magnitude o f the diffusion
coefficient.
The elucidation o f any differences apparent in the effect o f inclusion o f the polarizability via the shell model for Faujasite compared to the lower density CIT-1 framework.
1,3 Interfacial phenom ena
Chapter 2
Theoretical techniques
2.0 Overview
The molecular modelling methods used throughout this work employed force-fields which allow the simulation o f large complex systems containing several thousand atoms. The applications reported refer to bulk or surface simulations using periodic boundary conditions. Such methods do not model electronic effects explicitly, hence features such as bond-breaking and bond-formation are not described. The origins o f these force-field’ based procedures are discussed in detail in this chapter.
2.1 Introduction
Quantum mechanics is the most fundamental approach for the theoretical determination o f molecular properties. It relates molecular properties to the behaviour o f electrons in atoms and molecules. The solution o f the Schrodinger equation allows the calculation o f electronic, structural and spectroscopic properties and can be used to predict chemical behaviour including reactivity.
2.2 In teratom ic p o ten tials
The potential energy surface, described in equation 2.1 below , is a mathematical representation o f the potential energy, V(R), o f a m olecule as a function o f nuclear co ordinates or structural parameters such as bond lengths, bond angles and torsion angles, (r vn)'.
y { R ) = A r r „ \ (2.1)
V(R), is usually represented by analytical functions that are parametized via ab-initio calculations or from experimental results.
At the heart o f the concept is, o f course, the Bom-Oppenheimer approximation. This is based on the assumption that electrons respond instantaneously to changes in nuclear co-ordinates. Therefore, the motion o f the electrons and the nuclei can be resolved into two equations. Equation 2.2 describes the electronic motion, ^ i s the Hamiltonian operator, ^//can be described as a function o f the co-ordinates o f the
nuclei (r) and o f the electrons (r) :
Hy/{r: R ) = Ey/{r; R ), (2.2)
Equation 2.3 represents the motion o f the nuclei, which is defined by the
Ham iltonian//(([)), and the energy
The next approximation made in “classical” simulations is that the motion o f the nuclei on the potential energy surface follows classical dynamics. Hence the classical equation for the movement o f nuclei is described in equation 2.4 where V is the potentail energy, m is the mass and R the position o f the nuclei and t the time.
d V d^R = m —
dR = mdt , (2.4)
Methods based on interatomic potentials normally use an analytical and differentiable potential energy function. For molecular systems, the potentials are often referred to as the force field.
2 3 M olecular fo rce fields
The concept o f a force field, originally emerged from analysis o f vibrational spectra. However, these early force fields did not originally include interactions between non bonded atoms and were not parameterized with structure and energy calculations in mind. M odem force-fields include van der Waals and other non-bonded interactions.
Generally, a molecular force field includes terms, which describe:
(i) the energy o f stretching each bond from the equilibrium value (2 body term); (ii) the energy o f bending bonds from their standard values (3 body term);
(iii) the energy required to twist the m olecule about a bond i.e. a change in torsion angle (4 body term);
(iv) the cross terms o f the above.
(v) the non-bond interactions between atoms.
2.3.1 Form o f the fo rc e fie ld
A s noted, the form o f the force field can be described in terms o f bonded, non-bonded and cross term interactions.
The bonding interactions usually refer to atoms in the following relationships:
■ Those which are directly bonded to each other, i.e. a 1-2 bond stretch: a two body
term, .
■ Those in which atoms are hound to a common atom, i.e. 1-3 angle bending: a
three body term, .
■ Those in which atoms are separated by 3 bonds, i.e. a 1-4 dihedral angle rotation:
a four body term, .
The non-bonded interactions usually include the follow ing terms:
■ Electrostatic interactions resulting from the interactions o f charges.
The repulsive and attractive terms combine in what are referred to as van der waals terms.
Thus the valence or bonded terms, E^ai, comprise E ^ , see equation 2.5:
The non-bonded interactions, Enb, comprises the van der Waals, Evdw and electrostatic Eel terms which are shown in equation 2.6:
^nb = (2.6)
The total potential energy, V, is the sum o f the two terms: see equations 2.5 and 2.6:
F = + E ^ J , (2.7)
Each o f the analytical functions w ill now be discussed.
2.3.1.1 Bond stretching term
force constant describing the stiffiiess o f the bond, is the equilibrium bond length
and r is the deformed bond length:
(2-8)
bonds
The Morse function, shown in equation 2.9, is used for long bond lengths and greater deviations from equilibrium bond lengths as the harmonic term becom es inappropriate under these conditions .The Morse function contains an exponential component which rises more steeply than the Harmonic potential at short bond lengths. This feature can be important during simulations in which a m olecule is directed away from a potential minimum.
(2.9)
where D is the bond dissociation energy, r^ is the equilibrium bond length(Â^, r^ is
the deformed bond length and A is the force constant parameter.
2.3.1.2 Angle bending term
The term defined by equation 2.10 is normally taken to be harmonic and represents deviations from equilibrium bond angles:
(2 1 0 )
where is the bond bending force constant andG^ is the equilibrium bond angle.
2 3 .1 .3 Torsion term
The torsional term, equation 2.11, is described with a small cosine Fourier expansion in ([)
= Z + JC0i(p(|))), (2.11)
where is represented by h alf the barrier height, p is the periodicity and 5, the sign,
is used to determine whether the maximum o f the term occurs at 0° or <|> is
the torsional angle.
2.3.1.4 Inversion term
The term shown in equation 2.12 represents the out o f plane interactions present in m olecules such as carbonate ions. The potential involves the estimation o f the angle between a bond from the central atom and the plane defined by the central atom and two atoms. When all four atoms assume a coplanar geometry, the energy value is
2.3.1.5 Van der Waals term
The Lennard Jones 12-6 potential (equation 2.13), has been used in many molecular mechanics calculations,
= E
vv y y
VV y j j,(2.13)
where ry is the non bonded distance between two atoms i and j . A and C are van der Waals parameters for the interacting pair o f atoms. Dispersive interactions arise from the correlation between the motions o f electrons on different atomic or molecular
sites. The correlations result in instantaneous dipoles arising on each species. The r2^
term describes the latter interactions while the term describes the repulsive
interactions between the overlapping atomic charge clouds.
Often, the repulsive part o f the 12-6 term is too steep or hard to describe interactions between atoms in organic molecules. The Buckingham term, in equation 2.14, may act as a more accurate alternative to the Lennard-Jones potential since it contains a more realistic exponential component which describes the short range repulsion.
' Buckingham
= z
Ay exp- r..
>1
f ^ \y - y
6 p..
V *^y ^ y J
(2.14)
2.3.1.6 E lectrostatic term
The electrostatic interactions are calculated using point charges; qt and qj, (the assignment o f which are discussed in section 2.5 o f Chapter 2) separated by the distance ry o f atoms i and j. The analytical expression for this term is shown in equation 2.15 below.
electrostatic (2.15)
In systems where solvents are present this interaction may be screened using an effective dielectric constant e .
2.4 Interatomic potentials f o r ionic and semi-ionic solids 2.4.1 Introduction
2.4.2 The rigid ion m odel
Rigid ion models are the simplest class o f ionic model. This m odel does not take into account ionic polarizability within the system, a limitation o f which precludes accurate modelling o f the dielectric and dynamical properties o f lattices.
The basic form for the potential describing the interaction o f a pair o f ions is shown below in equation 2.16, which is the sum o f Coulombic and Buckingham functions discussed earlier:
=
r.. + A. .exp
/ \
r. c
IJ
___
6
p. r.
y y
(2.16)
2.4.3 The shell m odel
The shell model, developed originally by D ick and Overhauser,^ was used in this work to model the polarisation o f oxygen. The model is a simple mechanical model o f a polarizable atom or ion which comprises a core (containing all the mass) and a massless shell which describes the polarizable valence shell electrons. The core and shell are connected by an harmonic spring. The short-range interactions are then defined between the shells, on the assumption that short-range repulsion is caused by interactions between valence shell electrons. The sum o f the charges on the shell and core give rise to the total ionic charge. Polarization is modelled by the displacement o f the shells from the cores, the self-energy o f which is given by the term,
distance. Accounting for the effect o f polarization significantly improves the accuracy o f the simulation as shown by the results presented later in Chapter 5 o f this thesis.
Early applications o f the shell model were in the lattice dynamics studies performed by Jaccucci et a l } and D ixon and Sangster^ in the mid-seventies. It should be noted that whilst the rigid ion technique was sufficient to reproduce static properties o f systems such as pair correlation functions, shell model methods were proven to reproduce the dynamical properties o f systems more accurately.*®
Problems in the original implementation o f shell model molecular dynamics included the high computational expense o f the calculations* * caused by the fact that it was necessary to equilibrate the shell position for all nuclear co-ordinates consistent with the zero mass o f the shells.*^ This was achieved by systematically relaxing all the shells at each molecular dynamics time step via the conjugate gradient technique (explained later in this chapter). Inherent problems within this latter technique included lack o f energy conservation, which was rectified by the inclusion o f a procedure for the prevention o f energy drift in 1993 by Lindan and Gillan.*^
The shell model p o t e n t ia lu s e d during this work comprised electrostatic, repulsive and three body terms. The form o f the force field for the shell model is described in equation (2.17) below:
f r . ^ r .
,(2 .1 7 ) 9,9; + Ay exp
“ “ f +
Z
“e.y
+Z
_ r.J a n g le s s h e lls
where i and j represent the interacting ions, qt and qj are their respective charges and
A.J, p_ and c.j are short-range potential parameters, and are the force
constants.
Having outlined the methods used in treating polarizability, w e now consider the key question o f the assignment o f charges in both molecular and ionic potentials.
2,5 Charges
2.5.1 Phosphonate charges
2.5.2 Semi-empirical methods
Semi-empirical methods have been very w idely used in computational Chemistry. They differ in the various approximations which they make. The N eglect o f Differential Overlap (NDO) methods, i.e. MNDO, PM3 and A M I replace key integrals in the Hamiltonian by parameterized terms. The terms partially compensate for considering only valence electrons. They may also incorporate, again partially, the effects o f electron correlation. In the present study the aim was sim ply to obtain charges using the Mulliken population analysis technique.
2.5.2.1 Mulliken population analysis technique
This w idely used technique attempts to assign charges between different atoms in m olecules using a standard prescription based on the coefficients o f the atomic basis functions in the LG AO molecular orbital’^. There are, however, many limitations o f the method, including the fact that the charge between two nuclei is divided equally irrespective o f electronegativity. The representation o f charge distribution is more realistic when derived from a minimal basis set computation compared to an extended basis set.
2.5.3 The G asteiger and M arsili charge calculation method^ ^
M ulliken’s definition o f electronegativity^® relates the ionization potential to the electron affinity, which is also a characteristic o f a particular valence state. This idea was expanded by Hinze et al.^^ by introducing the concept o f orbital electronegativity which is defined as the electronegativity o f a particular orbital in a particular valence state. Orbital electronegativities depend not only on hybridization but also on the occupation o f an orbital. An empty orbital has a greater ability to attract electrons than an occupied orbital. Using the terminology o f Gasteiger and Marsili, the difference between the orbital charge density o f an atom with partial orbital occupancy and that o f the corresponding atom in a molecule is defined as a partial charge, qjy in the orbital v o f atom Aj. Orbital electronegativity therefore depends not only upon the charge in one orbital but also the charge o f neighbouring orbitals.
The driving force for the charge transfer between two bonded atoms is the difference in electronegativity. However, charge transfer leads to the generation o f an electrostatic field which impedes further transfer. A simple damping procedure is therefore invoked by implementing the iterative formula below in equation 2.18:
X
I
C2 18)
where q is the charge transferred on atom Aj in each iteration step, X ^ is the orbital
new electronegativities are calculated and a damping factor o f % is applied. The total charge is calculated as the sum o f the individual charge transfers, see equation 2.19:
= (2.19)
2.6 Minim ization
2.6.1 Introduction
Having outlined the main features o f the interatomic potentials employed in the study w e now consider the main simulation techniques used in the thesis.
Energy minimizations or geometry optimizations^^ aim to generate the structural configurations which correspond to the minimum energy o f the system. Minimization techniques have been extensively used in this thesis employing the GULP^^ and MARVIN^"* codes. The former, models 3D periodic systems and the latter 2D periodic systems.
2.6.2 The technique
A s stated previously, performing an energy optimization on a m olecule is always a useful starting point for subsequent simulations. The aim is normally, i f possible, to locate the global energy minimum. However, local minima are a pervasive problem. For example, each o f the torsional terms in the energy expression has more than one minimum; therefore, since the torsions are the variables which define the conformation o f the m olecule, there are many conformations with local energy minima for large molecules. It follows then that no minimization algorithm can really guarantee that the lowest energy conformation that it finds is the global minimum which is known as the local minimum problem.^^ Sophisticated procedures including simulated annealing and genetic algorithms may partially overcome the problem, but the location o f the global minimum can never be guaranteed.
2 .6 3 The algorithms
The minimization algorithms described are:
■ Steepest descent technique^^ ■ Conjugate gradient technique^^ ■ BFGS technique^^
2.6.3.1 The steepest descent algorithm
g = - V E = (2.20) a ï, d y j dz„
The steepest descent method may provide a reasonably good procedure to begin an optimization when the starting point is far from the minimum. However, it converges slow ly near the minimum and it is principally recommended only to initiate optimization from a poor starting point.
A major limitation o f steepest descent, is that the successive directions o f search, g,,
gj+i etc. are not conjugate directions. Searching along the successive directions o f steepest descent might, for example, keep going back and forth across a long, narrow valley. Conjugate gradient methods are a considerable improvement over steepest descent methods and involve searching down conjugate directions rather than steepest descent directions.
2 .6 3 .2 The conjugate gradient algorithm
This algorithm was developed by Fletcher et al.,^'^ in 1969. In the steepest descent method, the first derivative is recomputed each time, but the w ay in which these derivatives are changing is not taken into consideration. The core o f the conjugate methods is to use knowledge o f derivatives in previous iterations.
The steps in a gradient minimization are:
(a) A starting point is defined and the initial conjugate direction is chosen to be the steepest descent direction, ho = go.
(b) Along the conjugate direction, hi, a line minimization is carried out until a minimization is found that defines the next point, where the gradient is re evaluated as gi+i.
K , =
where the coefficient \ given in equation 2.21, is calculated from the new and the
old gradients and g,.
^i+I i+1
Si Si
(2 .2 1 )
The procedure is terminated when the convergence threshold is reached.
2 ,6 3 .3 The Broyden-Fletcher-Goldfarb-Shanno (BFGS) Algorithm
At each iteration k, the new positions Xk+i shown in equation 2.22, are obtained from the current positions x\^ the gradient gk and the current approximation to the inverse Hessian matrix Hk
Xk+i = Xk - Hkgk,
(2.22)
H w ill be updated at new positions Xk+i from its value at the previous step according the BFGS formula. This method converges to a minimum, for a quadratic function o f M variables, in M steps.
The BFGS update formula is described below in equation 2.23:
~ S i:)' W&+/ ~ ^ k ) ,
- {s m
+ (2 2 3 )
where:
u =
k . •
- gJ]
_kw -
• k ./ - gJ.
_kw -
S t )The matrix, H, is often initialized to the unit matrix I, although the performance o f the quasi-Newtonian algorithms can be improved by using a better initial estimate o f the inverse Hessian.
2.6.3.4 Summary
2.7 M olecular dynamics
2 .7.1 Introduction
Molecular dynamics includes the kinetic energy explicitly into simulations by modelling the motion o f an ensemble o f atoms, ions, or m olecules over the potential energy surface. The motion o f the m olecules over this surface is treated classically, i.e. as governed by N ew ton’s Second Law o f Motion. After an initial set o f conditions velocities and co-ordinates are defined. N ew ton’s Second Law is solved in a numerical, iterative fashion using a specified “time-step” to yield the time evolution o f the system.
The first applications o f molecular dynamics t e c h n iq u e s ,p io n e e r e d by Alder and Wainwright in 1959, were made to simple fluids. Rahman and Stillinger^% followed later with their simulations for liquids such as water, with one o f the first molecular dynamics simulations o f a bio-m olecule performed by McCammon et al?^ Since then, the method has been applied to an enormous variety o f systems^^ ranging from proteins to zeolites.
are used and the temperature is high enough to enable all the barriers to rotation to be overcome, then, in principle all potential energy minima could be identified.
The real power o f the method is, however, exploited when approaching dynamical phenomena such as diffusion described later in the thesis.
2.7.2 M ethodology
Molecular dynamics simulations calculate the future positions and velocities o f atoms based on their current values. A simulation, first determines the force, Fj, in equation 2.24 below:
F. = - s v y , , ’'2’
W
'•J
.
(2.24)
acting on each atom as a function o f time, which is equal to the gradient o f the potential energy, as in equation (2.24), where V is the potential energy and n is the position o f atom i.
The acceleration, aj, o f each atom is determined by dividing the force acting on it by the mass o f the atom: consider equation (2.25)
a, = ^ , (2.25)
m.
The change in velocities, Vj, is equal to the integral o f acceleration over time. The change in position, rj, is equal to the integral o f velocity over time. The kinetic energy, (T), is defined in terms o f the velocities o f the atoms (equation 2.26).
T = <2.26)
2 i=]
The total energy o f the system is described by the Hamiltonian, which is the sum o f the potential and kinetic energies; see equation 2.27
H{r, p ) = T (p ) + V {r), (2.27)
where H is the Hamiltonian operator, r is the set o f cartesian co-ordinates, p is the momenta o f the atoms, T is the kinetic energy and V is the potential energy.
2.7.3 M olecular dynamics algorithms
2.7.3.1 The Verlet algorithm^^
A variety o f algorithms exist to integrate the equations o f motion, including the Verlet algorithm and the leapfrog algorithm.
The Verlet algorithm uses the positions and accelerations at time t and positions, r
from the previous step r{t - S t ) to calculate the position at time (t + St) to give
r(t + St), where St is the time step (equations 2.28 and 2.29).
At time t, forward step
'{t + Ô/) — r{t) + b tv {t)+ —{st^ a { t^ + .. (2.28)
reverse step
adding the two previous expressions gives:
=> r{t + St) = 2 r(t) - r(t - S t) + St^a(t)
Velocities do not appear in the Verlet integration algorithm. The velocities are
calculated by the division o f the difference in positions at times r(t + St) and r(t - St)
(2.30)
2.7.2.2 The leapfrog algorithm
A simple modification o f the Verlet algorithm is the leapfrog algorithm. The positions
in equation (2.31) at time are deduced from the velocities at time St).
The velocities in equation (2.32) are calculated at tim e^ velocities at
{ t - St) and acceleration at time t. time
r{t + St ) = r(t) + Stv t — St
2 (2.31)
(2.32)
V elocities therefore ‘leapfrog’ over the positions to give their values at time
{t + St ). The positions then ‘leapfrog’ over the velocities to give a new value at
(r + St) , ready for the velocity at (r + ^ St).
leapfrog method explicitly includes the velocity; however, positions and velocities are not synchronised compared to the Verlet algorithm.
A common concern is the choice o f the timestep. The time step, must be shorter than the smallest frequency motion o f the molecule. Hence, a time step o f Ifs. is com m only used. Methods have evolved, however, notably the SHAKE algorithm^"^ developed by Berensden et al., in 1977, which constrained the high-frequency bonds to fixed lengths, which can usually allow the step size to be increased to 2fs or larger. A lso Gibson and Scheraga^^ have reported that with the BCPP potential function, where all bond lengths and angles are fixed, that it may be possible to use time steps as long as 15fs.
2.7.4 Equilibration
which are subsequently used for analysis. The codes used to perform the molecular dynamics calculations reported in Chapter 4 and Chapter 5 were M ARVIN and DL POLY, general purpose simulation programs.
2.7.5 Ensembles
The molecular dynamics calculations performed during this work utilized ensembles which enabled the temperature, energy or pressure to be controlled. The commonest procedure in molecular dynamics is the constant energy [NVE] dynamics (employing the microcanonical ensemble), where N , V and E represent the constant number o f atoms, constant volume and constant energy o f a simulated system. Constant temperature [NVT] dynamics (employing the canonical ensemble), is defined by N, V and T which represent the number o f atoms, volume and temperature kept constant in a simulated system. Finally, constant pressure [NPT] dynamics may be employed, where N, P and T represent the atoms, pressure and temperature which remain constant.
The canonical ensemble, [NVT], enables the temperature o f a system to be controlled, which is achieved by coupling the simulated system to a heat bath, thus enabling a dynamic exchange o f heat to and from the system. The method does however introduce energy drifts. Another method used to control the temperature involves rescaling the temperature at every step using X, which defines the factor (Tdesired/Tactuai)^^^ in cach time step o f the desired temperature, as defined in equation 2.35 below:
■ d e s i r e d - 1
T \ a c t u a l J
(2.35)
where X, is the scaling factor, t is the time and z is the coupling parameter which is representative o f the relaxation time o f the system. The coupling parameter is adjustable and determines exactly how precise the velocity re-scaling is.
The desired temperature o f a simulation can be initially calculated from the average o f the kinetic energy [left hand side o f equation 2.36] o f all o f the atoms in the system:
(2.36)
From equation 2.36 at time t = 0, no velocities are known. A ssigning random velocities to atoms via a Boltzman distribution for the given temperature enables the system to be heated. After the random velocities have been assigned the molecular dynamics method continues with the equilibration phase. The kinetic energy o f both scaling methods can be modified by scaling the velocities, with the rate o f heat transfer controlled by the coupling parameter r .
The NPT ensemble can be enabled by a similar procedure to that already explained above for the NVT ensemble, that is, by coupling to a pressure bath. The volume [as opposed to the velocities] o f the atoms are changed by scaling the co-ordinates by a
factor, A , defined by the difference o f the desired and actual pressure, ( P d e s i r e d - P a c t u a l ) ,
see equation 2.37 below
A = 3
( . ^ At 1 - K
It y
(P \ desired - P actual /) (2.37)
where, k defines the compressibility o f the system, and t the coupling parameter as
2.7.6 Calculation o f the diffusion coefficient
References
1. N.L. Allinger, ^t/v. Phys. Org. Chem. 1976 13 1
2. M. B om and J.R. Oppenheimer, Ann. Physik 8 4 ,457 1927
3. Cerius^ User Manual, Molecular Simulation Inc., San D iego, April 1997 4. A. Lifson, T. Hagler and P. Dauber, J. Am. Chem. Soc. 1979 101 5111, 5122 5. A.R. Leach, M olecular M odelling: Principles and A pplications, Longman
1996
6. C.R.A. Callow and W.C. Mackrodt, Lecture Notes in Physics, Computer Simulation o f Solids, Springer-Verlag, N ew York 1982.
7. B.G. Dick and A.W. Overhauser, Phys. Rev. 1958 90 112
8. G. Jacucci, I. McDonald and K. Singer, Phys. Lett. 1974 50A(2) 141
9. M. D ixon and M.J.L. Sangster, J. Phys. Chem: Solid State Phys. 1976 9 909 10. J.A. Board and R.J. Elliot, J. Phys. Cond. Matt. 1989 1 2427
11. M. Dixon and M.J.L. Sangster, J. Phys. Chem: Solid State Phys. 1975 8 L8 12. P.J.D. Lindlan and M.J. Gillan, J. Phys. Cond. Matt. 1993 5 1019
13. P.J. Mitchell and D. Fincham, J. Phys. Cond. M atter 1993 5 1031 14. R.A. Jackson and C.R.A. Catlow, Mol. Sim. 1988 1 207
15. R.S. Mulliken, J. Chem. Phys. 1962 36 3428 16. J.J.P. Stewart, Rev. Comp. Chem. 1990 1 45
17. M.J.S Dewar and W.Thiel, J. Am. Chem. Soc. 1977 99 4899
18. M.J.S Dewar, E.G. Zoebisch, E.F. Healy and J.J.P. Stewart, J. Am. Chem. Soc. 1985 107 3902
19. J. Gasteiger and M. Marsili, Tetrahedron 1980 36 3219 20. R.S. Mulliken, J. Chem. Phys. 1934 2 782
22. U. Buckert and N.L.Allinger, A.C.S. M onograph 177, Am. Chem. Soc. Washington D.C. 1982.
23. D.H. Gay and A.H. Rohl, J. Chem. Soc. Fara. Trans. 1995 91 925 24. J.D. Gale, J. Chem. Soc. Fara. Trans. 1997 93(4) 629
25. P.E. Gill, W. Murrey and M.H. Wright, Practical Optimization Academic Press, London 1981
26. D.F Shannon, Math. Comp. 1970 24 647
27. R. Fletcher and C.M. Reeves, J. Comp. 1964 7 149 28. M. Levitt and S. Lifson, J. Mol. Biol. 1969 46 269 29. N. Metropolis and S.Ulam, J. Am. St. Ass. 1949 44 335
30. B.J. Alder and T.E. Wainwright, J. Chem. Phys. 1959 27 1208 31. A. Rahman and F.H. Stillinger, J. Chem. Phys. 1974 60 1545
32. J.R. McCammon, B.R. Colin and M. Karplus, N ature (London) 1977 267 585 33. J.P. Ryckaert, G. Ciccotti and H.J.C. Berensden, J. Comp. Phys. 1977 23 585 34. W.F. van Gunsteren and H.C. Berensden, Mol. Phys. 1977 34 311
35. K.D. Gibson and H.A. Scheraga, J. Comp. Chem. 1990 11(4) 468 36. L.Verlet, Phys Rev. 1967 159 98
Chapter 3
Experim ental techniques
3.0 Overview
This chapter summarizes the relevant experimental data relating to the two main themes o f the thesis, namely the simulation o f crystal growth inhibition and the modelling o f molecular diffusion in zeolites. The former area is discussed first.
3.1 M ineral crystal growth
3.1.1 Introduction
Calcium carbonate is intrinsic to several areas o f fundamental and applied significance. These include its presence in very high concentrations in seawater, which leads to its precipitation in oil pipes, the scale o f which blocks and compromises efficient petroleum engineering. The precipitation within water also makes calcite scale conspicuous in domestic water heaters. The nuisance o f calcite accumulating in unwanted places therefore provided an incentive for rational investigations into how its growth may be controlled over the past century. Calcium carbonate occurs in several forms; calcite, vaterite and aragonite. The most stable o f these forms is calcite, the rhombohedral form o f which was used in the Chapter 4 study. The rhombohedral form o f calcite takes the form o f a distorted rock salt structure. The distortion occurs in the direction o f one o f the three diagonals that run through the structure. The structure has six faces and six mirror planes.
![Figure 3.4. From top: unit cell and middle diagram: (A) zeolite zinc silicalite [ZSM-48], (A l) unit cell of zinc silicalite.; from bottom: (B) zeolite ABW, (B l) zeolite ABW (C) zeolite siliceous Faujasite.](https://thumb-us.123doks.com/thumbv2/123dok_us/8467607.1389960/69.842.96.724.58.430/figure-silicalite-silicalite-zeolite-zeolite-zeolite-siliceous-faujasite.webp)
![Figure 5.3. Snapshot of CIT-1 macrocell: 12MR channels parallel to [001] crystallographic axis.](https://thumb-us.123doks.com/thumbv2/123dok_us/8467607.1389960/131.595.96.466.418.724/figure-snapshot-cit-macrocell-channels-parallel-crystallographic-axis.webp)
![Figure 5.6. Snapshot of overlaid para-xylene molecules within the 12MR channel viewed along the [010] projection showing molecule location during the course of an NVE simulation performed at 450K for 360ps.](https://thumb-us.123doks.com/thumbv2/123dok_us/8467607.1389960/141.595.117.431.104.355/snapshot-overlaid-molecules-projection-molecule-location-simulation-performed.webp)