University of South Carolina
Scholar Commons
Theses and Dissertations
1-1-2014
Development of a Pressure Swing Adsorption
Process for CO2 Capture from Flue Gas Using
Solid Amine Sorbents
Anahita Abdollahi Govar
University of South Carolina - Columbia
Follow this and additional works at:https://scholarcommons.sc.edu/etd
Part of theChemical Engineering Commons
This Open Access Dissertation is brought to you by Scholar Commons. It has been accepted for inclusion in Theses and Dissertations by an authorized administrator of Scholar Commons. For more information, please [email protected].
Recommended Citation
Abdollahi Govar, A.(2014).Development of a Pressure Swing Adsorption Process for CO2 Capture from Flue Gas Using Solid Amine
D
EVELOPMENT OF A PRESSURE SWING ADSORPTION PROCESS FORCO
2 CAPTURE FROM FLUE GAS USING SOLID AMINES
ORBENTSby
Anahita Abdollahi Govar
Bachelor of Science
Sharif University of Technology, 2005
Master of Science
Sharif University of Technology, 2007
Submitted in Partial Fulfillment of the Requirements
For the Degree of Doctor of Philosophy in
Chemical Engineering
College of Engineering and Computing
University of South Carolina
2014
Accepted by:
James A. Ritter, Major Professor
Armin D. Ebner, Committee Member
Miao Yu, Committee Member
Jamil Khan, Committee Member
John Weidner, Committee Member
D
EDICATIONA
CKNOWLEDGEMENTSI want to express my deepest appreciation to my advisor Dr. James A. Ritter, for
being a tremendous mentor for me. Without his guidance and encouragement this
dissertation would have not been possible. I would particularly like to thank my second
advisor Dr. Armin D. Ebner for his insightful comments and suggestions and teaching me
the art of problem solving. Many thanks to my committee members, Dr. Miao Yu, Dr.
Jamil Khan, and Dr. John Weidner for their time, and guidance.
I am grateful to Dr. Marjorie Nicholson for all her help in carrying out my
experiments. I would also like to express my thanks to all my previous and present
research group mates, Dr. Hai du, Dr. Amal Mehrotra, Dr. Jan Mangual, Dr. Shubhra
Bhadra, Dr. Fan Wu, Mohammad Iftekhar Hossain, Atikur Rahman, Nima Mohammadi,
Lutfi Erden and Hanife Erden.
I would like to offer my special thanks to my husband Mohsen Nikkhoo, for his
unconditional love and endless support. I owe much gratitude to my hard working parents
Aghdas Shariatmadar and Akbar Abdollahi Govar for all the sacrifices they made, their
love and care. Special thanks also to my sister Armita Abdollahi Govar for being my best
friend and always believing in me. I also want to extend special thanks to my in-laws,
A
BSTRACTSolid amines are comprised of adsorbent materials, like silica gel, that contain
amine based organic compounds, either physically or chemically, attached within their
pores. The major characteristic of these sorbents that makes them interesting for CO2
capture from flue gas is that unlike zeolites they are not negatively affected by the
presence of water. The current work has been focusing on the development of a novel
PSA cycle for CO2 capture from flue gas using a solid-amine sorbent composed of PEI
physically immobilized on a commercial silica substrate. The goal was to achieve > 90%
recovery and > 95 vol. % purity of CO2 at reasonable throughputs and operating cost.
A non-equilibrium kinetic model was developed to describe the reversible
adsorption and desorption of CO2 on this material over a wide range of industrial relevant
conditions. Effect of water on adsorption and desorption of CO2 was studied at various
temperatures and pressures of CO2 using TGA. Considering the adsorption of water on
this particular material and utilizing the developed model for CO2-solid amine, a series of
simulations were carried out for two PSA cycles under different operating conditions for
both dry and humid feeds.
In this dissertation the key results regarding the use of solid amines for post
combustion CO2 capture from flue gas by PSA are presented. The effects of different
parameters on the performance of the PSA process in terms of recovery and purity of
performance is explored. Finally two hypothetical sorbents are proposed. The use of these
sorbents can improve the performance of the PSA process in terms of water recovery in
T
ABLE OFC
ONTENTSDEDICATION ... iii
ACKNOWLEDGEMENTS ... iv
ABSTRACT ...v
LIST OF TABLES ...x
LIST OF FIGURES ... xi
LIST OF SYMBOLS ...xv
LIST OF ABBREVIATIONS ... xxii
CHAPTER 1:SEMI-EMPIRICAL KINETIC MODEL THAT DESCRIBES THE REVERSIBLE ADSORPTION AND DESORPTION OF CO2 IN A SOLID AMINE SORBENT ...1
1.1SUMMARY ...1
1.2INTRODUCTION ...2
1.3EXPERIMENTAL ...5
1.4 KINETIC MODEL DEVELOPMENT ...5
1.5 RESULTS AND DISCUSSION ...10
1.6 CONCLUSIONS ...16
1.7TABLES ...18
1.8 FIGURES ...24
CHAPTER 2:CO2CAPTURE FROM FLUE GAS BY PSAUSING A SOLID AMINE SORBENT: DRY FEED ...37
2.3 CYCLE DESCRIPTION ...40
2.4MATHEMATICAL MODEL ...42
2.5 RESULTS AND DISCUSSION ...47
2.6 CONCLUSIONS ...51
2.7TABLES ...53
2.8 FIGURES ...59
CHAPTER 3:EFFECT OF WATER ON ADSORPTION AND DESORPTION OF CO2 IN A SOLID AMINE SORBENT ...67
3.1SUMMARY ...67
3.2INTRODUCTION ...68
3.3 EXPERIMENTAL ...70
3.4 RESULTS AND DISCUSSION ...73
3.5 CONCLUSIONS ...81
3.6 FIGURES ...83
CHAPTER 4:CO2CAPTURE FROM FLUE GAS BY PSAUSING A SOLID AMINE SORBENT: HUMID FEED ...91
4.1SUMMARY ...91
4.2INTRODUCTION ...92
4.3CYCLE DESCRIPTION AND MATHEMATICAL MODEL ...94
4.4 RESULTS AND DISCUSSION ...97
4.4.1PSA SIMULATION RESULTS FOR G10-CARIACT SOLID AMINE ...97
4.4.2PSA SIMULATION RESULTS FOR HYPOTHETICAL SORBENTS ...100
4.5 CONCLUSIONS ...102
4.7 FIGURES ...106
L
IST OFT
ABLESTable 1.1 Adsorption/Reaction sites for models I-V ...18
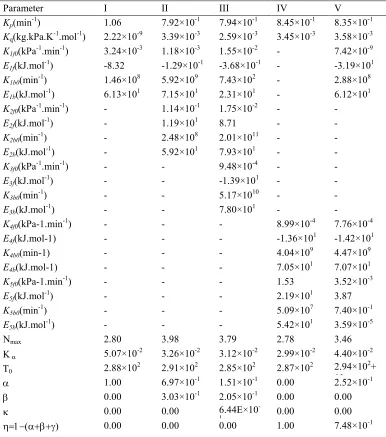
Table 1.2 Model parameters for models I-V ...19
Table 1.3 Heat of adsorption/reaction for models I-V ...20
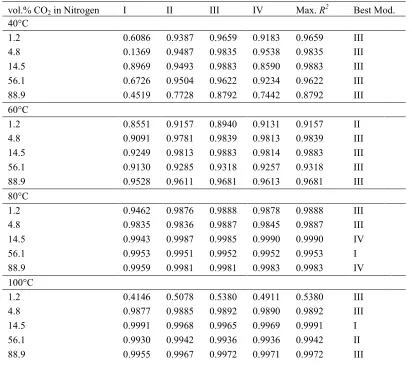
Table 1.4 R2 values for models I-IV for four cycles at 40, 60, 80 and 100C for 1.2, 4.8,
14.5, 56.1 and 88.9 vol. % CO2 in Nitrogen ...21
Table 1.5 R2 values for models I-IV for four cycles at 40, 60, 80 and 100C for 32.8 and
69.8 vol. % CO2 in Nitrogen. ...22
Table 1.6 R2 values for equilibrium loadings predicted by models I-IV at 80 and 100C.23
Table 2.1 Bed and adsorbent characteristics, gas properties and process conditions. ...53
Table 2.2 Initial and boundary conditions for cycle I. f: final; C.M.B.: component mass
balance; O.M.B.: overall mass balance; K.M.: kinetic model for CO2; LDF.E: LDF
equation, E.B.: energy balance; M.B.: momentum balance, V.E.: valve equation, 1: CO2,
2: Nitrogen, Fv: Flow calculated with valve equation. ...54
Table 2.3 Initial and boundary conditions for cycle II. f: final; C.M.B.: component mass
balance; O.M.B.: overall mass balance; K.M.: kinetic model for CO2; L.D.F.E: LDF
equation, E.B.: energy balance; M.B.: momentum balance, V.E.: valve equation, 1: CO2,
2: Nitrogen, Fv: Flow calculated with valve equation. ...55
Table 2.4 Conditions for parametric study (runs 1-7) for cycles I and II ...56
Table 2.5 Moles of CO2 and nitrogen leaving the bed and the corresponding energy
needed during CoD, CnD and LR/LR1-LR2 steps in cycles I and II for throughput=224.47(L(STP)/kg/hr) in runs 1-7. ...57
Table 2.6 Conditions for runs 8-10 for cycles I and II...58
Table 4.1 Bed and adsorbent characteristics, gas properties and process conditions ...104
L
IST OFF
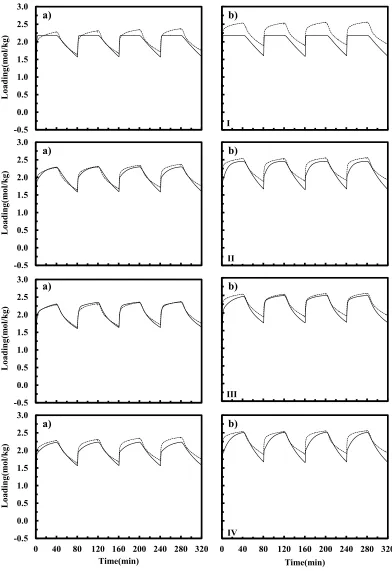
IGURESFigure 1.1 Model III predictions (solid line) vs. experimental data (dotted line) with and
without TGA effect for 14.5 vol. % CO2 in Nitrogenat a) 100oC, b) 80oC, c) 60oC, d)
40oC...24
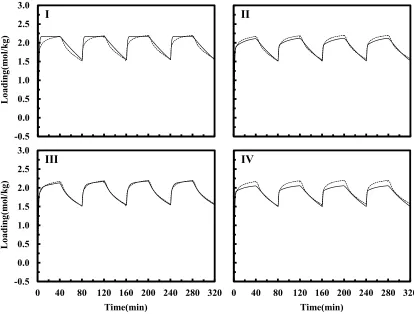
Figure 1.2 Model I-IV predictions (solid line) vs. experimental data (dotted line) at 40oC
for 1.2 vol. % CO2 in Nitrogen...25
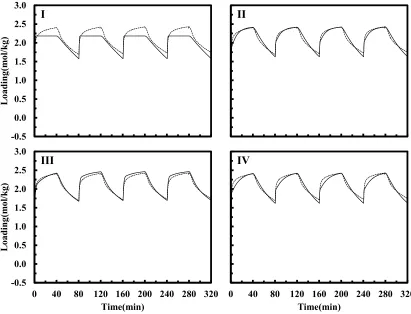
Figure 1.3 Model I-IV predictions (solid line) vs. experimental data (dotted line) at 40oC
for 4.8 vol. % CO2 in Nitrogen...26
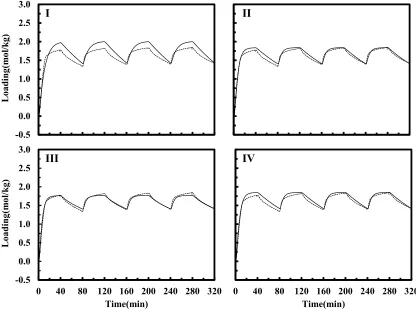
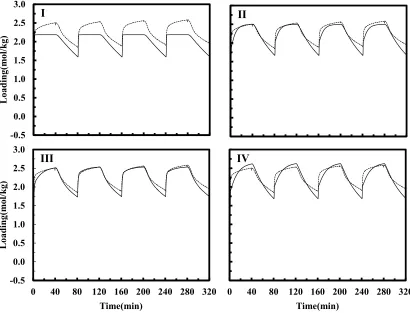
Figure 1.4 Model I-IV predictions (solid line) vs. experimental data (dotted line) at 40oC
for 14.5 vol. % CO2 in Nitrogen ...27
Figure 1.5 Place Model I-IV predictions (solid line) vs. experimental data (dotted line) at
40C for 56.1 vol. % CO2 in Nitrogen figure name here ...28
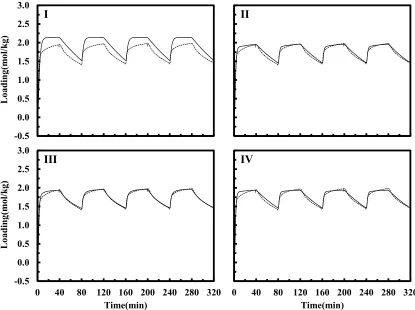
Figure 1.6 Model I-IV predictions (solid line) vs. experimental data (dotted line) at 40oC
for 88.6 vol. % CO2 in Nitrogen ...29
Figure 1.7 Model I-IV predictions (solid line) vs. experimental data (dotted line) at 40oC
for a) 32.8 and b) 69.8 vol. % CO2 in Nitrogen ...30
Figure 1.8 Model III predictions (solid line) vs. experimental data (dotted line) at 60C
for a) 1.2, b) 4.8, c) 14.5, d) 56.1 and e) 88.6 vol. % CO2 in Nitrogen ...31
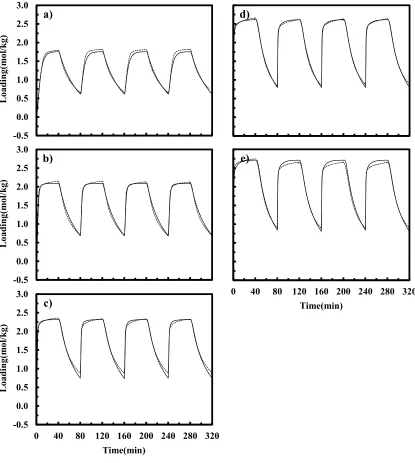
Figure 1.9 Model III predictions (solid line) vs. experimental data (dotted line) at 80C
for a) 1.2, b) 4.8, c) 14.5, d) 56.1 and e) 88.6 vol. % CO2 in Nitrogen ...32
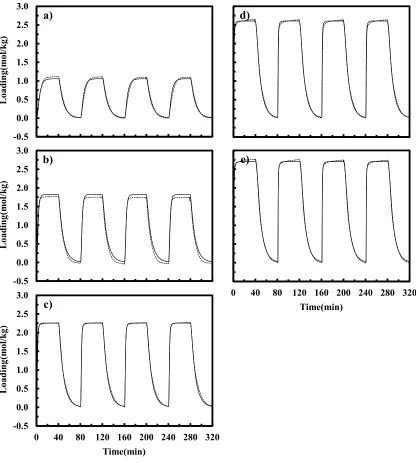
Figure 1.10 Model III predictions (solid line) vs. experimental data (dotted line) at 100oC
for a) 1.2, b) 4.8, c) 14.5, d) 56.1, and e) 88.6 vol. % CO2 in Nitrogen ...33
Figure 1.11 Model III predictions (solid line) vs. experimental data (dotted line) at 60, 80,
and 100C for a) 32.8 and 69.8 vol. % CO2 in Nitrogen ...34
Figure 1.12 Model I-IV predictions (lines) vs. experimental working capacity (symbols)
at a) 40C, b) 60C, c) 80C, d) 100C ...35
Figure 2.1 Cycle steps for a) cycle I and b) cycle II, and cycle schedule for c) cycle I and d) cycle II ...59
Figure 2.2 Results of runs 1-3 (effect of LR ratio ()) for cycles I and II. ...60
Figure 2.3 Bed profiles for throughput=224.47 (L(STP)/kg/hr) for runs 1-3, for cycles I and II. ...61
Figure 2.4 Results for runs 1, 4-5 (effect of HR ratio ()) for cycles I and II ...62
Figure 2.5 Bed profiles for =224.47 (L(STP)/kg/hr) for runs 1, 4-5, for cycles I and II .63
Figure 2.6 Results for runs 1, 6-7 (effect of PCoD) for cycles I and II ...64
Figure 2.7 Bed profiles for throughput=224.47 (L(STP)/kg/hr) for runs 1, 6-7, for cycles I and II ...65
Figure 2.8 Results for runs 8-10 for cycles I and II ...66
Figure 3.1 Experimental setup3 ...83
Figure 3.2 Adsorption and desorption of 2 vol. % water and 100 vol. % CO2 in Nitrogen
on CARiACT G10 solid amine sorbent at a) 100C, b) 80C, c) 60C and d) 40C ...84
Figure 3.3 Adsorption and desorption of 2 vol. % water and a mixture of 2.0 vol. % CO2
in Nitrogen on CARiACT G10 solid amine sorbent at a) 100C, b) 80C, c) 60C and d)
40C ...85
Figure 3.4 TGA Loading in the presence and absence of 2 vol. % water at 100°C for a)
adsorption of 100 vol. % CO2, b) desorption at of 100 vol. % CO2, c) adsorption of 2.0
vol. % CO2, d) desorption of 2.0 vol. % CO2 in Nitrogen ...86
Figure 3.5 TGA Loading in the presence and absence of 2 vol. % water at 80°C for a)
adsorption of 100 vol. % CO2, b) desorption at of 100 vol. % CO2, c) adsorption of 2.0
vol. % CO2, d) desorption of 2.0 vol. % CO2 in Nitrogen ...87
Figure 3.6 TGA Loading in the presence and absence of 2 vol. % water at 60°C for a)
adsorption of 100 vol. % CO2, b) desorption at of 100 vol. % CO2, c) adsorption of 2.0
vol. % CO2, d) desorption of 2.0 vol. % CO2 in Nitrogen ...88
Figure 3.7 TGA Loading in the presence and absence of 2 vol. % water at 40°C for a)
adsorption of 100 vol. % CO2, b) desorption at of 100 vol. % CO2, c) adsorption of 2.0
vol. % CO2, d) desorption of 2.0 vol. % CO2 in Nitrogen ...89
Figure 4.1 Simulation results for runs 1 and 2 with silica-based solid amine sorbent (G10
CARiACT-solid amine), in terms of CO2 recovery (%), purity (%-dry basis) in the heavy
product and avoided energy (kJ/mol CO2) at different throughputs and for three different
feed water contents: no water, 2% and 17% water. In recovery vs. purity figures, feed throughput increases from right to left...106
Figure 4.2 Simulation results for cycle I with silica-based solid amine sorbent (G10 CARiACT-solid amine), in terms of water recovery (%), purity (%) in the heavy product at different throughputs and for three different feed water contents: no water, 2% and 17% water. Feed throughput increases from right to left ...107
Figure 4.3 Simulation results for cycle II with silica-based solid amine sorbent, in terms
of CO2 recovery (%), purity (%) in the heavy product and avoided energy (kJ/mol CO2)
at different throughputs and for three different feed water contents: no water, 2% and 17% water. In recovery vs. purity figures, feed throughput increases from right to left .108
Figure 4.4 Simulation results for cycle II with silica-based solid amine sorbent, in terms of water recovery (%), purity (%) in the heavy product at different throughputs and for three different feed water contents: no water, 2% and 17% water. Feed throughput increases from right to left ...109
Figure 4.5 Simulation results for cycle I with carbon-based solid amine sorbent (CBSA),
in terms of CO2 recovery (%), purity (%-dry basis) in the heavy product and avoided
energy (kJ/mol CO2) at different throughputs and for three different feed water contents:
no water, 2% and 17% water. In recovery vs. purity figures, feed throughput increases from right to left ...110
Figure 4.6 Simulation results for cycle I with carbon-based solid amine sorbent (CBSA), in terms of water recovery (%), purity (%) in the heavy product at different throughputs and for three different feed water contents: no water, 2% and 17% water. Feed throughput increases from right to left ...111
Figure 4.7 Simulation results for cycle II with carbon-based solid amine sorbent (CBSA),
in terms of CO2 recovery (%), purity (%-dry basis) in the heavy product and avoided
energy (kJ/mol CO2) at different throughputs and for three different feed water contents:
no water, 2% and 17% water. In recovery vs. purity figures, feed throughput increases from right to left ...112
Figure 4.9 Simulation results for cycle I with hydrophobic carbon based solid amine
sorbent (HCBSA) in terms of CO2 recovery (%), purity (%-dry basis) in the heavy
product and avoided energy (kJ/mol CO2) at different throughputs and for three different
feed water contents: no water, 2% and 17% water. In purity vs. recovery figures, feed throughput increases from right to left...114
Figure 4.10 Simulation results for cycle I with hydrophobic carbon-based solid amine sorbent (HCBSA), in terms of water recovery (%), purity (%) in the heavy product at different throughputs and for three different feed water contents: no water, 2% and 17% water. Feed throughput increases from right to left ...115
Figure 4.11 Simulation results for cycle II with hydrophobic carbon-based solid amine
sorbent (HCBSA), in terms of CO2 recovery (%), purity (%-dry basis) in the heavy
product and avoided energy (kJ/mol CO2) at different throughputs and for three different
feed water contents: no water, 2% and 17% water. In recovery vs. purity figures, feed throughput increases from right to left...116
L
IST OFS
YMBOLSA Area (m2)
0 ,
1H2O
b Pre-exponential constant for temperature dependence of b1,H2O(kPa
-1)
0 , 1N2
b Pre-exponential constant for temperature dependence of b1,N2 (kPa
-1)
0 ,
2H2O
b Pre-exponential constant for temperature dependence of b2,H2O (kPa
-1)
0 ,
2N2
b Pre-exponential constant for temperature dependence of b2,N2(kPa
-1)
O H 1, 2
b Constant in Dual Process Langmuir isotherm for water (kPa-1)
2 N 1,
b Constant in Dual Process Langmuir isotherm for Nitrogen (kPa-1)
O H 2, 2
b Constant in Dual Process Langmuir isotherm for water (kPa-1)
2 N 2,
b Constant in Dual Process Langmuir isotherm for Nitrogen (kPa-1)
O H2
B1, Energy parameter in for adsorption of water on site 1, (K-1)
2 N
B1, Energy parameter in for adsorption of Nitrogen on site 1 (K-1)
O H2
B2, Energy parameter in for adsorption of water on site 2 (K
-1)
2 N
B2, Energy parameter in for adsorption of Nitrogen on site 2 (K-1)
j a
Cp , Adsorbed phase heat capacity of component j (kJ.mol-1.K-1)
g
Cp Gas phase heat capacity (kJ.mol-1.K-1)
j g
T
C Total molar concentration (mol.m-3)
v
c Valve coefficient
f k
E , Forward activation energy for the CO2 chemisorption reaction k (kJ.mol-1)
b k
E , Backward activation energy for the CO2 chemisorption reaction k (kJ.mol-1)
O H H
E
2
, Energy parameter in the Arrhenius equation for Henry’s law constant for water
(kPa-1)
F Molar flow rate through the valve
w
h Overall heat transfer coefficient (kW.m-2.K-1)
k Reaction number
2
CO
K Mass transfer coefficient of CO2 (s-1)
e k
K , Equilibrium constant for reaction k (kPa
-1)
0 , k
K Pre-exponential constant for equilibrium constant of reaction k (kPa-1)
f k
K , Forward reaction rate constant for reaction k (kPa-1.min-1)
b k
K , Backward reaction rate constant for reaction k (min-1)
0 ,
,b
k
K Pre-exponential constant for backward reaction k (min-1)
0 ,
,f
k
K Pre-exponential constant for forward reaction k (min-1)
O H
k
2
Mass transfer coefficient of water (s-1)
O H H K 2 ,
0 Pre-exponential constant in the Arrhenius equation for Henry’s law constant for
water (kPa-1)
O H H
K
2
, Henry’s law constant for water (kPa
p
K Constant (min-1)
q
K Constant (kg.kPa.K-1.mol-1)
0 ,
,b
k
K Pre-exponential constant in Arrhenius eq. for Kk,b
0 ,
,f
k
K Pre-exponential constant in Arrhenius eq. for Kk,b
e
K1, Equilibrium constant for reaction between CO2 and N1
e
K2, Equilibrium constant for reaction between CO2 and N2
e
K3, Equilibrium constant for reaction between CO2 and N3
e
K4, Equilibrium constant for reaction between CO2 and N4
e
K5, Equilibrium constant for reaction between CO2 and qCO2,4
b
K1, Backward reaction rate constant for reaction of CO2 and N1 (min-1)
f
K1, Forward reaction rate constant for reaction of CO2 and N1 (kPa-1.min-1)
b
K2, Backward reaction rate constant for reaction of CO2 and N2 (min-1)
f
K2, Forward reaction rate constant for reaction of CO2 and N2 (kPa-1.min-1)
b
K3, Backward reaction rate constant for reaction of CO2 and N3 (min-1)
f
K3, Forward reaction rate constant for reaction of CO2 and N3 (kPa-1.min-1)
b
K4, Backward reaction rate constant for reaction of CO2 and N4 (min-1)
f
K4, Forward reaction rate constant for reaction of CO2 and N4 (kPa-1.min-1)
b
K5, Backward reaction rate constant for reaction of CO2 and qCO2,4 (min
-1)
f
K5, Forward reaction rate constant for reaction of CO2 and qCO2,4 (kPa
) (t
M Molar flow leaving the bed at time t
g
M Average molecular weight of the gas phase
N Number of components
max
N Maximum number of adsorption/reaction sites for CO2 (mol/kg-1)
t
N Total number of adsorption/reaction sites for CO2 (mol.kg-1)
1
N Number of adsorption/reaction sites which react with CO2 and form ,1
2
CO
q
(mol.kg-1)
2
N Number of adsorption/reaction sites which react with CO2 and form ,2
2
CO q
(mol.kg-1)
3
N Number of adsorption/reaction sites which react with CO2 and form ,3
2
CO q
(mol.kg-1)
4
N Number of adsorption/reaction sites which react with CO2 and form ,4
2
CO q
(mol.kg-1)
P Pressure (kPa)
o
P Pressure outside the valve (kPa)
2
CO
P Partial pressure of CO2 in the feed gas (kPa)
*
2
CO
P Partial pressure of CO2 in the gas that is in contact with the adsorbent (kPa)
e CO
q ,1,
2 Sites taken from N1 by CO2 at equilibrium (mol.kg
-1)
1 ,
2
CO
q Sites taken from N1 by CO2 at time t (mol.kg-1)
e CO
q ,2,
2 Sites taken from N2 by CO2 at equilibrium (mol.kg
-1)
2 ,
2
CO
q Sites taken from N2by CO2 at time t (mol.kg-1)
e CO
q 3, Sites taken from N3 by CO2 at equilibrium (mol.kg
3 ,
2
CO
q Sites taken from N3 by CO2 at time t (mol.kg-1)
e CO
q ,4,
2 Sites taken from N4 by CO2 at 2 at equilibrium (mol.kg
-1)
4 ,
2
CO
q Sites taken from N4 by CO2 at time t (mol.kg-1)
e CO
q ,5,
2 Sites taken from N4 by two CO2s at equilibrium (mol.kg
-1)
5 ,
2
CO
q Sites taken from N4 by two CO2s at time t (mol.kg-1)
e t CO
q 2,, Total CO2 loading at equilibrium (mol.kg
-1)
exp
q Mean of experimental CO2 loading over four cycles (mol.kg-1)
*
2O H
q Equilibrium adsorbed amount of water (mol.kg-1)
O H
q
2 Loading on water at time t (mol.kg
-1)
exp , i
q Experimental value for CO2 loading at time t (mol.kg-1)
mod , i
q Model value for CO2 loading (mol.kg-1)
*
2
N
q Equilibrium adsorbed amount of Nitrogen (mol.kg-1)
2
N
q Loading on Nitrogen at time t (mol.kg-1)
s O H 1, 2
q Maximum possible adsorbed amount of water on site 1 (mol.kg-1)
s O H 2, 2
q Maximum possible adsorbed amount of water on site 2 (mol.kg-1)
s N 1, 2
q Maximum possible adsorbed amount of Nitrogen on site 1 (mol.kg-1)
s N 2, 2
q Maximum possible adsorbed amount of Nitrogen on site 2 (mol.kg-1)
R Universal gas constant (J.mol-1.K-1)
2
p
r Radius of the pellet (m)
s Number of energy consuming steps
g
S Specific gravity of the gas relative to air at 1 atm and 21.45C
t Time
T Temperature (K)
o
T Ambient temperature (K)
FD
T Constant in Fermi-Dirac distribution (K)
V Volume of the TGA chamber (m3)
s
V Adsorbent volume (m3)
i
y Mole fraction of component i
z Column position (m)
Fraction of total reaction sites that belongs to N1
Fraction of total reaction sites that belongs to N2
Fraction of total reaction sites that belongs to N3
Fraction of total reaction sites that belongs to N4
g
μ Gas phase viscosity (Pa.s)
b
Bed porosity
p
Particle porosity
k Constant in Fermi-Dirac distribution
k Constant in Fermi-Dirac distribution used for temperature dependency of Nt
p
Density of the particle (kg.m-3)
s
Adsorbent density (kg.m-3)
k CO
H 2,
Effective heat of adsorption/reaction for reaction k (kJ.mol-1)
i
H
Effective heat of adsorption/reaction for component i (kJ.mol-1)
Efficiency of compressor
Fraction of gas stream leaving the bed during the feed step light reflux that is
recycled to the bed undergoing the light reflux step
Fraction of gas stream leaving the bed during the light reflux step that is recycled
L
IST OFA
BBREVIATIONSCBSA ... Carbon-Based Solid Amine
CGSA ... CARiACT G10 Solid Amine
CMB ... Component Mass Balance
CnD ... Counter- Current Depressurization
CoD ... Co-Current Depressurization
EB ... Energy Balance
Eq ... Equalization-down
Eq’ ... Equalization-up
HCBSA ... Hydrophobic Carbon-Based Solid Amine
HR ... Heavy Reflux
KM ... Kinetic Model
LDFE... Linear Driving Force Equation
LPP ... Light Product Pressurization
LR ... Light Reflux
OMB ... Overall Mass Balance
PSA ... Pressure Swing Adsorption
TGA ... Thermogravimetric Analyzer
C
HAPTER1
S
EMI-E
MPIRICALK
INETICM
ODEL THATD
ESCRIBES THER
EVERSIBLEA
DSORPTION ANDD
ESORPTION OFCO
2 IN AS
OLIDA
MINES
ORBENT1.1 Summary
Five semi-empirical, temperature-dependent kinetic models were studied to
describe the reversible adsorption of CO2 in a solid amine sorbent composed of poly
(ethyleneimine) immobilized in to a CARiACT® G10 support at 28 conditions; four
temperatures (40, 60, 80 and 100°C) and eight concentrations of CO2 (1.2, 4.8, 14.5,
32.8, 56.1, 69.8, and 88.6 vol. % in Nitrogen). At each condition experimental data was
obtained for 4 cycles of 40 minutes adsorption followed by 40 minutes desorption using
thermogravimetric analyzer. Model parameters were determined by fitting the first two
cycles at 20 conditions; 1.2, 4.8, 14.5, 56.1, and 88.6 vol. % in Nitrogen at all
temperatures. The following cycles (3rd and 4th cycles) and also the cycling data at other
eight conditions were then predicted using the same parameters, to evaluate interpolation
and extrapolation capabilities of each model. The goodness of fit of models was then
compared based on their predicted results for all four cycles considering all the 28
conditions. The model which best represented the kinetic was consisted of three parallel
reactions. It also gave a good fit for the periodic state working capacities and the
equilibrium loadings at higher temperatures. Considering the wide range of conditions,
Therefore this model can be used in dynamic adsorption process simulator to investigate
the performance of a PSA process using this sorbent for CO2 capture from flue gas.
1.2 Introduction
Carbon dioxide is one of the primary greenhouse gases existing in the
atmosphere. Increasing amounts of these gases because of human activities have led to
global warming in recent years which will result in changes in climate like longer and
stronger heat waves, reduced snowpack, increased evaporation, and other changes which
will affect human and wildlife health.1 Fossil fuel power plants are a major source for
CO2 emissions. Capturing CO2 from the flue gas before releasing it to the atmosphere is
an option that is being considered in order to reduce the CO2 amount that is emitted by
these plants.
One promising technology for separating the CO2 from flue gas is pressure swing
adsorption (PSA). An appropriate sorbent is an essential part of an efficient PSA process.
When it comes to capturing CO2 from flue gas, specific characteristics of the adsorbent
should be taken into account; having a good working capacity for CO2 and being water
tolerant. Several sorbents have been studied for CO2 capture like zeolites Y and 13X, and
activated carbon at ambient temperature and HTLcs at high temperatures (302C).2
Another group of sorbents that are being considered for post combustion CO2 capture are
solid amine sorbents that have been reported to have adequate working capacity for CO2
even in the presence of water.3-37 In these sorbents amine functional groups are
chemically attached or physically immobilized on the surface of a porous support like
mostly used sorbent for CO2 capture, the adsorption of CO2 in these sorbents is not
negatively affected by the presence of water.3 Suitability of solid amine sorbents for CO2
capture from flue gas by pressure swing adsorption (PSA) has been studied by Ebner et
al.3 and Belmakhout and Sayari4. Yet the performance of a PSA process using these
sorbents have not been reported in the literature. In order to simulate and study the
performance of the PSA process with solid amines, a kinetic model which can describe
the reversible adsorption and desorption of CO2 in these sorbents is needed.
Reaction between CO2 and liquid alkanolamines have been extensively studied.38
Three mechanisms have been provided to describe CO2-Alkanolamine reactions;
zwitterian, termolecular and base catalyzed mechanisms; zwitterion has been mostly used
for reaction with primary, secondary and sterically hindered amines whereas
base-catalyzed hydration of CO2 has been used for reaction with tertiary amines.38 However
none of these reactions have been used to model the kinetics of adsorption and desorption
of CO2 in a solid amine sorbent.
Yousef Belmabkhout and Abdelhamid Sayyari used linear driving force (LDF) to
fit the adsorption of CO2 on a series of amine modified silica sorbents.5, 6 Still they only
studied the kinetics of adsorption and they did not provide any data or model on
desorption. Rodrigo Serna-Guerrero et al. proposed an equilibrium model to describe the
CO2 adsorption isotherms on amine-grafted mesoporous silica.7 In their model adsorption
of CO2 was occurred through two independent mechanisms: 1. chemisorption on amine
functional groups and 2. physisorption on the surface of the adsorbent. Subsequently the
total equilibrium loading was sum of the equilibrium physisorbed loading and the
This equilibrium model was then used in another work by their group where they used a
series of Lagergen’s pseudo-first and pseudo-second order and Avrami kinetic models to
model adsorption of CO2 on amine functionalized mesoporous silica.8 Then again no data
related to desorption kinetics was provided. Ebner et al. provided a reversible mechanism
for the kinetic of chemisorption and developed a Langmuir-type expression for
equilibrium loading of CO2 on CARiACT® G10 solid amine3 but no kinetic data fitting
was shown.
To our knowledge a mechanism that clearly describes the reversible adsorption
and desorption of CO2 on solid amines is lacking. Therefore the aim of this study was to
develop a kinetic model which could predict the adsorption and desorption of CO2 in a
solid amine, composed of poly (ethyleneimine) (PEI) supported on a commercial silica
substrate. This sorbent has been reported by Ebner et al.3 to be suitable to be used in a
PSA process to capture CO2. Starting from a one site-one reaction model, five models
were studied in order to describe the adsorption and desorption of CO2 on this material at
28 conditions. These models included various combinations of reactions taking place in
parallel and/or in series with each other. Also an empirical equation has been utilized to
capture the particular temperature dependency of the kinetics caused by rheological
changes of the PEI in this material with temperature. The kinetic model developed here
can be used in a dynamic adsorption process simulator to study the performance of a PSA
1.3 Experimental
The solid amine used here is comprised of 40 wt. % polyethylenimine physically
immobilized on a silica support. Details of the method are given elsewhere.3, 9, 10, 11 The
adsorption and desorption of CO2 at various industrial relevant conditions was measured
using a Perkin Elmer TGA-7 thermogravimetric. Every experimental run was consisted
of 80 minutes activation of around 20 mg of the sorbent in pure Nitrogen (UHP Grade,
Airgas) at 100oC and 4 cycles of adsorption of CO2 (Coleman Grade, Airgas) mixture
followed by desorption in pure Nitrogen, each for 40 minutes. The adjustment of
temperature from 100oC to the desired temperature was carried out using a 20oC/min
ramp. The gas flow was set to 60 (cm3/min) at 1 atm. Experiments were carried out for
CO2 concentrations from 1 to 88.9 vol. % and temperatures from 40 to 100oC. The
experimental setup and the details of the method is thoroughly explained by Ebner et al.3
1.4 Kinetic Model Development
Five models were studied to predict the reversible adsorption of CO2 in
CARiACT® G10 solid amine sorbent. Models studied in this work are consisted of
different combinations of reactions shown below.
1 ,
1 2
2
)
1 PCO N qCO
2 ,
2 2
2
)
2 PCO N qCO
3 ,
3 2
2
)
3 PCO N qCO
5 , 4
,
4 2 2 2
2
)
In these reactions, PCO2 is the partial pressure of CO2, N1-N4 are different
adsorption/reaction sites in the sorbent. qCO2,1,qCO2,2, and qCO2,3 are the reaction sites
taken by CO2 from N1, N2, and N3respectively.. qCO2,4 represents the reaction sites taken
from N4 with one CO2 per site, while qCO2,5 shows the reaction sites taken from N4 with
two CO2s per site.
Table 1.1 shows the reactions present in each model. There is only one type of
reaction site in model I (N1). Each reaction site reacts with one CO2. In model II, there are
two types of reaction sites (N1 and N2) that react with CO2 via two parallel reactions. In
model III, there are three types of reaction sites (N1, N2 and N3) that react with CO2
through three parallel reactions. Model IV is consisted of two reactions in series with one
type of reaction site (N4). Each reaction site can take two CO2s. A mechanism similar to
model IV has been provided by Planas et al., for adsorption of CO2 in an
alkylamine-functionalized metal-organic framework.39 In their proposed mechanism, two amine sites
adsorb two CO2s, but this happens in a series of reactions. Although in their mechanism,
each reaction sites, takes only one CO2, the second CO2 reacts with the amine sites only
after the first one has been adsorbed. Two types of reaction sites (N1 and N4) are present
in model V; one adsorbs one CO2 per site, the other adsorbs two CO2s per site. Reactions
of CO2 with these two types are in parallel. Equations describing the above reactions are
shown in equations 1-10. Equation 11 which is a form of Fermi-Dirac distribution was
used to explain the temperature dependency of the amine sites.
1 , , 1 1 , 1 ,
1 1 ,
2 2
2
2 ,( )
CO b CO
CO f CO
q k q
N P K dt dq
2 , , 2 2 , 2 , 2 2 , 2 2 2
2 ( )
CO b CO CO f CO q k q N P K dt dq (2) 3 , , 3 3 , 3 , 3 3 , 2 2 2
2 ( )
CO b CO CO f CO q k q N P K dt dq (3) dt dq q k q q N P K dt dq CO CO b CO CO CO f
CO ,5
5 , , 5 5 , 4 , 4 , 4 4 , 2 2 2 2 2
2 ( ) (4)
5 , , 5 4 , , 5 5 , 2 2 2 2 CO b CO CO f CO q k P q K dt dq (5) t CO CO CO CO CO
CO q q q q q
q ,1 ,2 ,3 ,4 ,5 ,
2 2
2 2
2
2 2 (6)
t
N
N1 (7)
t
N
N2 (8)
t
N
N3 (9)
t
t N
N
N4 (1 ) (10)
)) ( exp( 1 max FD t T T k N N (11)
In equations 1-11, K1,f, K2,f, K3,f, K4,f, and K5,f are forward reaction constants and
K1,b, K2,b, K3,b, K4,b, and K5,b are backward reaction constants for formation of q1, q2, q3,
q4, and q5, respectively. qt is the total CO2 loading. , , and show the fractions of Nt
that belong to N1, N2, N3, and N4 respectively. These fractions were assumed to be
amines.3, 11 The fact that different amine types are present in the sorbent and also the way
that each amine group is located on the support may result in different
adsorption/reaction sites in the sorbent. Models II to V were studied in order to count for
these different sites if exist. Moreover the flexibility of PEI changes with temperature,
which leads to the changes in the accessibility of the amine sites for CO2 with
temperature.12, 13 Since PEI is more flexible at higher temperatures, more amines are
available for CO2 to react with, whereas at lower temperatures, some may become
unavailable due to the rigidity of the PEI. To capture the possible morphological changes
with temperature, equation 11 was considered; it was assumed that the number of each
kind of reaction sites, which could participate in the chemisorption of CO2, was a
function of temperature.
Temperature dependence of reaction constants was expressed by Arrhenius
equation: ) exp( , 0 , , , RT E K
Kk f k f k f ; k =1, 2, 3, 4, 5 (12)
) exp( , 0 , , , RT E K
Kkb kb kb
; k =1, 2, 3, 4, 5 (13)
At equilibrium the forward reaction rate is equal to the backward reaction rate and
we have: 0 5 , 4 , 3 , 2 , 1
, 2 2 2 2
2
dt dq dt dq dt dq dt dq dt
dqCO CO CO CO CO
(14)
Equilibrium loadings and heat of reactions are shown in equations 15-23.
1 ,
1ePCO N
K
2 2 2 , 2 2 , 2 , 2 ,
1 e CO
CO e e CO P K N P K q (16) 2 2 2 , 3 3 , 3 , 3
1 e CO
CO e e CO P K N P K q (17) 2 , 4 , 5 , 4 4 , 4 , 4 , 2 2 2 2 1 CO P K K P K N P K q e e CO e CO e e CO (18) 2 , 4 , 5 , 4 4 2 , 4 , 5 , 5 , 2 2 2 2 1 CO P K K P K N P K K q e e CO e CO e e e CO (19) e t CO CO q q q q q q e e CO e CO e CO e
CO2,1, 2,2, 2,3, 2,4, 2 2,5, 2,, (20)
) exp( , 0 , , , , 2 RT H K K K
K k CO k
b k f k e k
; k =1, 2, 3, 4, 5 (21)
0 , , 0 , , 0 , b k f k k K K
K ; k =1, 2, 3, 4, 5 (22)
b k f k k
CO E E
H , , ,
2
; k =1, 2, 3, 4, 5 (23)
In equations 12-23, Kk,f,0, Kk,b,0, E k,f and Ek,b show the pre-exponential constants
and activation energies in Arrhenius equations for forward and backward reactions Kk,e
shows the equilibrium constant for reaction k. qCO e
, 1 ,
2 , qCO2,2,e, qCO2,3,e, qCO2,4,e, and qCO2,5,eare
equilibrium loadings of CO2 corresponded to N1, N2, N3 and N4 respectively. qCO ,t,e
2 is the
total equilibrium loading of CO2 and HCO2,k represents the effective heat of reaction for
1.5 Results and discussion
In each cycle, at the beginning of adsorption and desorption, the feed gas replaces
the gas exists in the TGA chamber from previous step. Therefore partial pressure of CO2
does not reach the feed gas partial pressure immediately. In order to consider this effect
in the modeling, the mass balance equation for TGA chamber was taken into account
which is shown in equation 24:
dt dq V P P RT A K dt dP RT
V CO t
s s CO CO CO
CO * ,
* * 2 2 2 2
2 ( ) (24)
In this equation, *
2
CO
P is the partial pressure of CO2 in the gas that is in contact
with the sorbent. V* is the volume of the chamber,
2
CO
K is the mass transfer coefficient of
CO2, A is the area, PCO2is the partial pressure of CO2 in feed gas, s is the adsorbent
density, Vs is the adsorbent volume, qCO2,t is the total loading, t is time, T is the
temperature and R is the universal gas constant. For simplification, equation 24 was
rearranged and constants were combined in 2 new constants; shown in equations 25-27.
In all previously described models, P should be substituted by *
2
CO P .
2
CO
P is equal to
CO2’s partial pressure in adsorption step and is equal to zero in desorption step. “TGA
effect” affects both adsorption and desorption, however is more pronounced in adsorption
because at a given temperature the initial adsorption rate is relative to pressure of CO2.
Figure 1.1 shows this effect on the results of fitting model III of adsorption in the first
cycle at 14.5 vol. % CO2 and four temperatures. Started from the same time, the model
without “TGA effect” does not capture the data during the first 2-3 minutes of adsorption.
dt dq T K P P K dt
dP CO t
q CO CO p
CO * ,
2 *
2 2
2 ( ) (25)
*
2
V A K
KP CO (26)
* V V R K s s
q (27)
In the proposed models (eq. 1-12 and table 1.1), since adsorption is involved in
forward reactions, the activation energies of forward reaction constants (Ek,f) were
allowed to take negative values 40, 41 while other activation energies were forced to be
positive. Parameters were obtained by fitting the experimental data (first two cycles) at
40, 60, 80 and 100°C and at 1.2, 4.8, 14.5, 56.1 and 88.6 vol. % CO2 in Nitrogen by using
least-squares method using MS Excel Solver. The values for these parameters for all
models are shown in table 1.2. The same parameters were then used to predict the
following cycles (3rd and 4th cycles) and also the cycling data at 32.8 and 69.8 vol. %, to
evaluate the interpolation and extrapolation capabilities of each model. Goodness of fit of
each model was evaluated by considering the following criteria:
Coefficient of determination (R2)
Visual examination of the fitted curves; capability of capturing kinetic features at
both low and high temperatures for all 4 cycles.
Model predictions for working capacity.
Model predictions for equilibrium loadings at 80 and 100oC.
expected to be negative. However HCO2,5is positive which cannot be physically true. Hence from now on predictions of model V is not included in the results shown in this
work. For other models, obtained values are not far from the values reported in the
literature (42.7, 11 50.03,3 63.2,11 67, 42 and 94 (8)14 (kJ.mol-1)) for adsorption of CO2 on
solid amines and not that different from heat of reactions for different amine types and
CO2 that have been reported by Kohl A. et al. cited by Satyapal et al.14; primary amines:
84 (kJ.mol-1), secondary amines: 72 (kJ.mol-1) and tertiary amines: 48 (kJ.mol-1).
However it should be noted that numbers reported here are not the same as the number
Ebner et al. reported for the same material.3 This inconsistency can be due to the fact that
in their work, only equilibrium data at 80 and 100oC were used to determine the heat of
adsorption. Also they assumed the total number of sites to be constant.
For each condition, R2 (coefficient of determination) was calculated using
equation 28. In this equation qi, exp is the experimental value for CO2 loading at time t,
mod , i
q is model value for CO2 loading at time t and qexp is mean of experimental CO2
loading over four cycles. Calculated values are shown in tables 1.4 for those conditions
that were included in fitting process and in table 1.5 for those which were not (32.8 and
69.8 vol. % CO2 in Nitrogen). Also for each condition, the best model which had the
maximum R2 is displayed.
2 exp ,exp
2 mod , ,exp 2
) (
) (
1
q q
q q R
i i i
(28)
Based on the values of R2, all models were able to capture the experimental
60°C lowest R2 values belonged to model I which clearly means that more than one
reaction was needed to model the adsorption and desorption of CO2 at this temperature.
At 40°C model III had significant higher values of R2 for most of the conditions
indicating that three parallel reactions represented the kinetic data better than models with
two reactions in parallel or two reactions in series. Accounting for all 28 conditions
model III provided the best fitting for 71% of the conditions studied. However value of
R2 alone is not an indicator of goodness of fit of a model. Features of the predicted model
have to be evaluated as well.
No significant differences were observed in visual examination of the fitted
curves, at 60C and higher temperatures. Therefore to have a better comparison of the
models, only results at 40oC where the differences are more pronounced are shown.
Figures 1.2-1.6 show the results of all models (I, II, III, IV) for 1.2, 4.8, 14.5, 56.1 and
88.6 vol. % CO2 in Nitrogenrespectively. At this temperature, there are two steps in the
adsorption; a fast uptake of CO2 that occurs at the beginning and a slow uptake that takes
place after that. Although less pronounced, these two steps can be seen in desorption, too.
Figure 1.2 shows model predictions for 1.2 vol. %. Model I does not capture the
experimental data except for the initial adsorption (t<10 min). Predictions of model II and
IV are similar; both fit the data better for 2nd -4th cycles. These models predict higher
loading during the slow step of adsorption and as a result in desorption step. Model III
fits the data better than others at this pressure.
Figures 1.3 and 1.4 show that for 4.8 and 14.5 vol. % CO2 in Nitrogen, model I
does not capture the features of adsorption and desorption at all. At 4.8 vol. % shown in
the loading in desorption. For 14.5 vol % model II provides a better fit for adsorption
compared to model IV, however neither of these models capture the curvature of the
desorption curve; indicating that two reactions either in parallel or series cannot represent
the adsorption and desorption of CO2 at these conditions. On the other hand model III fits
both fast and slow steps of adsorption as well as predicting the curvature of the
desorption curve.
In figures 1.5 and 1.6, similar to figures 1.2 and 1.3 results of model I are far from
experimental results. Unlike experiments, models II and IV show three steps of
adsorption: a fast uptake followed by two consecutive slow uptakes. The third step
becomes flat for model II at 88.6 vol. % (figure 1.6). None of these models fit the
desorption curve. Model III under predicts the loading at the end of desorption at 88.6%,
however it’s the only model that captures all the experimental features. Results at these
concentrations confirm the previous conclusion that two reactions either in series or in
parallel cannot represent the experiments at this temperature making model III the best
mechanism for adsorption and desorption of CO2.
Figure 1.7 shows the model results for 32.8 and 69.8 vol. % CO2 in Nitrogen.
Trends are similar to other concentrations that are discussed above. Considering all
concentrations, model III is the best model of four models studied here that represents the
adsorption and desorption of CO2 on CARiACT G10 solid amine sorbent at 40°C.
At other temperatures, since the results from all models were almost similar, only
results of model III are shown here (Figures 1.8-1.11). Except for 1.2 vol. % CO2 in
Periodic state working capacity for each condition was calculated by subtracting
the loading at the end of desorption from the loading at the end of adsorption in the 4th
cycle. It was assumed that 4th cycle represented the periodic state behavior. Model
predictions along with experimental working capacities are shown in figure 1.12 for
models I-IV. It is clear from figure 1.12-a, that at 40°C model I provides the best fit
(R2=0.9040). However it was shown earlier that this model did not capture the kinetic
features at 40°C. Model II (R2=0.7301) and III (R2=0.7981) fit the data up to 69.8 vol. %;
at higher concentrations they predict higher working capacities. Model IV (R2=0.5012)
over predicts the working capacity at concentrations higher than 32.8 vol. %. At 60°C,
models II, III, and IV, fit the data for concentrations lower than 56.1 vol. % and over
predict the working capacities at concentrations higher than 56.1 vol. %. R2 values at this
temperature are 0.9286, 0.9673, and 0.9470 for model II, III and IV respectively. On
contrary model I over predicts the working capacity at lower concentrations for
concentrations lower than 56.1 vol. % and fits the working capacities at concentrations
higher than 56.1 vol. % (R2=0.8827). At 80 and 100°C, displayed in figure c and d, all
models could predict the working capacities (R2≥0.99).
All the models were able to predict the equilibrium loadings at 80 and 100oC.
Coefficients of determination for each model at these conditions are shown in table 1.6.
Since the models overlapped at these conditions, experimental and predicted equilibrium
loadings are only shown for model III in figure 13.
At higher temperatures no significant differences were seen between the proposed
models. But at lower temperatures model III was able to capture the kinetic features
well as equilibrium loadings at higher temperatures. Since this model is able to fit both
kinetic and equilibrium data at a wide range of conditions, it can be used in PSA
simulators. However consistency of the model with real reaction/adsorption mechanism
and the physical structure of each species need more investigation via material
characteristics methods.
1.6 Conclusions
Five semi-empirical, temperature-dependent kinetic models were studied to
describe the reversible adsorption of CO2 in CARiACT® G10 solid amine sorbent over a
wide range of conditions: 4 temperatures (40, 60, 80 and 100°C) and 7 concentrations of
CO2 (1.2, 4.8, 14.5, 32.8, 56.1, 69.8, 88.6 vol. %). The experimental data were obtained
by measuring the dynamic adsorption-desorption of CO2 in the solid amine sorbent using
a Perkin-Elmer TGA-7 thermogravimetric analyzer. Each run is four cycles of 40 min
adsorption in CO2/CO2-Nitrogen mixture and 40 min desorption in Nitrogen.
The model constants were determined by fitting the model to first two
experimental cycles of 40 minutes adsorption followed by 40 minutes desorption data at
40, 60, 80 and 100°C and different CO2 concentrations (1.2, 4.8, 14.5, 56.1 and 88.6 vol.
%).
Using the parameters obtained by fitting the first two cycles, the model predicted
the cycling behavior for different CO2 concentrations in the adsorption step (1.2, 4.8,
14.5, 56.1 and 88.6 vol. %) at four temperatures (40, 60, 80 and 100oC) successfully. It
also predicted the cycling behavior for other CO2 concentrations (32.8 and 69.8 vol. %) at
parameters. Model III was able to predict the working capacities as well as equilibrium
loadings.
Goodness of fit of models were evaluated and compared based on predicted
features for both adsorption and desorption, values of coefficient of determination, and
capability of fitting working capacities at all conditions and equilibrium loading at higher
temperatures. Differences between the models were more pronounced at lower
temperatures. Model III that is consisted of three parallel reactions provided the best
fitting for most of the conditions.
In general, the proposed semi-empirical model was able to predict the cycling
adsorption-desorption behavior of CO2 on CARiACT® G10 solid amine sorbent
satisfactorily over a wide range of CO2 concentrations (1.2-88.6 vol. %) and temperatures
(40-100°C). Therefore it can be used in dynamic adsorption process simulator to
1.7 Tables
Table 1.1 Adsorption/Reaction sites for models I-V
Model I II III IV V
Table 1.2 Model parameters for models I-V
Parameter I II III IV V
Kp(min-1) 1.06 7.92×10⁻¹ 7.94×10⁻¹ 8.45×10⁻¹ 8.35×10⁻¹
Kq(kg.kPa.K-1.mol-1) 2.22×10⁻⁹ 3.39×10⁻³ 2.59×10⁻³ 3.45×10⁻³ 3.58×10⁻³
K1f0(kPa-1.min-1) 3.24×10⁻³ 1.18×10⁻³ 1.55×10⁻² - 7.42×10⁻⁹
E1f(kJ.mol-1) -8.32 -1.29×10⁻¹ -3.68×10⁻¹ - -3.19×101
K1b0(min-1) 1.46×10⁸ 5.92×10⁹ 7.43×10² - 2.88×10⁸
E1b(kJ.mol-1) 6.13×101 7.15×101 2.31×101 - 6.12×101
K2f0(kPa-1.min-1) - 1.14×10⁻¹ 1.75×10⁻² - -
E2f(kJ.mol-1) - 1.19×101 8.71 - -
K2b0(min-1) - 2.48×10⁸ 2.01×10¹¹ - -
E2b(kJ.mol-1) - 5.92×101 7.93×101 - -
K3f0(kPa-1.min-1) - - 9.48×10⁻⁴ - -
E3f(kJ.mol-1) - - -1.39×101 - -
K3b0(min-1) - - 5.17×10¹⁰ - -
E3b(kJ.mol-1) - - 7.80×101 - -
K4f0(kPa-1.min-1) - - - 8.99×10⁻⁴ 7.76×10⁻⁴
E4f(kJ.mol-1) - - - -1.36×101 -1.42×101
K4b0(min-1) - - - 4.04×10⁹ 4.47×10⁹
E4b(kJ.mol-1) - - - 7.05×101 7.07×101
K5f0(kPa-1.min-1) - - - 1.53 3.52×10⁻³
E5f(kJ.mol-1) - - - 2.19×101 3.87
K5b0(min-1) - - - 5.09×10⁷ 7.40×10⁻¹
E5b(kJ.mol-1) - - - 5.42×101 3.59×10-5
Nmax 2.80 3.98 3.79 2.78 3.46
5.07×10⁻² 3.26×10⁻² 3.12×10⁻² 2.99×10⁻² 4.40×10⁻² 2.88×10² 2.91×10² 2.85×10² 2.87×10² 2.94×10²+
02 1.00 6.97×10⁻¹ 1.51×10⁻¹ 0.00 2.52×10⁻¹ 0.00 3.03×10⁻¹ 2.05×10⁻¹ 0.00 0.00
0.00 0.00 6.44E×10
-1 0.00 0.00
Table 1.3 Heat of adsorption/reaction for models I-V
Parameter I II III IV V
1 ,
2
CO
H
(kJ.mol-1) -69.67 -84.36 -23.47 - -93.06
2 ,
2
CO
H
(kJ.mol-1) - -47.34 -70.63 - -
3 ,
2
CO
H
(kJ.mol-1) - - -91.92 - -
4 ,
2
CO
H
(kJ.mol-1) - - - -84.09 -84.92
5 ,
2
CO
H
Table 1.4 R2 values for models I-IV for four cycles at 40, 60, 80 and 100oC for
1.2, 4.8, 14.5, 56.1 and 88.9 vol. % CO2 in Nitrogen.
vol.% CO2 in Nitrogen I II III IV Max. R2 Best Mod.
40°C
1.2 0.6086 0.9387 0.9659 0.9183 0.9659 III 4.8 0.1369 0.9487 0.9835 0.9538 0.9835 III 14.5 0.8969 0.9493 0.9883 0.8590 0.9883 III 56.1 0.6726 0.9504 0.9622 0.9234 0.9622 III 88.9 0.4519 0.7728 0.8792 0.7442 0.8792 III 60°C
1.2 0.8551 0.9157 0.8940 0.9131 0.9157 II 4.8 0.9091 0.9781 0.9839 0.9813 0.9839 III 14.5 0.9249 0.9813 0.9883 0.9814 0.9883 III 56.1 0.9130 0.9285 0.9318 0.9257 0.9318 III 88.9 0.9528 0.9611 0.9681 0.9613 0.9681 III 80°C
1.2 0.9462 0.9876 0.9888 0.9878 0.9888 III 4.8 0.9835 0.9836 0.9887 0.9845 0.9887 III 14.5 0.9943 0.9987 0.9985 0.9990 0.9990 IV 56.1 0.9953 0.9951 0.9952 0.9952 0.9953 I 88.9 0.9959 0.9981 0.9981 0.9983 0.9983 IV 100°C
Table 1.5 R2 values for models I-IV for four cycles at 40, 60, 80 and 100oC for
32.8 and 69.8 vol. % CO2 in Nitrogen.
vol.% CO2 in Nitrogen I II III IV Max. R2 Best Mod
40°C
32.8 0.8245 0.9176 0.9671 0.7958 0.9671 III 69.8 0.4527 0.6594 0.8014 0.6064 0.8014 III
60°C
32.8 0.9765 0.9914 0.9915 0.9908 0.9915 III 69.8 0.9841 0.9882 0.9915 0.9910 0.9915 III
80°C
32.8 0.9976 0.9966 0.9963 0.9956 0.9976 I 69.8 0.9960 0.9964 0.9966 0.9966 0.9966 III, IV
100°C
Table 1.6 R2 values for equilibrium loadings
predicted by models I-IV at 80 and 100oC.
Model 80°C 100°C
I 0.9905 0.9978
II 0.9964 0.9979
III 0.9984 0.9981
IV 0.9968 0.9980
1.7 Figures
Figure 1.1 Model III predictions (solid line) vs. experimental data (dotted line)
with and without TGA effect for 14.5 vol. % CO2 in Nitrogenat a) 100oC, b) 80oC,
c) 60oC, d) 40oC
0 5 10 15 20
-0.5 0.0 0.5 1.0 1.5 2.0 2.5 3.0
Lo
ading
(m
ol/k
g)
Experimnetal With TGA effect Without TGA effect
a)
0 5 10 15 20
Time(min) d)
-0.5 0.0 0.5 1.0 1.5 2.0 2.5 3.0
0 5 10 15 20
Lo
ading
(m
ol/k
g)
Figure 1.2 Model I-IV predictions (solid line) vs. experimental data (dotted line) at
40oC for 1.2 vol. % CO2 in Nitrogen
II
0 40 80 120 160 200 240 280 320 Time(min)
IV
-0.5 0.0 0.5 1.0 1.5 2.0 2.5 3.0
Lo
ading
(m
ol/k
g)
I
-0.5 0.0 0.5 1.0 1.5 2.0 2.5 3.0
0 40 80 120 160 200 240 280 320
Lo
ading
(m
ol/k
g)
Time(min)
Figure 1.3 Model I-IV predictions (solid line) vs. experimental data (dotted line) at
40oC for 4.8 vol. % CO2 in Nitrogen
II
0 40 80 120 160 200 240 280 320 Time(min)
IV
-0.5 0.0 0.5 1.0 1.5 2.0 2.5 3.0
Lo
ading
(m
ol/k
g)
I
-0.5 0.0 0.5 1.0 1.5 2.0 2.5 3.0
0 40 80 120 160 200 240 280 320
Lo
ading
(m
ol/k
g)
Time(min)
Figure 1.4 Model I-IV predictions (solid line) vs. experimental data (dotted line) at
40oC for 14.5 vol. % CO2 in N2
II
0 40 80 120 160 200 240 280 320 Time(min)
IV
-0.5 0.0 0.5 1.0 1.5 2.0 2.5 3.0
0 40 80 120 160 200 240 280 320
Lo
ading
(m
ol/k
g)
I
-0.5 0.0 0.5 1.0 1.5 2.0 2.5 3.0
0 40 80 120 160 200 240 280 320
Lo
ading
(m
ol/k
g)
Time(min)
Figure 1.5 Model I-IV predictions (solid line) vs. experimental data (dotted line) at
40oC for 56.1 vol. % CO2 in Nitrogen
II
0 40 80 120 160 200 240 280 320 Time(min)
IV
-0.5 0.0 0.5 1.0 1.5 2.0 2.5 3.0
Lo
ading
(m
ol/k
g)
I
-0.5 0.0 0.5 1.0 1.5 2.0 2.5 3.0
0 40 80 120 160 200 240 280 320
Lo
ading
(m
ol/k
g)
Time(min)
Figure 1.6 Model I-IV predictions (solid line) vs. experimental data (dotted line) at
40oC for 88.6 vol. % CO2 in Nitrogen
II
0 40 80 120 160 200 240 280 320 Time(min)
IV
-0.5 0.0 0.5 1.0 1.5 2.0 2.5 3.0
L
oa
ding
(m
ol/k
g)
I
-0.5 0.0 0.5 1.0 1.5 2.0 2.5 3.0
0 40 80 120 160 200 240 280 320
L
oa
ding
(m
ol/k
g)
Time(min)