ATLAS W path – real data from the LHC for high school
students
Uta Bilow1a,, Constanze Hasterok1, Konrad Jende2, Michael Kobel1, Christian Rudolph1, Julia Woithe1,2
1
Institute of Nuclear and Particle Physics, TU Dresden, 01062 Dresden, Germany
2
CERN, Postbox C09600, 1211 Geneva 23, Switzerland
Abstract. ATLAS W path is an educational scenario developed for high school students. They are introduced to basic concepts of particle identification and event classification. Students work with event displays from experimental data taken at the ATLAS detector. A dataset with 6000 real events has been made available. Measurement tasks include identifying particles to reveal the inner structure of the proton and to find the signature of the Higgs boson. ATLAS W path is widely used in International Masterclasses as well as in other educational scenarios.
1 The W boson enters the stage
The educational scenario ATLAS W path [1] has been developed for the use in International Masterclasses [2,3], an outreach program for high school students, where students spend a whole day at a nearby university or research institute to get in touch with particle physics. After introductory lectures to particle physics they are enabled to perform a measurement with real data from a particle physics experiment. International Masterclasses are organized in 37 countries worldwide, and in 2013 a total of 45 universities or research institutes from 18 different countries chose this measurement for their Masterclasses. The program is available via the website of International Masterclasses and free to use for any educational purpose.
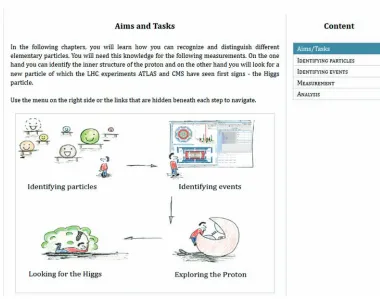
The measurement is named after its main actor, the W boson. W bosons are produced in collisions between protons at the Large Hadron Collider (LHC) at CERN, Geneva [4]. The ATLAS detector registers products of these collisions. The electronic signals are transformed and visualised with the event display MINERVA [5]. Students learn to recognize and distinguish various elementary particles in these event displays and use their newly acquired knowledge to face two challenges, see Figure 1: First, they can determine the inner structure of the proton. The results show students that they are able to confirm with their own measurements established knowledge about the structure of matter.Secondly, students can search for a new particle, a Higgs boson. The long search for this elusive boson was one of the main reasons for constructing the LHC, and its discovery, which was announced in 2012 by the LHC experiments ATLAS and CMS, resulted in awarding the Nobel Prize in Physics 2013 to its grounding fathers Peter Higgs and François Englert. In this way, students can follow as closely as possible what scientists are doing.
a
Corresponding author: [email protected]
DOI: 10.1051/
C
Owned by the authors, published by EDP Sciences, 2014 /2 01
epjconf 4 7100018
A pre-selected data set with 6000 events has been made available for ATLAS W path. It includes 1770 candidate events for the production of a W boson, 693 candidates for the production of a WW pair, and 3537 background events. The data set is divided into 120 data samples with 50 events each. Participants work in pairs and are assigned to one sample.
Figure 1. ATLAS W path. Webpage with aims and tasks
ATLAS W path is a web-browser based program. It has been translated into ten languages in order to reduce the language barriers for high school students.
2 Preparation for the measurement
A six-step procedure is used to prepare students for their measurement tasks. First, they are trained to identify particles. In an applet [6] they can discover how elementary particles can be recognized with the ATLAS detector. By choosing a particular particle one can follow the way of the particle throughout the whole detector and see the resulting tracks and energy depositions (Figure 2).
In a second step participants are introduced to the event display MINERVA and its features. MINERVA shows different views of the detector and includes a graphical user interface, where functions as “zoom” or “pick” can be chosen, cuts can be adjusted, or additional information of tracks can be accessed.
Then, they learn how different objects – electrons, muons, neutrinos, and jets – appear in the detector and how they can be distinguished. The next step, an exercise, is designed to let students check their newly acquired knowledge. They are given four event displays with increasing difficulty – starting with a single electron – and have to identify the particles in these event displays.
Figure 2.Applet for visualisation of particles in the ATLAS detector. Here, a jet is visible.
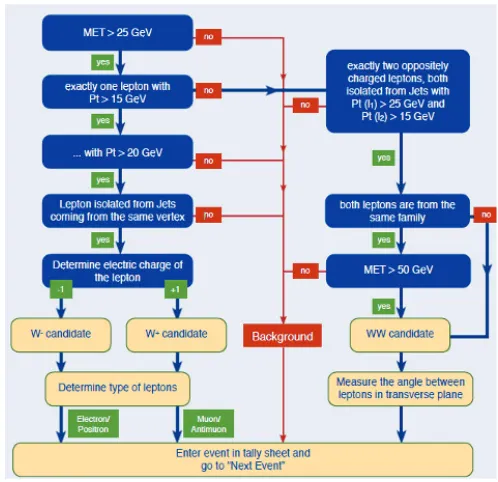
In the next step students are introduced to a more complex task, to the event identification. They learn about the W boson, how it is produced at the LHC and a few of its decay scenarios (Figure 3). For the measurement tasks students are trained to tell relevant signal events, which contain true decay products of a W boson, from background events, where no W boson was produced. A decision tree (Figure 4) helps students to accumulate signal and suppress background events.
Figure 3. Feynman graphs illustrating the decay of W bosons into leptons and neutrinos
Figure 4. Decision tree for ATLAS W path analysis
3 Data analysis
Each pair of students analyses 50 events. Based on the decision tree they distinguish W and WW candidate events from background events. In case of a W candidate they determine its electric charge. With the help of a tally sheet particle counts are used to determine the W+/W- ratio of their respective abundance. In case of a WW candidate students measure the angle between the electrically charged leptons in transverse plane.
Participants enter their results – number of positively or negatively charged W bosons as well as the number of WW candidates and the measured angles leptons and angles – in an online spreadsheet, which allows participants to combine their results on both local institute’s and global day level. The latter one is used for the video conference of International Masterclasses, where up to five student groups from different institutes and possibly different countries are connected, having all performed the same measurement, but with different data samples.
4 Students´ Results
Students´ findings of W+/W- ratios during International Masterclasses 2013 are displayed in Figure 5. During a Masterclass, they are compared with the official result of the ATLAS collaboration [7] followed by intensive discussions. Students are asked for their expectations and possible explanations for deviating results. Taking into account only the valence quarks inside the proton as source for radiated W bosons, they expect a W+/W- ratio of 2. The ratio measured by the ATLAS collaboration and by themselves is lower, because a so-called "sea" of quark-antiquark pairs, produced by gluons inside the proton (Figure 6, lower row) also contributes to their production. Thus they see that the ATLAS data is an excellent probe of the proton structure.
Figure 5. Results from International Masterclasses 2013. W+/W- ratios from 58 Masterclasses
Figure 7. Histogram of the students´ measurement for the opening angle between the two leptons in WW candidate events from the International Masterclasses 2013. The green histogram is the expectation for background events which only look like WW, but aren’t, e.g. single W events with a fake second lepton or Di-Lepton events from Z decays with fake missing transverse momentum mimicking a neutrino. The blue histogram is the expectation for real WW-pair events without Higgs. The Higgs signal (red) accumulates at small angles.
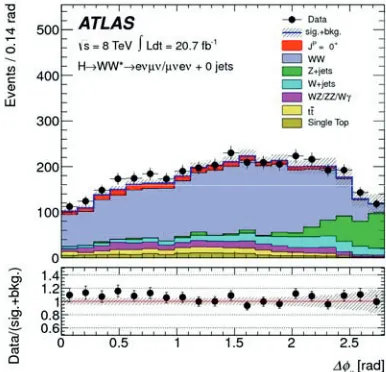
Figure 8. ATLAS plot showing the same distributions with a 20 times larger data sample. Again the blue histogram is the expectation for real WW-pair events without Higgs. The coloured histograms at the bottom are various classes of background events, with their sum corresponding to the green histogram in the Masterclass measurement. The Higgs signal (red) accumulates at small angles and is more clearly visible.
As it can be seen from the ATLAS plot, the overall distribution is background-dominated. A possible Higgs signal would accumulate at small angles. This contribution can also be seen in the students´ histogram. At the same time, they understand that much more statistics is needed to clearly prove a Higgs contribution.
5 Evaluation of students´ results
During International Masterclasses 2013 on average a W+/W- ratio of 1.25 (Figure 5) was measured. A master’s thesis [9] evaluated the ATLAS W path, leading to the result that only 44 % of the WW candidates have been found by the students. The evaluation indicates that 121 of the 693 WW events (17 %) cannot be recognized if one uses the recommended selection criteria. This is due to different data formats used in the pre-selection and in MINERVA. Consequently, the recommended criteria have been adapted. Furthermore, frequent causes for misidentification have been identified and will be taken into account in an update for 2014. Subsequently the misidentification of WW candidates biases the W+/W- ratio and results in a value lower than 1.5. As the evaluation has shown, students´ results strongly depend on the realization of the exercises before the measurement. Thus improving the preparation of the students will lead to a better W+/W- ratio as well as to a better quota of identified WW candidates.
References
1. http://atlas.physicsmasterclasses.org/en/wpath.htm 2. www.physicsmasterclasses.org
3. U. Bilow, M. Kobel, EPJ Web of Conferences 31 (2012) 01002
4. M. K. Bugge, E. Gramstad, V. Morisbak, F. Ould-Saada, M. Pedersen, S. H. Raddum, EPJ Web of Conferences 31 (2012) 01002
5. http://atlas-minerva.web.cern.ch/atlas-minerva/
6. http://atlas.physicsmasterclasses.org/en/wpath_teilchenid1.htm
7. ATLAS Collaboration, Measurement of the inclusive W+/- and Z/ѽ cross sections in the e and decay channels in pp collisions at s = 7 TeV with the ATLAS detector,
http://arxiv.org/pdf/1109.5141v3.pdf (2011)
8. ATLAS Collaboration, Evidence for the spin-0 nature of the Higgs boson using ATLAS data, Phys. Lett. B 726, 120 (2013)