Article
1
Study of the influence of TiB content and temperature
2in the properties of in situ titanium matrix composites
3Cristina Arévalo1, Isabel Montealegre-Melendez1,*, Eva M. Pérez-Soriano1, Enrique Ariza2,Michael 4
Kitzmantel2 and Erich Neubauer2 5
1 Department of Engineering and Materials Science and Transportation, School of Engineering, University of 6
Seville, Camino de los Descubrimientos s/n, 41092, Seville, Spain; [email protected] (I.M.); [email protected] 7
(E.M.P.-S.) 8
2 RHP-Technology GmbH, Forschungs- und Technologiezentrum, 2444 Seibersdorf, Austria; 9
[email protected] (E.A.); [email protected] (M.K.); erich.neubauer@rhp-10
technology.com (E.N.); 11
* Correspondence: [email protected] (C.A.); Tel.: +34-954-482-278 12
13 14
Abstract: This work focuses on the study of the microstructure, hardening and stiffening effect 15
caused by the secondary phases formed in titanium matrices. These secondary phases were 16
originated from reactions between the matrix and boron particles added in the starting mixtures of 17
the composites. Not only was the composite composition studied as an influencing factor in the 18
behaviour of the composites, but also different operational temperatures. Three volume percentages 19
of boron content were tested (0.9, 2.5 and 5 vol % of amorphous boron). The manufacturing process 20
used to produce the composites was inductive hot pressing, which operational temperatures were 21
between 1000 °C to 1300 °C. Specimens showed optimal densification. Moreover, microstructural 22
study revealed the formation of TiB in various shapes and proportions. Mechanical testing confirmed 23
that the secondary phases had a positive influence on the properties of the composites. In general, 24
adding boron particles increased the hardness and stiffness of the composites; however rising 25
temperatures resulted in greater increases in stiffness than in hardness. 26
Keywords: in situ Titanium composites, microstructure analysis, TiB precipitates 27
28
1. Introduction 29
Over the last few decades, titanium matrix composites (TMCs) have been considered as valuable 30
materials for diverse applications in the aerospace industry. The sector demands materials that can 31
achieve high specific stiffness in addition to possessing good thermal stability at high operational 32
temperature, such as TMCs [1, 2]. Regarding the diverse methods used to develop these materials, 33
synthesizing in situ is currently considered one of the best techniques due to the excellent properties of 34
the produced materials. The main advantage of these kinds of composites lies in the stable interface 35
formed between the matrix and the reinforcing phase [3]. The high reactivity of the titanium with 36
several ceramic compounds provides a wide range of options for selecting the elemental materials to 37
manufacture in situ TMCs [4-9]. Among the diverse materials that could act as reactive compounds 38
with titanium, boron (B) has been considered as a suitable candidate to start in situ secondary 39
reinforcing phases. Many recent works have presented this non-metallic element as an ideal reactive to 40
promote the formation of TiB and TiB2. The significance of these borides as reinforcements is based on
41
the fact that they are chemically compatible with the matrix, in addition to having similar densities 42
and thermal expansion coefficients [10-12]. 43
With regards to TMC manufacturing processes, powder metallurgy (PM) has been shown in 44
many studies to be the most suitable when compared to traditional processes [2]. PM technologies 45
overcome certain problems of conventional processes: wettability between the matrix and the ceramic 46
reinforcements, and long and complex processing steps [13]. In particular, inductive hot processing 47
(iHP) technology is valued for TMCs manufacturing due to its short operational time. The use of this 48
technique has facilitated the investigation of TMCs’ properties and the secondary phases formed at 49
different processing temperatures [14, 15]. Despite the advantages of this process, the restrictions of 50
the specimens’ size (diameters of 20 mm) limit the measurement of tensile and bending properties of 51
the final specimens. For that reason, in this work, in addition to the iHP process, Direct Hot Pressing 52
(dHP) technology has been employed. 53
The scope of this research is the study and evaluation of the relationship between the 54
compositions of determinate TMCs, their processing conditions and their final properties. 55
2. Materials and experimental procedures 56
The starting materials were commercial Ti powders grade 1 and amorphous B particles, 57
manufactured by TLS GmbH (Germany) and ABCR GmbH & Co. KG (Germany) respectively. The 58
characterisation of both powders was performed to verify the information about their size and 59
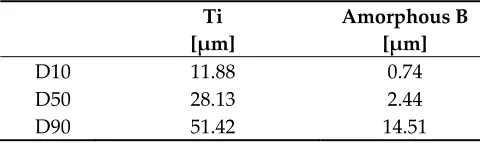
morphology supplied by the manufacturers. The particle size distribution of the starting powders was 60
determined by laser diffraction analysis (Mastersizer 2000). The average particle size of the titanium 61
and amorphous boron powders are listed in Table 1. 62
Table 1. Particle size distributions of the starting powders. 63
Ti [µm]
Amorphous B [µm]
D10 11.88 0.74
D50 28.13 2.44
D90 51.42 14.51
64
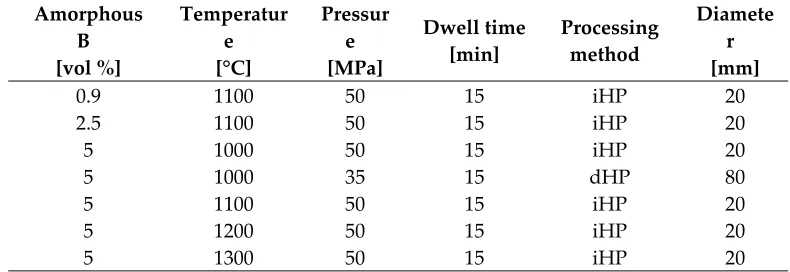
Before the hot consolidation of the composites, the blends of the powders were prepared. The 65
tested compositions and their operational parameters are shown in Table 2. The titanium powder and 66
each different volume percentage (vol %) of the amorphous B particles were mixed by tubular 67
machine (Sintrix) for 16 hours with ceramic balls (ZrO2) of 3 mm diameter. The weight ratio of ceramic
68
balls to powder was 10:1. Moreover, the use of hexane helped towards the distribution of the fine 69
particles of amorphous B in the metallic matrix. The powder mixture was dried and subsequently 70
blended a second time for several minutes without the ceramic balls, to avoid possible agglomerations. 71
This was the same blending procedure used for producing composites as in previous authors’ works 72
[15, 16]. Then, the target composition of three different powder mixtures was made from titanium and 73
0.9 vol %, 2.5 vol % and 5 vol % of B particles. With these compositions the predesigned values of TiB 74
are 2.65 vol %, 7.42 vol % and 15.02 vol % respectively. These values were calculated based on the 75
theoretical densities: i) 4.51 g/cm3 for titanium, ii) 4.56 g/cm3 for TiB, and iii) 2.46 g/cm3 for boron [1].
76
Subsequently, the hot and rapid consolidation of the specimens was carried out. Two machines 77
were employed to manufacture the specimens. The first was a self-made hot pressing machine, 78
inductive Hot Pressing (iHP) equipment made by RHP-Technology GmbH & Co. KG. Its main 79
advantage is its high heating rate due to its special inductive heating set-up. The die used for all the 80
iHP cycles was made from graphite (punch Ø 20 mm). It was lined with thin paper with a protective 81
coating of boron nitride (BN) for each iHP cycle. Six specimens were consolidated by this iHP method 82
(see Table 2). The second machine was used to fabricate specimens with suitable dimensions in order 83
to measure their mechanical properties. Assuming the composite with low properties and TiB 84
precipitates formation (5 vol % B at 1000 °C), a second rapid hot pressing machine (direct hot pressing 85
dHP with larger die (Ø 80 mm)) was also used in order to measure mechanical properties. 86
Table 2. Composition and processing parameters for the manufacturing of TMCs. 88
Amorphous B [vol %]
Temperatur e [°C]
Pressur e [MPa]
Dwell time [min]
Processing method
Diamete r [mm]
0.9 1100 50 15 iHP 20
2.5 1100 50 15 iHP 20
5 1000 50 15 iHP 20
5 1000 35 15 dHP 80
5 1100 50 15 iHP 20
5 1200 50 15 iHP 20
5 1300 50 15 iHP 20
* inductive Hot Pressing (iHP) and direct Hot Pressing (dHP)
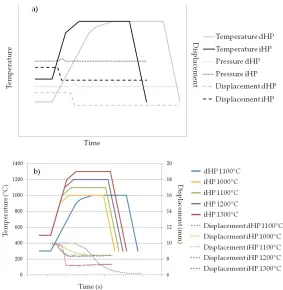
Regarding the operational parameters, Figure 1 shows the evolution of cycle’s parameters for 89
each of the composites’ manufacturing runs in terms of temperature, pressure and displacement of the 90
punches (uniaxial press). Figure 1 a) relates to the representative cycle in each of the hot pressing 91
machines. For dHP, the starting pressure and the heating rate are lower than in iHP due to 92
requirements of this technique. 93
The graphs shown in Figure 1 b) are drawn in a quantitative way in order to compare all the run 94
cycles across both iHP and dHP equipments. As it is appreciated, the temperature versus time is 95
represented in addition to the punch displacement versus time. In all the cycles, the holding time (15 96
min) and the vacuum conditions (10-5 bar) were fixed. In particular for the iHP runs, the consolidation
97
temperature was varied: 1000 °C, 1100 °C, 1200 °C and 1300 °C (see in Figure 1 b)). These values of 98
temperature were employed to investigate the effect of 100 °C increments in the microstructure and 99
properties of specimens made from same starting powder composition. In case of the specimen 100
fabricated by dHP, the operational conditions were similar than the iHP ones; however, only an 101
operational temperature of 1000 °C was set. This value was fixed according to a previous authors’ 102
work in which an interesting microstructure phenomenon took place at this temperature in TMCs at 103
similar conditions, but made from different raw materials [15]. 104
Once the iHP and dHP cycles were finished, the samples with 20 mm and 80 mm of diameter 105
were taken out from the respective dies and cleaned by a sand blasting machine to remove the 106
graphite paper remains from the surfaces. Then, the characterization of all the specimens was 107
performed. Firstly, metallographic preparation of all the specimens was carried out carefully to study 108
the newly-formed phases and the microstructure of the TMCs. Then, X-ray diffraction (XRD) 109
equipment (Brunker D8 Advance A25) was employed to identify the diverse crystalline phases in the 110
composites. The microstructure characterisation was studied by optical microscope (OM), Nikon 111
Model Epiphot 200 equipment, and by scanning electron microscope (SEM) JEOL 6460LV, integrated 112
with electron backscatter diffraction (EBSD) detector and Energy Dispersive Spectroscopy (EDS). The 113
measurements of the precipitates’ sizes were performed using the software Image-Pro Plus 6.2. 114
123
124
Figure 1. a) Graphical representation of temperature vs. time in iHP and dHP cycles; b) temperature 125
variations vs. time and shrinkage displacements vs. time for TMCs processing cycles from the same starting 126
powders. 127
128
The density of the specimens was measured by Archimedes’ method (ASTM C373-14). The results 129
were compared to the theoretical density calculated by rule of mixtures. Hardness measurements were 130
carried out on the polished cross-sections of the specimens. Eight indentations were done by a tester 131
model, Struers-Duramin A300, to ascertain the Vickers hardness (HV10). The estimation of the 132
specimens’ Young’s Modulus was made by ultrasonic method (Olympus 38 DL). It was used with a 133
pulse generator/receiver, recording the transit time (outward/return) through the thickness. This 134
technique allowed the determination of both the longitudinal (VL) and transverse (VT) propagation 135
velocities of acoustic waves. To correctly measure the propagation velocities of these waves, the 136
surface of samples must be properly grinded and polished (to create samples with smooth and parallel 137
surfaces) and the delay times of transducers minimised by following an iterative measurement 138
protocol. The Young’s Modulus was calculated from the density (g/cm3), VL and VT [17]. Tensile tests
139
were performed on a universal testing machine Instron 5505 with a strain rate of 1 mm/min. 140
Additionally, the same machine was employed to carry out the flexural tests at 5 mm/min. Both 141
properties were evaluated according to the standards UNE EN 10002-1:2002 and UNE EN ISO3325 142
respectively. 143
3. Results and discussion 144
The obtained results are presented and discussed considering the two main issues of this work: i) 145
the influence of starting powder compositions (vol % of amorphous B) at identical processing 146
conditions, ii) the effect of rising temperature (1000 °C, 1100 °C, 1200 °C and 1300 °C) for the same 147
starting powder mixture (5 vol % of amorphous B). 148
3.1. Microstructural study and XRD analysis
149
Firstly, taking into account the volume percentages (vol %) of the amorphous B particles added in 150
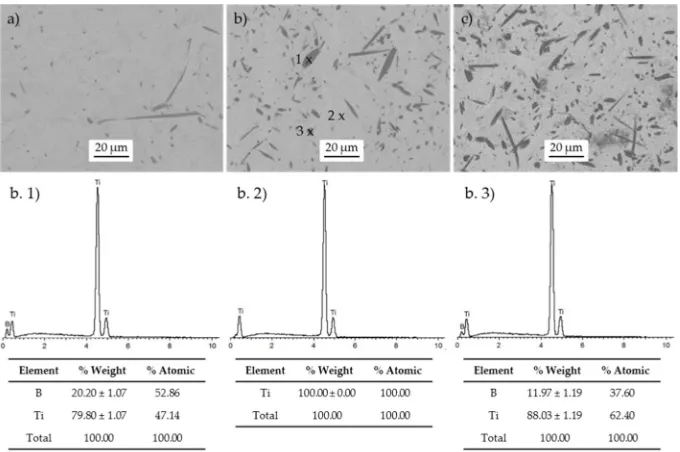
the blend, the microstructures of the specimens are compared. Figure 2 shows the SEM images of three 151
specimens fabricated at 1100 °C for 15 minutes and made from the mixtures of Ti and amorphous B
with 0.9 vol %, 2.5 vol % and 5 vol %, respectively. As it might be expected, precipitates are observed 153
in the microstructure of the specimens, since at this temperature (1100 °C) there have been reactions 154
between the matrix and the boron particles [3, 18]. As many authors have previously described, these 155
precipitates are supposed to be in situ formed TiB [15, 19] because of this reaction (see Figure 2). It is 156
important to highlight a clear evolution of the size and the volume of the precipitates related to the 157
amorphous B content (vol %). As predicted, the increment of the B content in the composites causes 158
the apparition of more borides precipitates. 159
Two different morphologies of TiB precipitates can be appreciated: whiskers and rounded 160
hexagonal shapes (Figure 2). To verify the composition of both types of precipitates, EDS analysis has 161
been performed in the marked spots in Figure 2 b). Using 0.9 vol % of B particles, the size of the round 162
precipitates is the smallest one compared to the rest of the precipitates’ size formed in TMCs, with B 163
contents of 2.5 vol % and 5 vol %. It is observed that increasing the content of B, the size of the 164
precipitates also increased. The whiskers’ lengths remain generally constant although the widths 165
increase slightly by increasing the B content. Moreover, the round hexagonal precipitates become 166
larger. In Figure 2 c) there are some darker grey areas where the B particles remain in the titanium 167
matrix without reacting. 168
169
170
Figure 2. SEM images of TMCs manufactured at 1100 °C with different content of amorphous B in their 171
starting powders: a) 0.9 vol %; b) 2.5 vol % (EDS spectra spot 1), spot 2) and spot 3)); and 5 vol %. 172
The second target parameter of the study is the processing temperature for specimens fabricated 173
from identical starting powder (5 vol % of amorphous B). There are relevant changes in the 174
microstructures of the composites caused by increasing the consolidation temperature from 1000 °C to 175
1300 °C. This phenomenon can be observed in Figure 3. The lower the temperature, the fewer the 176
number of formed precipitates. Titanium grains can be clearly recognised (see spot 2 in Figure 3 a)). 177
Additionally, there are possible agglomerations of the reinforcing phases located in these grain 178
boundaries. Regarding the reaction between Ti and B at 1000 °C, the time (15 min) and operational 179
temperature are insufficient to promote an atomic diffusion phenomenon of boron into the matrix 180
grains. EDS analysis reveals grey areas corresponding to such B particles agglomeration (see in Figure 181
3). However, only one increment of 100 °C (from 1000 °C to 1100 °C) causes the origin of TiB 182
precipitates in the matrix with the two different morphologies previously mentioned. When the 183
bigger (see Figure 3 b) and c)). In relation to the whisker morphology, the changes caused by the 185
increment of the temperature are more easily appreciated in their thickness than in their length. 186
The tendency to thicken the size of the precipitates remains constant up to 1200 °C. Comparing 187
the microstructure of Figure 3 c) and Figure 3 d), variations in size of the precipitates are not visible. In 188
both SEM images (TMCs fabricated at 1200 °C and 1300 °C) the thickness of the whiskers are larger 189
than the ones formed at 1100 °C. However, the size of the round hexagonal precipitates is a little 190
bigger than in TMCs processes at 1100 °C. 191
192
193
Figure 3. SEM images of TMCs made from starting powder with 5 vol % of amorphous B and 194
manufactured at: a) 1000 °C; b) 1100 °C; c) 1200 °C; and d) 1300 °C. 195
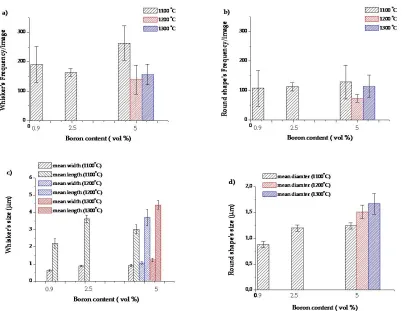
To go into detail about precipitates, a semi-quantitative study of both types of precipitates 196
(whiskers and round shapes), considering their size and frequency/image, were developed by image 197
analysis (using ten SEM images at the same magnifications for each specimen). It is important to note 198
that, in the specimens where their precipitates are located at the grain boundaries, this image analysis 199
could not be carried out. The main parameters evaluated after the image analysis are: i) mean length 200
and mean width of the whiskers, ii) maximum length and maximum width of the whiskers and iii) 201
mean and maximum diameter for the round shapes precipitates. The results of the measurements are 202
represented in Figure 4. 203
In general, there are more whisker precipitates than round shapes independently of the composite 204
compositions and processing temperature. 205
Concerning the dimensions of the whisker precipitates, the increase of the temperature and the 206
boron content in the starting blend involves an increase of both mean values (length and width). 207
Figure 4 c) shows a gradual growth in whisker size at higher temperatures and at higher volumes of 208
boron. Each increment of 100 °C drives the growth of whisker mean length size by approximately 15% 209
at the same composite composition. However, the effect of the processing temperature and the boron 210
addition is not the same in the maximum length and width of the whiskers. Despite increasing both 211
temperature and composition, a dimensional limit around 26 µm exists in their maximum length. This 212
means that there are not whiskers measured with length higher than 26 µm independently of these 213
two factors. Regarding the maximum width, it is affected only by temperature,maintains a value of 214
around 0.12 µm across different compositions 215
With respect to the round-shaped precipitates (Figure 4 d)), the higher the temperature and the 216
increment of 100 °C, from 1100 °C to 1200 °C, produces a 21% increase to the mean diameters of these 218
precipitates. 219
220
221
Figure 4. a) Whisker frequency and b) Round shape precipitate frequency vs. Boron content, c) Whiskers size 222
and d) Round shape precipitate size vs. Boron content. 223
Related to the manufacturing processes, iHP and dHP, similar microstructures of composites 224
were observed in specimens from the same starting powder in spite of their different fabrication 225
methods. This means that at the same processing conditions (1000 °C for 15 min) but in different hot 226
pressing machines, the microstructural properties are alike (see Figure 5). It could therefore be argued 227
that the results obtained could be reproduced using either machine. At 1000 °C, there is insufficient 228
diffusion time and temperature to end the boron source to form TiB. 229
The phenomenon of the agglomeration of B particles at the grain boundaries and inhomogeneous 230
microstructure was observed in both composites. 231
232
Figure 5. SEM images of TMCs made from starting powder with 5 vol % of amorphous B at 1000 °C for 233
15 min via a) iHP; b) dHP. 234
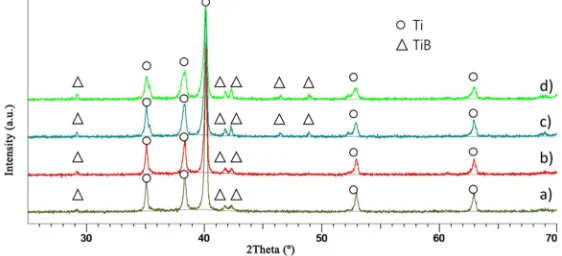
The results of XRD analyses confirm the TiB formation as a product of the reaction between the 236
matrix and the B particles. Figure 6 and Figure 7 show the XRD patterns of the composites made from 237
several starting powders (vol % of B) and processing at different temperatures, respectively. In 238
general, no recordable peaks of TiB2 are observed in all of the XRD patterns. Comparing the effect of
239
the starting powder compositions, the lower the B content is, the lower the observed peak of TiB is (see 240
Figure 6 a)). However, at the same operational conditions, increasing the vol % of B to 5 %, there are 241
sharper peaks for TiB phase (see in Figure 6 c)). The influence of temperature on the formation of the 242
TiB phase is quite clear as shown by the XRD patterns in Figure 7. It is well known that, by increasing 243
temperature, the reaction between Ti and B tends to be more complete. This can be seen clearly in 244
Figure 7. XRD peaks of TiB in composite produced at 1000 °C are slightly weaker than the ones in the 245
pattern of composite produced at 1100 °C. Moreover, there are two new weak peaks corresponding to 246
the TiB phase when the temperature increases from 1100 °C to 1200 °C. 247
However, there is not significant variation in the pattern of composites processed at 1300 °C 248
compared to specimens produced at 1200 °C. This is in agreement with the results of the
249
microstructural analysis described previously. The reason is related to the diffusion phenomena in 250
both cases being high enough (at 1200°C and 1300 °C). At these high temperatures, the content of TiB 251
could be higher if the time were to be increased. 252
253
Figure 6. XRD patterns of composites manufacture at 1100 °C for 15 min via iHP with different % vol of 254
B: a) 0.9 vol %; b) 2.5 vol %; and c) 5 vol %. 255
256
Figure 7. XRD patterns of composites manufacture with 5 vol % of B for 15 min via iHP at different 257
temperatures: a) 1000 °C; b) 1100 °C; c) 1200 °C; and d) 1300 °C. 258
259
The semi-quantitative analyses, made by Reference Intensity Ratio (RIR) method, allowed the 260
determination of TiB fractions (see Figure 8). The calculated values of TiB (vol %) are lower than the 261
theoretical values of in situ formed TiB (considering full reaction between the matrix and the B 262
The higher the B content, the greater the differences are between the in situ formed TiB at 1100 °C 264
and the TiB content calculated theoretically. Increasing the temperature from 1000°C to 1100°C leads to 265
a slight increase of the amount of TiB formed. However, when the temperatures reach 1200 °C and
266
1300 °C there are fewer differences between the in situ formed TiB and the theoretical one. 267
0 1 2 3 4 5
0,0 2,5 5,0 7,5 10,0 12,5 15,0
Ti
B (
v
ol
%
)
Boron ( vol % )
1000 ؛C 1100 ؛C 1200 ؛C 1300 ؛C Full reaction
268
Figure 8. Volume percentage of TiB formed by full reaction Ti-B vs volume percentage of Boron added as 269
starting material.
270
3. 2 Density, Hardness, Young’s Modulus and Mechanical properties
271
In general, the relative density of the TMCs reaches values of 98%. There is an improving effect in 272
the densification resulting from the increase of the processing temperature. The hardening and 273
stiffening effects induced by the TiB precipitates, in addition to the grain refinement due to the 274
reinforcement content, are two phenomena described by previous authors [13, 18]. Both phenomena 275
are also observed in the in situ TMCs fabricated from the three powder mixtures (0.9 %, 2.5 % and 5% 276
vol of Boron) and at different temperatures (1000 °C, 1100 °C, 1200 °C and 1300 °C). On one hand, as 277
shown in Figure 9 a), the higher the B content the higher the hardness and the Young’s Modulus. The 278
hardness increases by 5 % from 0.9 vol % to 2.5 vol % B content and by 32 % from 0.9 vol % to 5 vol %. 279
This is closely related to the in situ formed TiB as shown in Figure 8. Clearly, the content of the 280
reinforcement particles and secondary phases contribute to the hardening effect. The tendency of the 281
Young’s Modulus to increase is less pronounced than the hardness’ trend with values of 5% and 18% 282
respectively (see in Figure 9 a)). 283
On the other hand, the increasing the temperature also promotes the variations in the hardness 284
and Young’ Modulus due to the number of precipitates. In this case, the increase of the temperature 285
more greatly affects the enhancement of the Young’s Modulus than the hardness of the specimens. In 286
general, the values of the hardness remain around 300 HV while the Young’s modulus values present 287
increase related to the specimens processed at 1000 °C; 4 %, 10% and 25 % for 1100 °C, 1200 °C and 288
1300 °C respectively (see Figure 9 b)). Even although the microstructure seems similar in specimens 289
produced at 1200 °C and 1300 °C, the increase of stiffness could be the result of ongoing reactions in 290
1 2 3 4 5 100 150 200 250 Young's modulus Hardness
Boron content (vol %)
You n g 's modulu s (GP a) a) 100 150 200 250 300 350 Hardne ss ( H V) Young's modulus Hardness
1000 1100 1200 1300
100 150 200 250
Temperaure ( oC)
You n g's m o dul u s (G Pa) b) 100 150 200 250 300 350 Hardne ss ( H V) 292
Figure 9. Hardness and Young’s Modulus vs.: a) volume percentage of Boron (vol %), b) operational 293
temperatures. 294
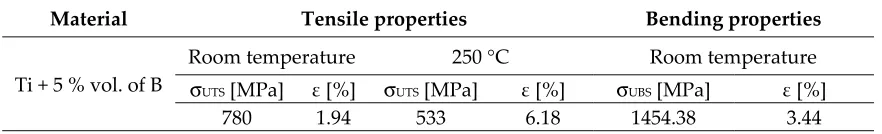
To study the specimen’s microstructure and its mechanical behaviour, the composite produced 295
from the powder mixture with 5 % of volume percentage of boron and hot pressed at 1000 °C was also 296
fabricated via dHP to carry out tensile and bending tests. Table 3 shows a summary of the tensile 297
properties tested at room temperature and at 250 °C; additionally, the flexural behaviour of this kind 298
of composite is also presented. 299
Table 3. Mechanical properties of in situ TMCs produced at 1000 °C with 5 vol % of Boron. 300
Material Tensile properties Bending properties
Ti + 5 % vol. of B
Room temperature 250 °C Room temperature
σUTS [MPa] ε [%] σUTS [MPa] ε [%] σUBS [MPa] ε [%]
780 1.94 533 6.18 1454.38 3.44
301
With respect to the tensile properties measured at room temperature, there is an increase in the 302
σUTS (MPa) due to the boron addition (values are compared to the σUTS of pure Ti grade 1 [20,21]).
303
However, the ductility behaviour is significantly lower compared to the reference values of pure Ti 304
grade 1 (20%). The distribution of the reinforcement in the matrix and the in situ formed TiB increase 305
the strength of the material. The location of the reinforcement of some particles around the matrix 306
grains blocks the dislocation motion promoting the embrittlement of the matrix and improving the 307
strength of the material. When the tensile test is carried out at 250 °C, there is an increase in the 308
percentage of the maximum deformation of the material. However, the σUTS measured at this
309
temperature shows a lower value than σUTS measured at room temperature. As expected, the motion of
310
the dislocation was encouraged by the increase of the temperature during the tensile test. There is a 311
considerable enhancement to the σUBS.
312
From a point of view of the microstructural behaviour, specimens in which the distribution of 313
precipitates is homogenous inside the matrix, better mechanical behaviour can be expected with 314
respect to density, hardness and Young’s Modulus. 315
5. Conclusions 316
The following conclusions can be drawn: 317
- High densification composites are produced. The influence of the in situ formed TiB and
318
processing conditions on the material behaviour is verified 319
- The microstructural study reveals changes in the composites depending on the operational
320
particles evolves from the grain boundaries into the matrix. Up to 1100 °C, two different 322
morphologies of TiB precipitates originate: whiskers and round shapes. Increasing the 323
temperature promotes a gradual growth of the TiB phases. At the same composite 324
composition, the TiB precipitates remained relatively constant even if the temperature rose 325
from 1200 °C to 1300 °C. 326
- Relating to the boron addition, variations of the sizes of these secondary phases were also
327
observed. Although the addition of more boron involved greater formation of precipitates, the 328
proportions between the boron content and the TiB formed were lower at the highest boron 329
content in the starting mixture. The formed TiB and the boron particles significantly 330
contributed to the hardening and stiffness effects. Increasing the temperature helped to 331
increase the stiffness of the composites more than its hardness. 332
333
Acknowledgments: The publication has been supported by Junta de Andalucía with project TIC-7528. We thank 334
the Microscopy and the X-Ray Laboratory Services of CITIUS (University of Seville). Furthermore, the authors 335
wish to thank Rayner Simpson for his assistance with the English translation. 336
Author Contributions: All the authors have been collaborating with each other to obtain a high quality research 337
work. Isabel Montealegre-Meléndez performed the materials selection, analyzed the data and designed the 338
structure of the paper. Cristina Arévalo has been responsible of microstructure characterization for specimens: 339
optical and electron microscopy, and the relation between processing parameters and materials properties. 340
Enrique Ariza has done the mechanical properties and references selection. Eva M. Perez-Soriano has performed 341
the metallographic preparation and the relation between processing parameters and materials properties. Michael 342
Kitzmantel has controlled the fabrication process. Erich Neubauer has optimized the equipment and applications. 343
Conflicts of Interest: The authors declare no conflict of interest. 344
References 345
1. Ravi Chandran, K.S.; Panda, K.B.; Sahay, S.S. TiBw-reinforced Ti composites: Processing, properties, 346
application prospects, and research needs. JOM, 2004, 56( 5), pp. 42–48, DOI:10.1007/s11837-004-0127-1. 347
2. Kondoh, K. 16–Titanium metal matrix composites by powder metallurgy (PM) routes. Titanium Powder 348
Metallurgy, 2015, pp. 277–297. 349
3. Zhang, J. et al. Microstructure and properties of in situ titanium boride (TiB)/titanium (TI) composites. Mater. 350
Sci. Eng. A, 2015, 648, pp. 158–163, DOI: 10.1016/j.msea.2015.09.067. 351
4. Munir, K.S. et al. Microstructure and mechanical properties of carbon nanotubes reinforced titanium matrix 352
composites fabricated via spark plasma sintering. Mater. Sci. Eng. A, 2017, 688, pp. 505–523, DOI: 353
10.1016/j.msea.2017.02.019. 354
5. Ozerov, M.N. et al. Brittle-to-ductile transition in a Ti–TiB metal-matrix composite. Mater. Lett., 2017, 187, pp. 355
28-31, DOI: 10.1016/j.matlet.2016.10.060. 356
6. Jia, L. et al. Microstructural evolution and competitive reaction behavior of Ti-B4C system under solid-state 357
sintering. J. Alloys Compd., 2016, 687, pp. 1004–1011, DOI: 10.1016/j.jallcom.2016.06.280. 358
7. Popov, V.A. et al. Particulate metal matrix composites development on the basis of in situ synthesis of TiC 359
reinforcing nanoparticles during mechanical alloying. J. Alloys Compd., 2017, 707, pp. 365–370, DOI: 360
10.1016/j.jallcom.2016.10.051. 361
8. Jiao, Y. et al. Effects of first-scale TiBw on secondary-scale Ti5Si3 characteristics and mechanical properties of 362
in-situ (Ti5Si3+TiBw)/Ti6Al4V composites. J. Alloys Compd., 2017, 704, pp. 269–281, DOI: 363
10.1016/j.jallcom.2017.02.044. 364
9. Montealegre-Meléndez, I. et al. Study of Titanium Metal Matrix Composites Reinforced by Boron Carbides 365
and Amorphous Boron Particles Produced via Direct Hot Pressing. Key Eng. Mater., 2016, 704, pp. 85–93, 366
DOI: 10.4028/www.scientific.net/KEM.704.85. 367
10. Hu, Y. et al. In-situ ultrafine three-dimensional quasi-continuous network microstructural TiB reinforced 368
titanium matrix composites fabrication using laser engineered net shaping. Mater. Lett., 2017, 195, pp. 116-369
11. Oghenevweta, J.E.; Wexler, D.; Calka, A. Sequence of phase evolution during mechanically induced self-371
propagating reaction synthesis of TiB and TiB2 via magnetically controlled ball milling of titanium and boron 372
powders. J. Alloys Compd., 2017, 701, pp. 380–391, DOI: 10.1016/j.jallcom.2017.01.016. 373
12. Schmidt, J.; Boehling, M.; Burkhardt, U. Preparation of titanium diboride TiB2 by spark plasma sintering at 374
slow heating rate. Sci. Technol. Adv. Mater., 2007, 8(5), pp. 376–382, DOI: 10.1016/j.stam.2007.06.009. 375
13. Sabahi Namini, A.; Azadbeh, M.; Shahedi Asl, M. Effect of TiB2 content on the characteristics of spark plasma 376
sintered Ti–TiBw composites. Adv. Powder Technol., 2017, 28(6), pp. 1564–1572, DOI: 10.1016/j.apt.2017.03.028. 377
14. Liu, B.X. et al. Fracture behaviors and microstructural failure mechanisms of laminated Ti–TiBw/Ti 378
composites. Mater. Sci. Eng. A, 2014, 611, pp. 290–297, DOI: 10.1016/j.msea.2014.05.089. 379
15. Arévalo, C. et al. Influence of Sintering Temperature on the Microstructure and Mechanical Properties of In 380
Situ Reinforced Titanium Composites by Inductive Hot Pressing. Materials, 2016, 9(11), 919, DOI: 381
10.3390/ma9110919. 382
16. Montealegre Meléndez, I.; Neubauer, E.; Danninger, H. Consolidation of titanium matrix composites to 383
maximum density by different hot pressing techniques. Mater. Sci. Eng. A, 2010, 527(16), pp. 4466–4473, DOI: 384
10.1016/j.msea.2010.03.093. 385
17. ASM-International, Nondestructive Evaluation and Quality Control, 9th ed. Ohio, United State of America, 386
1989. 387
18. Attar, H. et al. Nanoindentation and wear properties of Ti and Ti-TiB composite materials produced by 388
selective laser melting. Materials Science and Engineering A, 2017, 688, pp. 20-26, DOI: 389
10.1016/j.msea.2017.01.096. 390
19. Wang, B. et al. Modification of microstructure and tensile property of TiBw/near-α Ti composites by tailoring 391
TiBw distribution and heat treatment. Journal of Alloys and Compounds, 2017, 690, pp. 424-430, DOI: 392
10.1016/j.jallcom.2016.08.138. 393
20. Lütjering, G. and Williams, J.C. Titanium, 2nd ed.; Springer: Berlin, Germany, 2007. 394
21. Leyends, C. and Peters, M. Titanium and Titanium alloys. Fundamentals and applications, 1st ed.; Wiley-VCH 395
Verlag GmbH & Co. KGaA: Weinheim, Germany, 2003. 396