Article
1
Assessment, Validation and Application to Real
2
Samples of a RP-HPLC Method for the Determination
3
of Guayulins A, B, C and D in Guayule Shrub
4
Nadia Spano1,*, Paola Meloni1, Ilenia Idda1, Alberto Mariani1, Maria Itria Pilo1, Valeria Marina
5
Nurchi2, Joanna Izabela Lachowicz2, Ernesto Rivera3, Ancelmo Orona-Espino4 and Gavino
6
Sanna1,*
7
1 Università degli Studi di Sassari, Dipartimento di Chimica e Farmacia, via Vienna 2, 07100 Sassari, Italy;
8
[email protected] (N.S.); [email protected] (P.M.); [email protected] (I.I.); [email protected]
9
(A.M.); [email protected] (M.I.P.); [email protected] (G.S.).
10
2 Dipartimento di Scienze Chimiche e Geologiche,Cittadella Universitaria di Monserrato, 09042 Monserrato,
11
Cagliari, Italy; [email protected] (V.M.N.); [email protected] (J.I.L.).
12
3 Instituto de Investigaciones en Materiales UNAM, Circuito exterior Ciudad Universitaria CP 04510 México
13
DF; [email protected] (E.R.)
14
4 Facultad de Ciencias Biológicas, Universidad Juárez del Estado de Durango, 35010 Gómez Palacio,
15
Durango, México; [email protected] (A.O.E.)
16
* Correspondence: [email protected], Tel. +39-079- 229569; [email protected], Tel. +39-079-229500, Fax.
17
+39-079-0971388
18
19
Abstract: Guayule (Parthenium argentatum Gray) is a shrub native of the arid regions of Mexico. In
20
the last decades, significant attention for its cultivation has risen because it is the raw material for
21
the production of hypoallergenic natural rubber. Guayule biomass contains also high amounts of
22
resin, which is not normally exploited in any way. Among other sesquiterpenic esters, guayulins
23
(i.e. the parteniol esters of cinnamic acid, guayulin A, or of anisic acid, guayulin B) are contained in
24
resin. In addition, minor amounts of guayulin C and guayulin D are formed by
25
degradation/oxidation of guayulins A and B, respectively. Guayulins likely act as cinnamate and
26
p-anisate reservoirs for Guayule shrub, in addition, it has been postulated that they might have a
27
key role in the chemical defense system of Guayule. Furthermore, it seems reasonable that
28
guayulins may possess significant biological properties (e.g. antibacterial and anticancer activities),
29
in close analogy with those shown by sesquiterpene lactones contained in many other species of
30
Parthenum genus. As a matter of fact, guayulins A and B play an important role in the synthesis of
31
antineoplastics used in breast cancer treatment. In this contribution we propose an original and
32
validated RP-HPLC approach to the simultaneous quantification of guayulins A, B, C and D. The
33
procedure of resin extraction from Guayule biomass has been optimized in terms of both extraction
34
method and solvent. RP-HPLC separation has been accomplished by an Ascentis® C18 column
35
under isocratic elution with a 80:20 (v:v) acetonitrile:water mixture. Validation was carried out in
36
terms of limits of detection and quantification, linearity, precision, and trueness. Finally, the
37
method was tested with a number of fresh and seasoned samples of spontaneous Guayule shrub
38
from Mexico.
39
Keywords: Guayule; Parthenium argentatum Gray; Resin; Guayulins; RP-HPLC.
40
1. Introduction
1
Guayule (Parthenium argentatum Gray) is a perennial and low-growing shrub belonging to the
2
Asteraceae family, native of arid regions of Mexico and the southwestern United States. Since the
3
early years of the last century it has gained considerable industrial and scientific interest for the
4
production of a kind of natural rubber exhibiting properties similar to that obtained from the Hevea
5
brasiliensis tree [1,2]. In the last decades, the discovery that guayule latex is free from the allergenic
6
proteins contained in the Hevea latex led to a reemphasis and expansion of guayule research, mainly
7
aimed to the production of hygiene and medical products compliant with the strictest standards of
8
quality for hypoallergenic rubber [3]. Together with rubber, Guayule plant also contains a resinous
9
material (the so-called resin), which has to be separated from rubber in order not to compromise its
10
physical and technological properties. Rubber (8-26% of dry weight) and resin (5-25% of dry weight)
11
are present in amounts roughly equivalent in Guayule shrub [1]. Since the resin fraction is soluble in
12
polar solvents (like acetone), whereas the rubber one can be dissolved only in non-polar solvents
13
(like hexane), sequential or simultaneous extractions have to be made in order to separate these
14
fractions from plant tissue and, eventually, the resin from the latex [1]. The high manufacturing costs
15
of the process of rubber extraction from Guayule make the success of its exploitation dependent in
16
large extent by the possibility of using as much as possible the residual plant fractions, like resin or
17
bagasse, as raw materials to obtain high-value coproducts [4].
18
Guayule resin is usually obtained from the extraction by the ground whole shrub or the
19
coagulated latex with polar solvents, usually acetone [5]. Despite the fact that it is often not valorized
20
and hence discarded, resin is a very interesting fraction from both an academic and an industrial
21
point of view. Indeed, it is not only rich in sesquiterpenoids and triterpenes of potential commercial
22
value [6], but it also contains a variety of interesting secondary metabolites of the shrub, like
23
guayulins [6-8]. Guayulins A
24
((1R,2S,4Z,8Z,10S)-4,8,11,11-tetramethylbicyclo[8.1.0]undeca-4,8-dien-2-yl(2E)-3-phenylprop-2-enoa
25
te) and B ((4Z,8Z)-4,8,11,11-tetramethylbicyclo[8.1.0]undeca-4,8-dien-2-yl 4-methoxybenzoate) are
26
respectively the cinnamic and anisic esters of the partheniol
27
((1S,2E,6E,9S,10R)-3,7,11,11-tetramethylbicyclo[8.1.0]undeca-2,6-dien-9-ol) [7], whereas the guayulin
28
C
29
((1AR,1BR,2R,4AR,7S,7AR)-2-hydroxy-1,1,2-trimethyl-5-methylidene-decahydro-1H-cyclopropa[E]
30
azulen-7-yl (2E)-3-phenylprop-2-enoate) and guayulin D
31
((1AR,1BR,2R,4AR,7S,7AR)-2-hydroxy-1,1,2-trimethyl-5-methylidene-decahydro-1H-cyclopropa[E]
32
azulen-7-yl 4-methoxybenzoate) are likely formed by the oxidation of the guayulines A and B,
33
respectively [6,8]. Scheme 1 reports the structures of these molecules.
34
R = t-cinnamate, guayuline A
R = t-cinnamate, guayuline C
R = p-anisate, guayuline B
R = p-anisate, guayuline D
Scheme 1. Structures of guayulins A and B (a) and guayulins C and D (b).
35
Guayulins A and B are abundant in the resin. Namely, up to 10% of the resin mass is constituted
36
of guayulin A [9-11], while the relevant amount of guayulin B in the resin from India is between 0.1
37
and 3% [10]. The wide variability in the amounts of guayulins A and B in the resin depends on a
38
number of factors, such as: soil nature, climate, phenological phases, cultivar, age and – mainly – the
39
nature of the different parts of the shrub [10,11]. On the other hand, the concentrations of guayulins
C and D in resin seems to be much lower than those of guayulins A and B. Schloman et al. estimated
1
that the amounts of guayulins C and D in resin are between 50% and less than 10% of the amount of
2
the guayulin A and B, respectively [6]. Guayulins likely act as cinnamate and p-anisate reservoirs for
3
Guayule shrub: when it is required by the plant, a metabolic turnover releases the corresponding
4
free acid [4]. The hypothesis that guayulins and rubber may have a common biochemical link [12]
5
suggested Teetor et al. [11] to use the amounts of guayulins A and B as possible predictive tools in
6
order to evaluate the rubber content in Guayule shrub, but the results obtained were absolutely
7
unsatisfactory. It is noteworthy that, in Heliantheae tribe and Parthenium genus, only Parthenium
8
argentatum contains both guayulins and rubber, whereas it does not contain any sesquiterpene
9
lactone (i.e. one of the principal families of compounds easily found in almost all the other species of
10
Parthenum genus) [13]. Since the sesquiterpene lactones are synthesized in the Parthenum genus
11
plants as chemical defense agents against animal attacks (these molecules are toxic for livestock, a
12
deterrent for insects and cause severe contact allergies in mammalians) [14], it seems reasonable that
13
guayulins might play a similar physiological role also in Parthenium argentatum. Results of
14
pioneering studies conducted by Rodriguez et al. supported this insight [15]. As a matter of fact,
15
guayulin A has been found to be a powerful contact allergen for guinea pigs [8] while the same
16
behavior has not been observed for guayulin B. For humans, the sensitizing power of guayulin A is
17
much smaller than for laboratory animals. Hence, the possibility that traces of guayulin A may be
18
present in the guayule rubber at a sensitizing level seems to be remote at the moment [16]. In
19
analogy to what observed for sesquiterpene lactones in the most of the species of Parthenum genus, it
20
is likely that guayulins may also exhibit other significant biological properties (i.e. antibacterial and
21
anticancer activities) [15]. Indeed, guayulines A and B act as biological triggers in the synthesis of
22
lychnostatine and paclitaxel, which are antineoplastic agents used in breast cancer treatment.
23
It is evident that the continuous rise of interest in the properties of guayulins needs the
24
development of reliable, accurate and sensitive analytical methods for their identification and
25
quantification. Until now, the analytical methods reported in literature for the measurement of the
26
amount of guayulins in Guayule resin [3,4,8,11,13,17,18,19] or latex [16] are scarce and all lacking of
27
any validation protocol. Obviously, chromatographic methods are dominant in the analytical
28
characterization of such analytes and, among them, HPLC is the preferred approach. While few
29
papers reported the presence of guayulins C and D in extracts from resin [6,8,11], the quantification
30
of these analytes has been never simultaneously carried out to that of guayulins A and B [6,8].
31
Hence, it is evident that at present a validated HPLC procedure aimed to simultaneously quantify
32
the amounts of all known guayulins is not reported in literature. For this reason, the principal aim of
33
this contribution is to develop, validate and test with real samples an original RP-HPLC method
34
devoted to the quantification of guayulins A, B, C and D in different parts of Guayule shrub from
35
Mexico. As a side result of this study, different approaches of extraction of analytes from the matrix
36
were also compared in order to increase efficiency and make the procedure more eco-friendly.
37
2. Materials and Methods
38
2.1. Samples and Sample preparation
39
Spontaneous Guayule was collected in the province of San Pedro del Gallo, Durango, Mexico,
40
along the highways where it naturally grows. All the harvested Guayule shrubs were about 60 cm
41
high, thus estimating to be between 15 and 18 year old [20]. These plants were harvested in 2015 in
42
two sites located in the Durango desert. The first one (sampling of January 2015) is in the Mexican
43
Federal Highway 30 (road section Bermejillo-El Palmito, GPS coordinates: 25°52'20.68"N,
44
104°06'26.07"W), whereas the second one (sampling of September 2015) is along the highway Paso
45
Nacional-San Pedro del Gallo (GPS coordinates: 25°40'50.41"N, 104°16'33.53"W). A total of twenty
46
plants (ten for each sampling) were harvested following the recommendations specified by the
47
Official Mexican Rule [21], which establishes the procedures for the sampling, transportation and
48
storage. Shrubs collected in the harvest of January 2015 were air-dried at room temperature in open
49
air for eight months, whereas shrubs collected in the harvest of September 2015 did not undergo any
drying process. Only a few millimeters of rain fell during the first harvest. Just arrived in the
1
laboratory, all shrubs were cut up to constitute three fractions: leaves (L), fine stems (less than 10
2
mm in diameter, FS) and coarse stems (more than 10 mm of diameter, CS). All fractions were stored
3
in a freezer at -18°C until sample preparation. Before extraction, samples were allowed to reach the
4
room temperature. Later, all samples were dried at 50°C until reaching constant weight, roughly
5
pieced and then ground.
6
2.2. Chemicals and reagents
7
All reagents were at least of analytical grade. Ethanol (assay ≥99.8%), acetone (≥99.8%) and
8
acetonitrile (≥99.9%) were purchased from Sigma–Aldrich (Milan, Italy), whereas ultrapure (Type 1)
9
water (specific resistance 18 M) was used throughout the analyses. Guayulins A, B, C and D were
10
from 1717 CheMall (Mundelein, IL, USA).
11
2.3. Instrumentation
12
Ultrapure water was from a New Human Power II Scholar UV apparatus (Human Corporation,
13
Seoul, Korea). A Retsch Grindomix GM 200 knife mill (Verder Scientific, Torre Boldone, Italy) was
14
used to grind the samples before extraction. ASE extractions were performed by an Accelerated
15
Solvent Extractor Dionex ASE 200, equipped with a Dionex Solvent Controller System (Dionex
16
Corporation, California, USA), whereas ultrasonic assisted extractions were performed by a
17
Bandelin-Sonorex model RK 255 H ultrasonic bath. Solvent was evaporated by extracted samples by
18
a Büchi Rotovapor model EL130 (Büchi, Cornaredo, Italy). The HPLC equipment consisted of a
19
Series 200 binary pump, a sampling valve, a 20 μL sample loop, a Series 200 LC column oven, and a
20
Series 200 UV−vis variable wavelength detector, all from PerkinElmer, Milan, Italy. Data were
21
processed using a Turbochrom Workstation Software (PerkinElmer, Milan, Italy). Before use, the
22
mobile phase was filtered through a 0.45 μm membrane from Millipore (Bedford, MA, USA) to
23
remove any particulates.
24
2.4. Validation
25
Validation of the proposed method was accomplished on the basis of limit of detection (LoD),
26
limit of quantification (LoQ), linearity, precision (measured as both repeatability and intermediate
27
precision) and trueness (measured by recovery tests of each analyte on real Guayule samples). LoD
28
was calculated according to the Upper Limit Approach (ULA1) approved by IUPAC [22]. For each
29
analyte, four different solutions at increasing concentrations not far from the expected LoD (i.e.
30
between 0.02 and 0.1 mg L-1 for each analyte) were prepared and analyzed. Each measurement was
31
performed in triplicate. In addition, the ULA1 approach recommends that the LoQ value is three
32
times the relevant LoD value. Linearity was checked on at least three orders of magnitude of
33
concentration, as a function of the relative abundance of each guayulin in the different parts of the
34
Guayule shrub. Precision was evaluated in terms of both repeatability (i.e. the CV measured in five
35
consecutive replicates of the same sample in the same analytical session) and intermediate precision
36
(i.e. the CV obtained in five consecutive replicates of the same sample in different analytical sessions
37
along two weeks). The acceptability of these precision scores was checked in terms of HorRat ratio
38
values (i.e., the ratio between experimental and theoretical CV measured on the basis of the
39
Horwitz's theory) [23]. Due to the lack of any certified reference materials or of reliable independent
40
analytical methods, trueness was estimated through recovery tests. Four aliquots of the acetone (or
41
ethanol) extract of the stems were submitted to the overall analytical procedure after the addition of
42
increasing amounts of each guayulins to three of them. For each analyte, a plot of analytical
43
concentration versus the added amounts of mass was obtained: the recovery is represented by the
44
percent slope value of the regression line. The estimation of bias was made in duplicate.
45
Acceptability of the trueness values has been established according to the guidelines described in the
46
AOAC manual for peer-verified methods [24].
3. Results
1
3.1. Choice of the extraction procedure.
2
The choice of extraction technique of resin by Guayule biomass (i.e. leaves, fine stems, coarse
3
stems) was accomplished by means of a preliminary comparison among three well-known
4
procedures: the traditional extraction with warm solvents (40 °C) (WSE), the ultrasonic assisted
5
extraction (UAE) and the accelerated solvent extraction (ASE). Acetone (i.e. the most used solvent
6
for the extraction of the resin from Guayule biomass) and ethanol, one of the most important green
7
polar solvent, were the pure solvents used in this phase. Quantification of resin in organic extracts
8
has been performed by means of UV-Vis spectroscopy according to literature methods [25].
9
3.1.1. Procedures of extraction
10
3.1.1.1. Extraction with warm solvents (WSE)
11
2.5 g of selected Guayule biomass were suspended in 15 mL of acetone (or ethanol). The
12
mixture was stirred and heated up to 40°C in a thermostatic bath for 20 min. After the separation of
13
the solvent from the biomass and its replacement with a new 15 mL aliquot, the extraction procedure
14
was repeated for additional two times. The three extracts were collected and made up to the final
15
volume of 50 mL with pure solvent.
16
3.1.1.2. Ultrasonic assisted extraction (UAE)
17
2.5 g of selected Guayule biomass were suspended in 15 mL of acetone (or ethanol). The
18
mixture was stirred at room temperature in an ultrasonic bath for 20 min. After the separation of the
19
solvent from the biomass and its replacement with a new 15 mL aliquot, the extraction procedure
20
was repeated for additional two times. The three extracts were collected and made up to the final
21
volume of 50 mL with pure solvent.
22
3.1.1.3. Accelerated solvent extraction (ASE)
23
5.0 g of selected Guayule biomass were transferred in a 22 mL thimble. Extraction was
24
performed using 20 mL of the chosen solvent (acetone or ethanol). The extraction temperature was
25
set at 40°C. Three consecutive extraction cycles have been performed for each biomass aliquot. The
26
organic extracts were joined and made up to 100 mL with pure solvent.
27
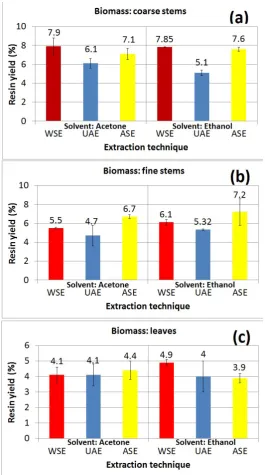
Figure 1 reports a comparison of resin yields (% on the initial biomass amount) measured for
28
each extraction method and each biomass analyzed.
1
Figure 1. Comparison of average solvent extraction yields in resin (% on the biomass amount), n = 3.
2
Solvents: acetone or ethanol. (a) biomass: coarse stems; (b) biomass: fine stems; (c) biomass: leaves.
3
Data obtained substantiate that the UAE method is characterized by the least recovery in resin,
4
whereas the performances of WSE and ASE methods are roughly comparable as a function of the
5
nature of Guayule biomass and the extraction solvent. However, it is possible to note that the net
6
amount of resin extracted from the fine stems by means of ASE method is statistically higher than
7
that obtained by WSE, whereas the yields in resin measured in the extraction from coarse stems are
8
not statistically different among them from both WSE and ASE methods. Keeping into account the
9
better intrinsic reproducibility of the ASE approach as compared with the WSE method, the ASE
10
extraction method with acetone and ethanol was chosen as the technique used of the present
11
analytical method.
12
3.2. Assessment of the chromatographic method
13
The first RP-HPLC methods aimed to quantify guayulins in Guayule resin were developed
14
more than thirtyfive years ago, and were only aimed to the determination of guayulins A and B. On
15
the other hand, reliable RP-HPLC methods devoted to measure the concentration of guayulins C and
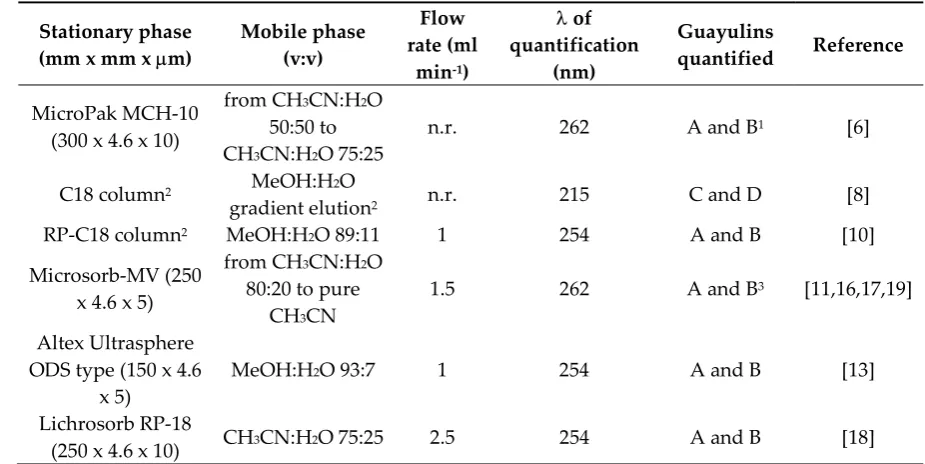
D are still absent in the literature. For the reader’s convenience, Table 1 summarizes the key features
1
of different literature RP-HPLC methods for the determination of guayulins.
2
Table 1. Key features of selected literature RP-HPLC methods of analysis for guayulins in resin
3
extracts from Guayule.
4
Stationary phase
(mm x mm x m) Mobile phase (v:v)
Flow rate (ml
min-1)
of
quantification (nm)
Guayulins
quantified Reference
MicroPak MCH-10 (300 x 4.6 x 10)
from CH3CN:H2O 50:50 to CH3CN:H2O 75:25
n.r. 262 A and B1 [6]
C18 column2 MeOH:H2O
gradient elution2 n.r. 215 C and D [8]
RP-C18 column2 MeOH:H2O 89:11 1 254 A and B [10]
Microsorb-MV (250 x 4.6 x 5)
from CH3CN:H2O 80:20 to pure
CH3CN
1.5 262 A and B3 [11,16,17,19]
Altex Ultrasphere ODS type (150 x 4.6
x 5) MeOH:H
2O 93:7 1 254 A and B [13]
Lichrosorb RP-18
(250 x 4.6 x 10) CH3CN:H2O 75:25 2.5 254 A and B [18]
1 Guayulins C and D were quantified using a GC method; 2 no further details were provided in the
5
paper; 3 in ref. [11], guayulins C and D were only identified, but not quantified.
6
Furthermore, it is of utmost significance to underline that no analytical method proposed until
7
now has been validated, and this poses serious doubts about the overall reliability of the data
8
reported. The results of preliminary tests performed on selected literature methods suggested the
9
assessment of an original procedure, based on a more recent C18 stationary phase than those
10
reported in Table 1. Ascentis® C18 is a monomeric-type, fourth-generation,
11
octadecylsiloxane-bonded silica stationary phase, introduced in the market in the early 2000s, and
12
characterized by unusually high surface area (450 m2 g-1) if compared with other C18 phases having
13
similar porosity (10 m) and surface coverage (3.7 μmol m-2). Since Ascentis® stationary phases have
14
already been successfully used for the HPLC determination of terpenoids in vegetal matrices [26],
15
we considered useful to check the performances of an Ascentis® C18 (25 cm x 4.6 mm x 5 μm)
16
column in the separation of guayulins A, B, C and D. Further steps of the method assessment have
17
been devoted to optimize the composition of the mobile phase and to the choice of the best
18
wavelength of UV detection. Starting from the literature methods, different methanol:water and
19
acetonitrile:water mixtures have been tested, working both in isocratic and in gradient elution. An
20
acetonitrile:water 80:20 (v:v) solution provided the best results. In addition, the acquisition of
21
chromatograms in the wavelength range between 250 and 280 nm demonstrates that the best
22
compromise among different UV maximum absorptions of the analytes is the at 262 nm, as
23
previously reported in the literature [4,6,10,11]. Table 2 summarizes the operating conditions of the
24
chromatographic method proposed.
Table 2. Chromatographic conditions proposed for the contemporary RP-HPLC separation and
1
quantification of guayulins A, B, C and D in resin extracts from Guayule biomass.
2
Stationary phase (length, mm x diameter, mm x particle size, m) Ascentis® C18 (250 x 4.6 x 5)
Mobile phase (v:v) CH3CN:H2O 80:20
Elution mode Isocratic
Volume (μL) 20
Flux of mobile phase (mL min-1) 1.5
UV wavelength (nm) 262
Column temperature (°C) 25
Length of the chromatographic run (min) 25
The adoption of an Ascentis® C18 RP-HPLC column, more recent in comparison to those reported in
3
literature (see Table 1) have allowed us to develop an isocratic method achieving the complete
4
resolution at baseline level of all analytes in less than 20 minutes, thus with large time savings of the
5
chromatographic run as compared with the most recent literature method [11].
6
3.3. Analysis of the resin extracts
7
2.5 mL of acetone (or ethanol) ASE extract of the resin from guayule biomass were evaporated,
8
at room temperature and under reduced pressure, to dryness. The resin residue was dissolved in 5
9
mL of acetonitrile, and then filtered through a 0.45 m nylon filter before HPLC analysis. Figure 2
10
shows typical chromatograms of ASE resin extracts from Guayule leaves (Figure 2a) and coarse
11
stems (Figure 2b).
12
13
Figure 2. Guayulins A, B, C and D in resin extracts from a) Guayule leaves (sample L1, extraction
14
solvent: acetone) and b) Guayule coarse stems (sample CS2, extraction solvent: ethanol). Peak
15
attribution: 1; guayulin D, 2; guayulin C; 3, guayulin B, 4, guayulin A. A.U. = arbitrary units.
16
Guayulins peaks were identified by comparing retention times with those of standard
17
solutions, and the attribution of each analyte was confirmed by spiking each peak in the real sample
18
with a standard solution containing known amounts of pure guayulins. In order to determine the
19
retention times, the reference standards were injected both individually and as a mixture.
20
Quantification was accomplished by external linear calibration on three different concentration
21
levels in the relevant linearity interval of each analyte. Each sample was analyzed three times, and
22
each analytical datum is reported as the average value ± the relevant standard deviation.
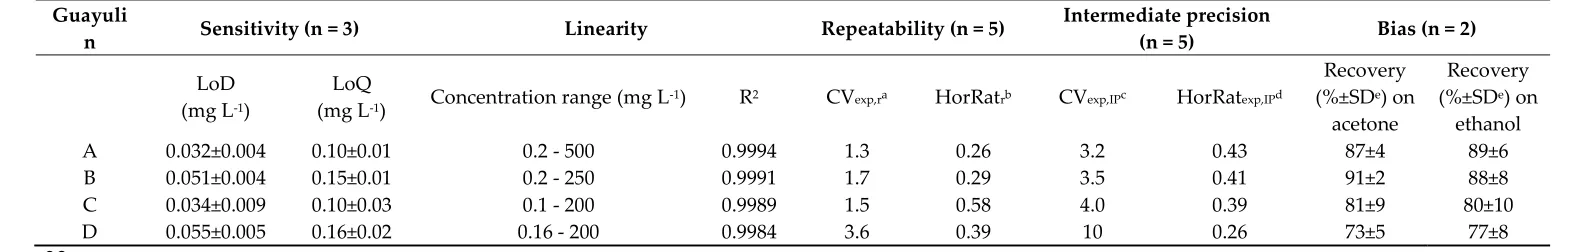
3.3. Validation
1
Table 3 lists the validation parameters for the method proposed. Low LoD values (always
2
below 0.1 mg L-1) supported a good sensitivity of the method proposed, which is able to quantify
3
analytes at concentration levels between 0.1 and 0.2 mg L-1, as a function of the analyte. Also linearity
4
is more than satisfactory. It has been checked only within the three orders of magnitude of
5
concentration (i.e. inside the range of variability of the guayulins in the different parts of Guayule
6
shrub), obtaining values of the determination coefficients R2 ranging between 0.9994 and 0.9984, but
7
it is likely that the linear dynamic interval for each analyte may largely overcome these ranges. In
8
addition, the analysis of the residuals of the regression line has excluded any possible deviation from
9
linearity of each calibration plot. A preliminary evaluation of the samples has substantiated a very
10
wide scattering of the concentration of the analytes in them. Due the fact that the meaning of the
11
precision measurements crucially depends on analyte concentration [23], repeatability and
12
intermediate precision were evaluated on the Guayule extracts characterized, for each analyte, by a
13
concentration that was as close as possible to its average value in the relevant calibration interval.
14
For this reason the ethanol extract of sample FS1, the acetone extract of sample FS2, the acetone
15
extract of sample FS1 and the ethanol extracts of sample CS1 were chosen for the precision
16
measurements for guayulins A, B, C and D, respectively. The acceptability of the levels of the
17
precision data, ranging between 1.3 and 3.2% (guayulin A) and 3.6 and 10% (guayulin D) for
18
repeatability and intermediate precision, respectively, were evaluated by a fitness-for-purpose
19
methodology based on the Horwitz's theory [23]. Operatively, acceptable values of the HorRat ratio
20
(i.e. the ratio between the experimental CV and the theoretical CV calculated on the basis of the
21
Horwitz’s theory) should be less than 1.5. Since the HorRat ratios for the procedure subject of this
22
work never exceeded 0.6, the precision levels obtained from all analytes can be considered
23
acceptable. Trueness evaluations have been accomplished with the same Guayule samples involved
24
in the precision measurements. Recoveries obtained ranged between 73±5% (guayulin D) and 91±2%
25
(guayulin B) for acetone extracts, whereas ethanol extracts gave recoveries between 77±8% (guayulin
26
D) and 89±6% (guayulin A). The evaluation of the recovery values obtained on the basis of the
27
AOAC guidelines [24] have allowed to substantiate – for all analytes - a slight underestimation bias.
28
Unfortunately, the complete absence in the literature of validated methods for the determination of
29
guayulins prevented us to make any comparison with results from previous studies.
Table 3 - Validation data
31
Guayuli
n Sensitivity (n = 3) Linearity Repeatability (n = 5) Intermediate precision (n = 5) Bias (n = 2)
LoD (mg L-1)
LoQ
(mg L-1) Concentration range (mg L-1) R2 CVexp,ra HorRatrb CVexp,IPc HorRatexp,IPd
Recovery (%±SDe) on
acetone
Recovery (%±SDe) on
ethanol
A 0.032±0.004 0.10±0.01 0.2 - 500 0.9994 1.3 0.26 3.2 0.43 87±4 89±6
B 0.051±0.004 0.15±0.01 0.2 - 250 0.9991 1.7 0.29 3.5 0.41 91±2 88±8
C 0.034±0.009 0.10±0.03 0.1 - 200 0.9989 1.5 0.58 4.0 0.39 81±9 80±10
D 0.055±0.005 0.16±0.02 0.16 - 200 0.9984 3.6 0.39 10 0.26 73±5 77±8
a CVexp,r is the experimental coefficient of variation of repeatability, measured in the ethanol extract of FS1 for guayulin A, in the acetone extract of FS2 for guayulin
32
B, in the acetone extract of FS1 for guayulin C and in the ethanol extract of CS1 for guayulin D, respectively; b HorRatr is the ratio between CVexp,r and the theoretical
33
repeatability data (CVH,r) according to Horwitz’s theory; c CVexp,IP is the experimental coefficient of variation of intermediate precision, measured in the ethanol
34
extract of FS1 for guayulin A, in the acetone extract of FS2 for guayulin B, in the acetone extract of FS1 for guayulin C and in the ethanol extract of CS1 for guayulin
35
3.4. Application on real samples
1
Table 4 reports the analytical data obtained for the RP-HPLC determination of guayulins A, B,
2
C and D in acetone and ethanol ASE extracts from different Guayule biomass (leaves (L samples),
3
fine stems (FS samples) and coarse stems (CS samples)) harvested in January 2015 (dried samples, 1)
4
and in September 2015 (fresh samples, 2).
5
Table 4. Concentration of guayulins A, B, C and D in acetone or ethanol extracts of Guayule biomass
6
(leaves (L), fine stems (FS) and coarse stems (CS)) harvested in January 2015 (dried samples, 1) and in
7
September 2015 (fresh samples, 2).
8
Guayulins (mg kg-1±SD)
Sample (solvent) A (A) A (E) B (A) B (E) C (A) C (E) D (A) D (E)
L1 2080±40a 2140±40a 444±9a 449±4a 1638±8a 1400±45b 360±30a 330±30a
L2 2030±65a 2190±20a 428±6a 460±9a 1650±7a 1560±45b 370±20a 330±20a
FS1 3810±30a 3230±40a 615±9a 500±20a 372±6a 204±4a 8.4±0.7c 6.52±0.07a
FS2 4190±40a 3640±10a 1190±20a 1150±9a 61.5±0.1a 26.4±0.7a <0.32* <0.32*
CS1 8160±90a 9830±20a 700±10d 884.8±0.7a 1010±4a 1044±7a 25±2a 55±2a
CS2 8800±100a 7800±100a 3090±20a 2810±40a 249±4a 199±4a 23±2a 16±2a
SD = standard deviation; n = 3; *LoQ of guayulin D; paired values (i.e. same sample, same guayulins, different
9
extraction solvent) followed by the same letter are not significantly different according to ANOVA test at P =
10
0.05.
11
While data relative to guayulins A and B are roughly comparable with those previously
12
reported in literature [4,6,10,11], those relative to the amounts of guayulins C and D in acetone (or
13
ethanol) extracts by different parts of the Guayule shrub are - at the best of our knowledge -
14
unprecedented at all. Firstly, it is very important to highlight that these data are relative to a
15
spontaneous Guayule shrub, whereas almost all literature data are relative to specific and
16
well-known Guayule genotypes coming from cultivation.
17
3.4.1. Guayulins in Guayule leaves.
18
As a first remark, it is interesting to note that the relative composition in guayulins on leaves
19
from the first and the second harvest is roughly constant, and this is probably due to the fact that
20
also the leaves of the shrubs harvested in September 2015 arrived not entirely fresh in the laboratory,
21
like those harvested in January 2015. The relative composition of both guayulins is almost the same
22
as the nature of the solvent varies, with the only exception of a slight increase of the concentration of
23
guayulins C and D and a faint decrease of the guayulin A in the acetone extract in comparison to
24
those obtained by ethanol. The ratio between guayulin A and B in leaves is roughly close to 5:1. This
25
data is significantly higher than that (i.e., 1.3) measured by Sidhu et al. for a Gila cultivar [10], but is
26
within the range (between 2.5 and 7) measured by Teetor et al [11] in brown leaves of three Guayule
27
cultivars. On the other hand, leaves are very rich in guayulins C and D. In particular, the amount of
28
guayulin D in leaves is more than ten times higher than those found in the richest remaining part of
29
Guayule shrub (i.e. the coarse stems from the January harvest, CS1), whereas the concentration of
30
guayulin C in leaves is only ca. 50% higher than that measured in CS1. The significant increase of
31
concentration of guayulins C and D is likely a consequence of the drying process of the guayule
32
biomass. This fact confirms the hypotheses that these compounds could derive from
33
oxidation/degradation pathways from guayulins A and B, respectively [6.8]. The increase of
34
concentration is more evident for guayulin C rather than for guayulin D, but it is possible that this
35
should be caused by the difference between the relative abundance of guayulin A and guayulin B,
36
respectively.
3.4.2. Guayulins in Guayule stems.
1
The highest amounts of guayulins A and B were found in the coarse stems (CS samples).
2
Depending on the nature of the solvent used for the ASE extraction, amounts ranging between
3
7800±100 and 9830±20 mg kg-1 were measured for guayulin A, whereas concentrations ranging
4
between 700±10 and 3090±20 mg kg-1 were measured for guayulin B. These concentrations are in
5
partial agreement with those observed by Teetor et al. for guayulin A [11] and by Sidhu et al. for
6
guayulin B [10]. Indeed, the concentrations of guayulin B measured by Teetor et al. [11] and the
7
amounts of guayulin A found by Sidhu et al. [10] were not as high as those measured in this study. It
8
is interesting to note that the concentration ratio between guayulin A and guayulin B, which is
9
roughly constant at varying of the nature of the solvent, increases of more than 400% passing from
10
fresh to aged stems, and this is due to the loss of more than 70% in the average amount of guayulin B
11
during the storage. On the other hand, data show that changes of the concentration of the guayulin
12
A, albeit much lower than those shown by guayulin B, depend by both the nature of the extraction
13
solvent and the aging of the sample in non trivial way. Furthermore, the amount of guayulin C in
14
these samples tends to sharply increase (up to five times higher) with ageing, whereas the
15
concentration of this analyte is invariant towards the nature of the extraction solvent. Finally, only a
16
few tens of mg kg-1 of guayulin D were found in the coarse stem samples. A moderate increase in
17
concentration of this analyte, likely due to aging effects, was observed only in ethanol extracts.
18
The amounts of guayulins in fine stems are intermediate between those measured in coarse
19
stems and leaves. The amounts of guayulins A and B in these samples are normally only 30-50% of
20
the relevant values measured for coarse stems, whereas the loss of guayulin B during the ageing is
21
only between 50 and 55% the amount measured in fresh samples. On the other hand, very high
22
increases of concentration of guayulin C were found (ranging between 600 and 770% in samples
23
extracted with acetone and ethanol, respectively) passing from fresh to aged samples, whereas just
24
few mg kg-1 of guayulin D were measured only in FS1 samples, being the remaining samples below
25
the relevant LoQ for this analyte.
26
4. Conclusions
27
At the best of our knowledge, for the first time a RP-HPLC method specifically aimed to
28
simultaneously measure the concentration of the known guayulins in resin extracts from parts of
29
Guayule shrub has been developed, validated and applicated to real samples. The development of
30
the method has first involved the optimization of the resin extraction procedure from the Guayule
31
biomass among three different approaches (warm solvent extraction, ultrasonic assisted extraction,
32
accelerated solvent extraction). The latter technique provided best performances and was chosen to
33
be used in the analytical method. The HPLC separation was accomplished by means of an isocratic
34
elution on an Ascentis® C18 column with an 80:20 (v:v) mixture of acetonitrile and water. In this
35
way, the separation at the baseline level of all analytes in less than twenty minutes was obtained.
36
Low LoD and LoQ values, a very good linearity over more than three orders of magnitude and a
37
very good precision characterized the proposed method. On the other hand, a slight
38
underestimation bias was observed in all analytes. The method has been successfully tested to fresh
39
and aged samples of spontaneous Guayule shrub, harvested in the Chihuhaua desert (Laredo,
40
Mexico). The guayuline amount was measured as a function of the ageing level of the sample (fresh
41
or air-exposed for eight months), the parts of the plant (leaves, fine stems, coarse stems) and the
42
nature of the extraction solvent (acetone or ethanol). The data obtained are in substantial agreement
43
with those described in the literature for guayulins A and B, while there are no reference data for
44
guayulins C and D. The analysis of the stems revealed evident differences in the concentration of
45
guayulins as a function of their diameter, of the ageing level and - to a lesser extent - of the nature of
46
the extraction solvent. On the other hand, the analysis of the leaves showed no meaningful
47
differences among data obtained from samples obtained in the two crops or by variation of the
48
solvent nature. The leaves have been the richest fractions in guayulines C and D, while the coarse
49
stems have been the richest in guayulines A and B. The obtained data show that leaves constitute the
50
fraction of Guayule that is probably more is prone by the effect of oxidative degradation of
guayulins A (and B) and the consequent transformation in guayulins C (and D). This behavior is
1
much less evident, where it is present, on the stems. This analytical method is expected to be useful
2
in any further qualitative and quantitative evaluation of guayulins in different parts of Guayule
3
shrub as a function of the nature of the genotype, or the adoption of different cultivation practices.
4
Acknowledgments: This work was financed by the Italian "Ministero dell'Istruzione, dell'Università e della
5
Ricerca" (CTN-001-00063-46446 ALBE BIOMASSE Lignocellulosiche alternative per lo sviluppo di elastomeri).
6
Author Contributions: N.S., G.S and A.M. conceived and designed the experiments; P.M. and I.I. performed
7
the experiments; M.I.P., V.M.N and J.I.L. analyzed the data; E.R. and A.O.E. provided Guayule samples; G.S.
8
and N.S. wrote the paper.
9
Conflicts of Interest: The authors declare no conflict of interest.
10
References
11
1. McIntyre, D.; Stephens, H.L.; Schloman Jr, W.W.; Bhowmick, A.K. Guayule rubber, in Handbook of
12
Elastomers, 2nd ed., Bhowmick, A.K., Stephens, H., Eds.; CRC press, 2000, ISBN 9780824703837,
13
2. van Beilen, J.B.; Poirier, Y. Establishment of new crops for the production of natural rubber. Trends
14
Biotechnol. 2007, 25, 522-529, DOI: 10.1016/i.tibtech.2007.08.009.
15
3. van Beilen, J.B.; Poirier, Y. Guayule and Russian Dandelion as Alternative Sources of Natural Rubber. Crit.
16
Rev. Biotechnol.2007, 27, 217–231, DOI: 10.1080/07388550701775927.
17
4. Schloman Jr., W.W.; Garrot Jr., D.J.; Ray, D.T.; Bennett, D.J. Seasonal Effects on Guayule Resin
18
Composition. J. Agric. Food Chem.1986, 34, 177-179, DOI: 10.1021/jf00068a005.
19
5. Eagle, F.A. Guayule. Rubber Chem. Technol.1981, 54, 662-684, DOI: 10.5254/1.3535825.
20
6. Schloman Jr., W.W.; Hively, R.A.; Krishen, A.; Andrews, A.M. Guayule Byproduct Evaluation: Extract
21
Characterization. J. Agric. Food Chem.1983, 31, 873-876. DOI: 10.1021/jf00118a050
22
7. Romo, J.; Romo de Vivar, A.; Ortega, A.; Diaz, E. Guayulins A and B, new sesquiterpenes isolated from
23
guayule. Rev. Latinam. Quim. 1970, 1, 132-135.
24
8. Martinez, M.; Flores, G.; Romo de Vivar, A.; Reynolds, G.; Rodriguez, E. Guayulins C and D from Guayule
25
(Parthenium Argentatum). J. Nat. Prod.1986, 49, 1102-1103. DOI: 10.1021/np50048a022
26
9. Watkins, S.F.; Fronczek, F.R.; Chiari, G.; Reynolds, G.W.; Rodriguez. E. Molecular structure of guayulin A.
27
J. Nat. Prod. 1985, 48, 631-633. DOI: 10.1021/np50040a018
28
10. Sidhu, O.P.; Ratti, N.; Behl, H.M. Quantitative and Qualitative Variations in Resin Content and Guayulins
29
(A and B) among Different Guayule Cultivars. J. Agric. Food Chem. 1995, 43, 2012-2015. DOI:
30
10.1021/jf00056a010
31
11. Teetor, V.H.; Ray, D.T.; Schloman Jr, W.W. Evaluating chemical indices of guayule rubber content:
32
Guayulins A and B. Ind. Crop Prod. 2009, 29, 590–598. DOI:10.1016/j.indcrop.2008.11.005
33
12. Mau, C.; Cornish, K. Guayule plants, products, and derivatives. US Patent 8013213, 2006.
34
13. Mohan Behl, H.; Marchand, B.; Rodriguez. E. Inheritance of Sesquiterpenoid Phenolic Acid Esters
35
(Guayulins) in F1 Hybrids of Parthenium (Asteraceae). Z. Naturforsch. 1983, 38, 494 -496. DOI:
36
10.1515/znc-1983-5-631
37
14. Rodriguez, E.; Towers, G.H.N.; Mitchell, J.C. Biological activities of sesquiterpene lactones. Phytochemistry
38
1976, 15, 1573-1580. DOI: 10.1016/S0031-9422(00)97430-2
39
15. Rodriguez, E.; Reynolds, G.W.; Thompson. J.A. Potent Contact Allergen in the Rubber Plant Guayule
40
(Parthenium argentatum). Science1981, 211, 1444-1445. DOI: 10.1126/science.7466403
41
16. Cornish, K.; Williams, J.L.; Kirk, M.; Teetor, V.H. Evaluation & control of potential sensitizing & irritating
42
chemical components in natural rubber latex extracted from the industrial crop guayule. Ind. Biotechnol.
43
2009, 5, 245-252. DOI: 10.1089/ind.2009.5.245
44
17. Coffelt, T.A.; Nakayama, F.S.; Ray, D.T.; Cornish, K.; McMahan, C.M. Post-harvest storage effects on
45
guayule latex, rubber, and resin contents and yields. Ind. Crop Prod. 2009, 29, 326–335.
46
18. Proksch, P.; Mohan Behl, H.; Rodriguez. E. Detection and quantification of guayulins A and B in
47
Parthenium argentaturn (guayule) and F1 hybrids by high-performance liquid chromatography. J.
48
Chromatogr. A1981, 213, 345-348. DOI: 10.1016/S0021-9673(00)81920-2
49
19. Ray, D.T.; Veatch-Blohm, M.E.; Teetor, V.H. Walsh. B. Upper and Lower Heritability Estimates in Guayule
50
Based on Mode of Reproduction. J. Amer. Soc. Hort. Sci.2007, 132, 213–218.
20. Lloyd, F.E. in Guayule (Parthenium argentatum Gray), a rubber plant of the Chihuahuan desert. Carnegie
1
Institution of Washington, Washington, D.C., USA. 1911, 57-58.
2
21. Norma Oficial Mexicana NOM-007-RECNAT-1997. Procedimientos, criterios y especificaciones para
3
realizar el aprovechamiento, transporte y almacenamiento de ramas, hojas o pencas, flores, frutos y
4
semillas.
5
22. Mocak, J.; Bond, A.M.; Mitchell S.; Schollary, G. A statistical overview of standard (IUPAC and ACS) and
6
new procedures for determining the limits of detection and quantification: Application to voltammetric
7
and stripping techniques. Pure Appl. Chem. 1997, 69, 297-328, IUPAC recommendation, document
8
550/35/87. DOI: 10.1351/pac199769020297
9
23. Horwitz, W. Evaluation of analytical methods used for regulation of foods and drugs. Anal. Chem. 1982, 54,
10
67A-76A. DOI:10.1021/ac00238a002
11
24. AOAC Peer Verified Methods Programs, Manual on Policies and Procedures, Arlington, VA, 1998.
12
25. Salvucci, M.E.; Coffelt, T.A.; Cornish, K. Improved methods for extraction and quantification of resin and
13
rubber from guayule, Ind. Crop Prod. 2009, 30, 9–16. DOI: 10.1016/j.indcrop.2008.12.006
14
26. Yeom, H; Suh, J.H.; Youm, J.R.; Han, S.B. Simultaneous Determination of Triterpenoid Saponins from
15
Pulsatilla koreana using High Performance Liquid Chromatography Coupled with a Charged Aerosol
16
Detector (HPLC-CAD), B. Kor. Chem. Soc.2010, 31, 1159-1164. DOI: 10.5012/bkcs.2010.31.5.1159