Seasonal Use
_ _ _~_ - - -_--of Soil Water by Mature Velvet
Mesquite
DWIGHT R. CABLE
Highlight: Mesquites used water consistently to a depth of 3 m and outward to 10 m beyond the crowns, but use at 15 m was limited mainly to drier periods when water supplies closer to the trees were depleted. With the start of spring growth, water was extracted most rapidly from the surface layers. As the season advanced, the water- supply zone became increasingly thicker. Rates of extraction were highest immediate- ly after recharge in early spring and early summer, and lowest in late fall. Differences in available water in the soil accounted for 72 to 88% of the variation in rates of extraction. The competitive effect of velvet mesquite on perennial grasses is most severe in the upper 37.5 cm of soil under and near the mesquite crowns, and gradually decreases with distance into adjacent openings. The competitive effect in the openings is much more severe in dry years than in wet years.
Velvet mesquite
(Prosopis juliflora var. veZutin42)competes severely for
soil water with perennial grasses. When
mesquite is killed or reduced in amount,
perennial grass production increases,
sometimes dramatically (Parker and
Martin 1952; Cable and Tschirley
1961; Martin and Cable 1962, 1974;
Cable and Martin 1964).
These results have been attributed to
the extensive lateral root system of
velvet mesquite, which occupies the
same soil mass from which grasses
must obtain their water. The assump-
tion is that mesquite roots exert a
stronger “pull” on the soil water than
do the grasses.
The present study was undertaken to
determine the water use pattern of
mature velvet mesquite at all stages in
the annual growth cycle within a soil
mass 6 m deep extending 15 m hori-
zontally beyond the edge of the tree
crowns.
Water moves from the soil into the
plant roots, and through the plant as
liquid flow in response to gradients in
water potential between the soil and the
-
____--
The author is principal range scientist, Rocky Moun- tain Forest and Range Experiment Station, Forest Service, U.S. Department of Agriculture; central head- quarters maintained in cooperation with Colorado State University at Fort Collins, Colorado. Research reported here was conducted while Cable was at the Station’s Re- search Work Unit at Tucson, in cooperation with Uni- versity of Arizona; he is now with the Unit at Albuquer- que, New Mexico.
The work described was partly supported through the US/lBP Desert Biome Program under Grant CB32 139X from the National Science Foundation.
Manuscript received March 10, 1976.
4
plant root, the plant root and the leaf,
and between the leaf and the air (Slatyer
1967). Resistance to water flow is
greater during entrance into the roots,
where water moves across the cortex,
than to longitudinal
flow in the
xylemelements of the root and stem
(Kramer 1969).
Because of the relatively low resis-
tance to longitudinal movement of
water in the root xylem, water is
absorbed from distances of several
meters as readily as from closer
distances. Thus extraction of water
from the soil tends to be more closely
related to concentration of roots than to
distance from the tree (Kramer 1969).
But because root concentrations gener-
ally tend to decrease with depth in the
soil and with horizontal distance from
the tree, water is usually extracted most
rapidly in the upper part of the root zone
and closer to the trunk. As soil water in
these areas decreases, the zone of
maximum water uptake moves down-
ward
and
outward
(Cowan
and
Milthorpe 1969; Slatyer 1967).
Methods
The study area was located at an elevation of about 1,220 m (4,000 ft) on the Santa Rita Experimental Range south of Tucson, Ariz. Annual precipitation at the study site averages about 37 cm (15 inches) with about 58% falling during the July- September summer growing season. Most of the remainder falls during the December- April winter rainy season. The two rainy seasons are separated by dry periods, with
the May-June drouth being particularly severe (Fig. 1). The soil is Comora gravelly sandy loam in the loamy, skeletel, mixed, thermic family of Cumulic Haplustolls, changing to gravelly clay mostly between 2.5 and 4 m depth.
JFMAMJJASOND
Fig. 1 . Mean monthly precipitation site (51 -year means).
at the study
The relatively high rainfall and sandy soil provide a favorable site for velvet mes- quite. The area supports a stand of about 50 mature trees per hectare (20 trees/acre). Four mature trees, each located at the edge of an opening 20 to 30 m across, were selected for study. These trees were 5-6 m tall, with crowns 8-9 m in diameter. At each study tree, six 5-cm holes were drilled into the ground, each 6 m deep, along one radius from the trunk. Holes 1 to 3 were under the tree crown: near the trunk, midway between the trunk and the edge of the crown, and at the edge of the crown; holes 4 to 6 were located 5, 10, and 15 m beyond the edge of the crown, in the adjacent opening (Fig. 2). Four other trees were killed with diesel oil applied to the base of the trunk, and three holes were drilled, at positions 1, 3, and 5, to provide check data on changes in moisture in soil supporting no live vegetation. Aluminum access tubes were inserted in the holes for a neutron probe. Trees surrounding the openings, and all other vegetation near the holes, were killed so that no live roots other than those of the study trees would be present near the live-tree holes and no live roots of any kind near the dead-tree holes.
Soil water was measured with a neutron probe, calibrated to read percent by vol- ume, at 13 depths from 25 cm to 6 m (25-cm intervals to 2 m; at 2.5, 3, 4, 5, and 6 m).
Fig. 2. Protruding ends of aluminum access tubes, used probe, along a radius from a velvet mesquite tree.
sample soil water content neutron
Measurements were taken at about 2-week intervals between July 197 1 and December 1973, except during the summer of 197 1, when measurements were taken every 3 or 4 days.
For most comparisons, soil water is expressed in terms of “volume percent available,” defined as soil water in excess of the permanent wilting percentage (Slatyer 1967; Meyer and Anderson 1952). For this study, the soil water contents on July 10, 197 1, are assumed to represent permanent wilting percentages. This was at the end of a very dry period, just prior to the start of summer rains, and the trees were obviously stressed for water, as indicated by meager leaf, flower, and fruit develop- ment. These were also the lowest soil water values at most depths for the 2%-year study period. Negative values of available soil water recorded late in 1973 at some depths indicate that the mesquite roots were able to reduce soil water content to slightly below the assumed permanent wilting percent- ages.
For convenience, in referring to water contents in the soil at the various distances from the tree, the convention has been adopted of referencing these distances to the particular “hole(s)” from which the data were obtained.
From the 2%-year record, two periods have been selected to characterize the soil water use regime for velvet mesquite: (1) July-December 197 1; soil water recharge and depletion for a summer of near-normal rainfall, followed by an unusually wet fall, and (2) March-November 1973; soil water depletion during a very dry spring, sum- mer, and fall, following an unusually wet fall and winter recharge period.
Results and Discussion
Initial Conditions
At the start of the study,
inJuly
1971, volume percent water at the
study trees ranged from about 2% at 25
cm to 4.4% at 1 m in the sandier soil, to
over 14% in the deeper clayey soil.
These soil water values were probably
near wilting point at all depths.
Velvet mesquite begins leafing out
between late March and late April, as
shoots elongate. Flower buds develop
during the same period, and the first
pods appear about 5 weeks after flower
buds burst, usually in May at the study
area elevation. Twig elongation and
leaf initiation last 3 to 4 weeks, and
flowering 4 to 6 weeks. Pods mature 7
to 9 weeks after flower
buds burst, in late May or June. Mesquite can flowerand form pods later in the summer if
rainfall is high, but this did not happen
during
the study period.
Leaves
normally begin to yellow and dry in late
fall, and all leaves have usually dropped
by late December.
Precipitation during Study Period Soil Water Changes
The year has been divided into four
seasons for presenting precipitation
data, keyed to the annual growth cycle
of mesquite: (1) January-March: medi-
um precipitation, the major soil water
recharge period, mesquite dormant, (2)
April-June: low precipitation, spring
leafing-out and flowering period, (3)
July-September:
high rainfall, high
temperatures, and rapid soil water use,
and (4) October-December: relatively
dry, cool, ending with winter dormancy.
The
broad pattern of soil water
change shows: (1) recharge during the
winter precipitation period, followed
by (2) periods of high water extraction
during the spring while leaves, stems,
flowers, and fruit are developing, and
during the summer when rainfall is
usually high, and (3) periods of low
water extraction in the fall, when
rainfall and soil water levels are low,
and later in the winter after the leaves
have dropped and the trees are dormant.
Seasonal precipitation totals varied
widely from long-time means during
most of the study period. On an annual
basis, 197 1 averaged 29% above the
long-time mean (for the two seasons
available), and 1972 and 1973 (with
27.5
and 23.3
cm, respectively)
averaged 3 1 and 4 1%) respectively,
below the long-time means (Table 1).
Of the 10 seasons, only two were near-
normal: summer 197 1 and spring 1972.
Five varied from 40 to 99% below the
long-time means, while the other
threevaried from 82 to 107% above the
long-time means.
Phenological Development of Velvet Mesquite
Table 1. Seasonal precipitation (cm) at the study area (inches in parenthesis).
Year and Jan.- Apr.- Jul.- Oct.-
means 1971 1972
Mar. June
- -
0.1 3.2
Sept. 22.5
10.3
Dec.
15.7 13.9
Total
27-5
1973 (10.84)
13.5 1.5 7.1 1.2 23.3
(9.16)
Mean (26::8) 2.4 13.3 10.3 32.8
(.94) (5.24) (4.05) (12.91)
Est. long-time mean 7.4 2.5 22.1 7.6 39.6
8- 25CM
8-
8-
I I I I 1 I
J;ASOND
8-
6-
JJASOND
Fig. 3. Soil water recharge during summer and fall 1971 at 6 soil depths for holes l-4 and at dead trees (monthly averages of vol % available). Recharge
The
amount and degree of recharge
of soil water depend on: (a) amount of
precipitation,
and (b) evapotranspi-
ration rates. Evapotranspiration losses
am due to extraction of water by plant
roots and to surface evaporation, which
in turn is a function mainly of tempera-
ture and humidity. The major recharge
period at the study site is during the
winter rainy period, primarily because
temperatures are low and most plants
am dormant; recharge reached the 3 m
depth at some holes during both winter
recharge periods (
197 1-72and
1972- 73). During the summer rainy sea- son, on the other hand, high temper- atures and high evaporation rates, coupled with rapid extraction byplant roots, severely restrict recharge.
Water reached the 1 m depth at some
holes in the summers of
1971 and I972 butreached only the 50-cm depth
in1973.
Figure 3 illustrates the
rechargepattern at the six live-tree holes and at
the dead trees, for six depths
in the soil,during the
summer of 1971, whenrainfall was near-normal, and during
the folIowing unusually wet fall, when
6
rainfall was 128% above the long-time
mean. The strong impact of soil water
extraction is evident in the greatly
restricted recharge at holes 1 to 3, under
the tree crowns, compared to the
increasing levels of recharge at suc-
cessively farther distances. The re-
stricted recharge was most noticeable
during August and September, when
evapotranspiration demands were high-
est, as shown by maximum differences
between hole 1 and the dead trees of
about 6%. The rates of recharge
increased noticeably with the cooler
temperatures of fall, especially at holes
1 to 4, and particularly with the
near-dormancy
of the mesquite in
December,
when variation among
boies was reduced to 2 to 3%.
Also evident from Figure 3
is thetime lag for water to reach successive-
ly deeper depths, and the influence of
extraction by tree roots in restricting the
downward movement of water. It
should be noted that, although the
December values represent maximum
recharge at depths to
125 cm, with 8%to 10% available water, maximums
were reached successively later at
deeper depths: January at 150 cm,
February at 200 cm, March at 250 cm,
April at 300 cm at the live trees. Also,
the maximums decreased with increas-
ing depth, from a mean of 8.7%
available water at 125 cm in December
to 0.8% in April at 300 cm for live
trees.
Dead-tree
maximums
were
higher (9.8 to 2.6%) and were reached
earlier (December to February) for
depths from 125 to 300 cm. Of course,
the particular level of available soil
water attained after a recharge period,
as illustrated in Figure 3 and later
figures, represents 100% of the soil
water available for plant use at that
particular location until the next re-
charge event.
“Maximums” at the deeper depths
were lower, suggesting only partial
wetting during recharge, because re-
charge reached different depths at the
four study trees, yielding mean values
less than field capacity.
Presenting the 1971 summer re-
charge data as monthly averages (Fig.
3) adequately illustrates the overall re-
charge pattern, but masks short-term
changes. Typically, frequent summer
rains superimposed on a strong and
continuous evapotranspiration demand
result in frequent alternating periods of
recharge and depletion, especially at
the 25cm depth.
Extraction
The year
1973 provided a good
opportunity to study soil water extrac-
tion by velvet mesquite from. growth
initiation in the spring until near-
dormancy in late fall. The conditions
that produced this opportunity
in-
cluded: (1) unusually good soil water
recharge caused by 83% above normal
precipitation
from
October
1972
through March 1973, (2) lack of rain
between March 30 and June 28,
providing an uninterrupted period of
_HOLE 1
D 0 2 4 6 I 8 10 1 I I
HOLE 4
depletion during spring leafing-out and
flowering, and (3) a short, dry summer
rainy season, with essentially no re-
charge below 50 cm, followed by an
even drier fall. As a result, depletion of
the previous winter’s recharge con-
tinued into the fall to the lowest levels
of soil water encountered in the 21/2-
year study period at most holes and
depths.
Even with the unusually high winter
precipitation, water barely reached the
3 m depth at the live trees. The
following discussion will, therefore, be
limited to soil water changes in the
upper 3 m of soil.
Spring growing period. By
March
30, 1973, the winter rains had ended
L
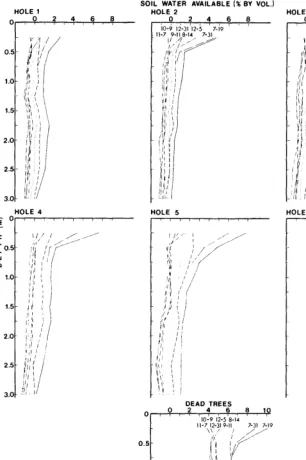
SOIL WATER .ABLE 1% BY HOLE 2
0 2 4 6 8 10
6-21 S-8 r
VOL.) HOLE 3
HOLE 5
I_
DEAD TREES
HOLE 6
D, 0 2 4 6 8 10 1 I b-21 5-8 A-10 6-11 5-24 A-24
/ 3;30
0.5 \I 1
‘4 \ 1 i/ / 1 \ , r’
3.0 - /.i//i /.i 1:
Fig. 4. Profiles of available soil water at successive intervals of approximately 2 weeks during spring
1973, at 6 live-tree holes (HI next to trunk; H6 IS m beyond edge of crown) and at dead trees.
and available water had reached maxi-
mum values at depths down to about
150 cm (Fig.4). At greater depths,
water content continued to increase,
however, reaching maximum values at
most depths by May 8. Water loss
during the period March 30 to April 10
was restricted mainly to the 25cm
depth, and was due almost entirely to
evaporation. By April 10 the mesquite
trees were beginning to grow, and
thereafter a major part of the decrease
in available water was due to extraction
by the tree roots.
Changes in available water during
successive 2-week periods from March
30 to June 21, 1973, show that
extraction was most rapid at the 25cm
depth (Fig. 4). As the season pro-
gressed, increasingly larger amounts of
water were taken from increasingly
deeper depths. Rates of soil water
extraction were highest at most depths
and holes during the period May 8 to
June 11. Most of the soil water used by
the trees during this spring growing
period came from the soil represented
by holes 1 to 5. Losses at hole 6 were
essentially similar to those at dead
trees.
Summer and fall 1973.
Small but
significant amounts of water were
available throughout the profile at the
beginning of the summer rainy season
in July 1973, as a carryover from winter
recharge (Fig. 5). Recharge from the
July rains was restricted almost entirely
to the 25-cm depth. By August 14, the
summer water had been used, and
extractions thereafter were small and
rather uniformly taken from all depths,
as a continuation of the pattern prior to
the
summer rains. These losses appear to be of roughly similar magnitude at live-tree holes 1 to 5 as at the dead trees, suggesting that evaporative forces were removing water from the soil at the dead trees as fast as evaporation plus transpiration were removing water at the live trees. These rates of removal are not directly comparable, however, because more than four times as much water was available at the dead trees as at the live trees on July 19, and the rate of extraction of soil water is strongly dependent on the amount of water present. This relationship is fully discussed in the next section.HOLE 1 0 ,?,?,?,?,!
HOLE 4 g or---
SOIL WATER AVAILABLE (% BY VOL.)
HOLE 5 HOLE 6
Fig. 5. Profiles of available soil water (% by vol) at successive intervals of approximately 4 weeks during summer andfall 1973, at 6 live-tree holes (HI next to trunk; H6 15 m beyondedge of crown) and at dead trees.
at the dead trees. It was only after much
of the soil water had been removed
ftom holes 1 to 5 that the mesquite trees
withdrew water from the farthest
distance.
This pattern of water extraction
during the summer of 1973, when
available water carried over from the
previous winter’s recharge was present
throughout the 3-m profile, contrasts
sharply with the extraction pattern
during the summer of 197
1,when there
was no carryover. The summer of 197 1
was characterized
by only minor
changes in water content below 75 cm
(0.5% or less), and frequent alternating
8
periods of recharge and depletion in the
upper 75 cm.
Carryover of Soil Water from Spring to Summer
Some available soil water was
carried over from spring to summer in 2
of the 3 study years. Recharge precipi-
tation for the fall and winter of 1970-7 1
was less than 50% of the long-time
mean, and there was essentially no
carryover to the summer of 197 1. Re-
charge precipitation for the falls and
winters of 197 l-72 and 1972-73, on
the other hand, were 124 and 183% of
the long-time means, respectively.
Amounts of available soil water carried
over varied between about 1 and 2% for
holes 1 to 3, under the tree crowns, and
4 to 5% at hole 6, 15 m beyond the edge
of the crown. Apparently, in years
when recharge precipitation of the
previous fall and winter is below the
long-time mean, available soil water is
essentially exhausted before the sum-
mer rains begin, but in years when
recharge precipitation is appreciably
higher than the long-time mean, some
soil water is carried over to summer,
particularly in openings between trees.
Relationship Between Soil Water Content and Rate of Extraction
The rate at which water was ex-
tracted from the soil by mesquite roots
was highest when soil water content
was highest and decreased linearly as
soil water content decreased. These
results agree with previous research as
reviewed
by
Slatyer
(1967) and
Gardner ( 1968). The approach adopted
in studying differences in rates of
extraction was to plot available soil
water (means of four trees) against time
for the period from March 30
to Decem-ber 3
1,1973. These curves for
the variousholes and depths showed that
the rate of soil water extraction re-
mained constant for periods varying
from 26 to 12 1 days, depending on
seasonal weather conditions.
Under conditions of high soil water
availability at the start of the spring
constant-use period, the first 50 to 75%
of available water (3 to 5% by volume)
was lost at relatively rapid rates of from
0.20 to 0.05% by vol/day, depending
on hole and depth. The remaining soil
water was extracted much more slowly
during the following summer and
fall-at
rates of from about 0.04 to
0.005% by vol/day. Growth stage of
mesquite appeared to have little effect
on rates of extraction of soil water.
Apparent effects were coincidental.
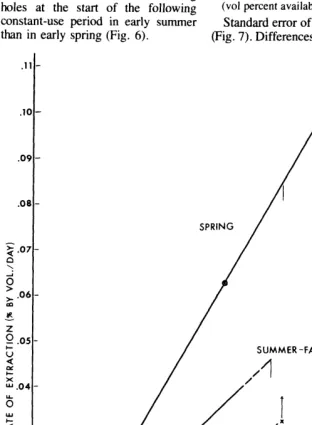
In sur$ace soil.
Soil water extraction
data for four seasons in 1973 at the
25-cm depth illustrate the effects of
evaporation superimposed on those of
water use by the trees (Fig. 6). The
main factors controlling loss of water
were: (1) evaporative forces of the
atmosphere, (2) transpiration demand
by the trees, and (3) supply of water in
the soil.
Losses were highest when the weath-
er was hot and dry, when trees were
growing rapidly or transpiring rapidly,
and when soil water content was high.
.28 - 25-CM DEPTH .26
.24
.20 F % \ .18
I
\ I,’
,’
SPRING z .16-
K
[ i:
. - e
;/ / ;(gsp
a1 d3 /
.06 - LATE SPR,NG HIti2 ,,,,/-~~~‘~ .04 -
3 /
J-i
6’ OLS”
.02 - 2 ey4
HI/*5 / F0 LATE SUMMER
0
0 ; ; A ; ; k 1, ; 9 lb ;, 1’2
WATER AVAILABLE (% BY VOL.)
Fig. 6. Rates of extraction of soil water duringfourperiods of uniform extraction at the 25-cm depth in
1973, related to vol % water available at start of period. Regressions based on holes 1 to 3 for early spring, I to 4for late spring, I to Sfor early and late summer (arrows at certain data points in- dicate reduced extraction at these distances-see text}.
When water was in short supply, however, the rate of extraction was curtailed, regardless of evapotranspi- ration demands.
In early spring (March 30-Apri124) water content was high, and transpi- ration demand was high because of active spring growth. The resulting high rate of extraction reduced the available water about 50% by the end of the early spring period. As a result, the rate of extraction during late spring (April 25-June 11) decreased about 60%) even though evapotranspiration demand increased due to higher tem- peratures and continued active growth of mesquite. By June 11, at the end of the late spring period, available water averaged less than 1% at the four active water-supplying holes.
July rains added from about 2 to 5% to the available supply, and as a result of adequate water and strong evapo- transpiration demands, the average rate of extraction for the early summer
period (July 19 to August 14) was higher, relative to starting volume percent available, than for any other season. By August 14, water supplies were again very low and rate of extraction during the following late summer period (August In-November 7) was the lowest for the year.
At the dead trees, even though water supplies were higher at all seasons than at the live trees, rates of loss were much lower than for similar water contents at live trees and were, of course, due entirely to evaporative processes. And as with the live trees, rates of loss were strongly correlated with water available at the start of constant-loss periods (Fig. 6).
The portion of the water loss at live trees that can be attributed specifically to use of water by the trees, exclusive of evaporative forces, can be approxi- mated on Figure 6 by the vertical distance between the dead-tree rate for a specific season, and the rate for live trees for the same season and same
starting water content. For example, in late spring (LSp) the dead-tree rate of extraction was 0.07% by vol/day, with a starting available water content of 7.7%. A vertical projection of this point intersects the extension of the late spring live-tree regression at 0.117% by vol/day, 67% higher. Similarly, the early summer (ESu) rate of 0.135 at the dead trees (starting vol percent 10.1) intersects the live-tree regression at 0.275, twice the dead-tree rate. Actual evaporation loss at the live trees was probably less than at the dead trees because of shading effect under the cmwns and extraction by the roots of some water that would have evaporated if the roots had not absorbed it. Thus, the amounts attributed to use by the trees, as indicated in Figure 6, are conservative.
The upper 37.5 cm of soil, as represented by the 25-cm depth data, is an important source of water for velvet mesquite. The practical value of these data to rangeland managers is to provide a quantitative basis for the well-documented fact that competition for water between velvet mesquite and perennial grasses is severe. Not previ- ously documented is the fact that this competition is intensified during drier periods, because at these times the mesquite roots are most active in extracting water in the openings be- tween trees. When water supply was high, in early spring, the trees were drawing water primarily from holes 1 to 3, under the crowns, at the 25-cm depth, with decreased extraction at hole 4, and more especially at hole 5 (and no use at hole 6) (Fig. 6). With water supplies reduced about 50% in late spring, hole 4 was also being actively used, and during the rest of the year hole 5 also actively supplied water. Hole 6 received some use during early and late summer, but at a significantly lower rate than holes 1 to 5. This is indicated in Figure 6 by the rate of extraction at hole 6 being higher than the dead-tree rate but lower than the live-tree regression rate at the same starting volume percent available.
because of interception losses, but mostly to the fact that, during the recharge periods prior to the start of the early spring and early summer periods of constant use, water use by the trees was heaviest under the crowns and de- creased with distance beyond the crowns. The residual water contents at the start of the constant-use periods, therefore, were lowest under the crowns and increased with distance. Evapotranspiration was higher during the early summer recharge period than during the early spring recharge period, and more pronounced under the trees than in the openings. This led to greater differences in available water among holes at the start of the following constant-use period in early summer than in early spring (Fig. 6).
.ll -
JOI-
.09 -
.08 -
5.07- Q \ . 6 ’ 06- 26;’ E 6.05- 4 E
X
u.o4-
5 lu
5.03-
.02-
.01 -
In deeper soil layers. At soil depths below about 75 cm, the relationship between amount of available water and rate of extraction is simpler, because evaporative influences are small or absent. Thus, a single equation de- scribes the relationship during summer and fall for a relatively large part of the soil mass occupied by the mesquite toots-75 to 300 cm depths and holes 1 through 5--and for most of the crop year. During these periods available water did not exceed about 5% and rates of extraction were less than 0.05% by vol/day (Fig. 7). The relationship was:
Rate of extraction = 0.0090 + 0.0063 (vol percent available at start of period).
Standard error of estimate is 0.0029 (Fig. 7). Differences in volume of water
Fig. 7. Rates of extraction of soil water at deeper depths (125-300 cm for spring, 75-300 cm for summer-fall) for holes I-5, in 1973, related to ~01% water available, compared with losses at dead trees (all seasons, 100-300 cm).
available at the start of a constant-use period accounted for 88% of the variation in rate of extraction among holes and depths. Since losses of soil water during the summer and fall of 1973 were negligible at the dead trees when available water was less than about 4%, essentially all soil water losses below 4% available at depths below 75 cm at the live trees can be attributed to extraction by mesquite roots (Fig. 7).
The relationship between rate of extraction and available water followed no consistent pattern at hole 6 because the use of water at this distance was largely determined by the availability of water at closer distances.
During the spring of 1973 relation- ships differed among depths, in con- trast to the uniformity of response among depths during the drier summer and fall. Starting water contents at depths below 100 cm were relatively high, mostly between 3 and 9% at holes 1 to 5, and rates of extraction were also relatively high (mostly 0.055 to 0.095% by vol/day). Here, again, differences in starting available water volumes accounted for about 88% of the differences in rates of extraction during the period for individual depths. At depths of 50 to 100 cm, available soil water and rates of extraction both varied within such narrow limits that regressions were not meaningful. Both averaged somewhat higher than for the 125- to 300-cm data.
The portion of the water loss at the deeper depths that can be attributed to the mesquite trees can be approxi- mated, as with the 25-cm data, by comparing the regressions in Figure 7 for similar starting water contents. Thus, in the spring period the dead-tree extraction rate averaged about one- fourth the live-tree rate, as shown by a vertical projection of the dead-tree available water content of 8.2% to the spring regression line in Figure 7. Similarly, during the summer-fall peri- od, the dead-tree rate of extraction was only 30% of the live-tree rate.
The greater dependence of the mes- quite trees on hole 6 during summer and fall of 1973, is shown in Figure 8. Data for the lOO-cm depth illustrate that, when soil water was abundant (spring), the mesquite obtained essentially all of its water from the first 5 holes. As this moisture was depleted in early sum- mer, the rate of extraction at hole 6 began to increase; hole 6 was then the
I 1
’ APR 1
, 4 ! ,
MAY ( ;“N ( JUL ’ i AIG ‘1 ;EP ‘I ‘Ok)’ NOV ’
Fig. 8. Increasing dependence on hole 6 (1.5 m beyond edge of crown) for water as soil water closer to the trees is depleted (j-period moving average rate of extraction, IOO-cm depth, April to December, 1973).
major source of water during the dry summer and early fall. Data for other depths showed a similar pattern.
The data presented in Figures 7 and 8, however, do not fully reflect the importance to mesquite of the water supplies present at the farther distances (holes 5 and 6). For example, at 20 m from the trunk of a tree, a 1 -m wide ring of soil around the tree contains twice the volume per unit of depth as a l-m wide ring of soil 10 m from the trunk. Thus, a given measured rate of extrac- tion will result in the absorption of twice as much water 20 m from the tree as at 10 m. The actual importance of water supplies at the farther distances is therefore greater than indicated by extraction rates alone.
Summary and Conclusions
Soil water contents (% by vol) were measured by neutron probe at 13 depths from 25 cm to 6 m at six locations along one radius from each of four velvet mesquite trees (hole 1, next to the trunk; hole 6, 15 m beyond the edge of the crown, in an adjacent opening). Surrounding vegetation was killed so that the only live roots present were those of the study trees. Measurements were made under similar conditions near four similar trees that were killed, with no live roots of any kind near the
access holes. Measurements were
taken for 2% years, 3 summers and 2 winters, at about 2-week intervals.
Within this 21/2-year study period, the soil water use regime for velvet mesquite is characterized by: (1) soil water recharge and depletion data for a summer of near-normal rainfall, and (2) depletion data during a very dry spring, summer, and fall following an
unusually wet fall and winter recharge period.
Results are interpreted as follows: 1. Winter precipitation is much more effective in recharging the soil profile than is summer precipitation. Winter recharge reached a maximum depth of about 3 m-highest at the 25-cm depth, decreasing with each successively greater depth. High evap- otranspiration demands prevented per- colation below about 1 m during the summer rainy period.
2. Essentially all available soil wa- ter from winter recharge is used before the end of the May-June drought, except in years when winter precipita- tion is appreciably higher than the long- time mean. In such years, carryover of soil water from spring to summer is higher in openings between trees (to 4 to 5% at hole 6) than under mesquite crowns ( 1 to 2%).
3. Soil water is extracted most rapidly where and when available soil water is highest-usually at the 25-cm depth immediately following precipita- tion periods. Varying amounts of available soil water accounted for 72 to 88% of the variation in extraction rates.
4. Stage of growth of the mesquite, during the leaf-bearing period, has little effect on rates of extraction of soil water.
5. Evaporation affects losses pri- marily at the 25-cm depth, and to a much lesser extent at the 50-cm depth.
6. Roots of the mesquite trees ex- tend out to at least 15 m beyond the edge of the crowns, but water is used at this distance primarily during drier periods when water supplies closer to the tree are depleted.
7. The trees consistently use water
from next to the trunk out to 10 m beyond the edge of the crown. Rates of extraction are generally similar over this distance, for a given depth and similar amounts of available soil water.
8. When soil water levels are high, following recharge, extraction is in- itially highest at shallow depths, and successively greater depths are added to the active water supplying layer as the growing season advances. In con- trast, when levels of available soil water are low, rates of extraction are also low and are similar throughout the profile.
9. The upper 37.5 cm of soil (as represented by the 25-cm data) is an important source of soil water for velvet mesquite, and also is the major source of water for perennial grasses. Mesquite has the competitive advan- tage. This competitive effect extends into adjacent openings to at least 15 m beyond the edge of the crowns, but is most severe nearest to the crowns, gradually decreasing with increasing distance. The competitive effect in the openings is much more severe in dry years than in wet years.
Literature Cited
Cable, Dwight R., and S. Clark Martin. 1964.
Forage production and stocking rates on south- em Arizona ranges can be improved. U.S. Forest Serv. Res. Note RM-30, 11 p. Rocky Mountain Forest and Range Exp. %a., Fort Collins, Colo.
Cable, Dwight R., and F. H. Tschirley. 1961.
Responses of native and introduced grasses following aerial spraying of velvet mesquite in southern Arizona. J. Range Manage. 14: 155-159.
Cowan, I. R., and F. L. Milthorpe. 1968.
Plant factors influencing the water status of plant tissues. p. 137-193. In: T. T. Kozlowski (Ed.) Waterdeficitsandplantgrowth. Academ- ic Press, New York. 390 p.
Gardner, W. R. 1968. Availabilityandmeasure- ment of soil water. p. 107-135. In: T. T.
Kozlowski (Ed.) Water deficits and plant growth. Academic Press, New York. 390 p.
Kramer, Paul J. 1969. Plant and soil water re- lationships. McGraw-Hill Book Co., New York. 482 p.
Martin, S. Clark, and Dwight R. Cable. 1962.
Grass production high 14 years after mesquite control. Arizona Cattlelog 18( 12):58-6 1.
Martin, S. Clark, and Dwight R. Cable. 1974.
Managing semidesert grass-shrub ranges- vegetation responses to precipitation, grazing, soil texture, and mesquite control. U.S. Dep. Agr. Tech. Bull. 1480. 45 p.
Meyer, Bernard 8, and Donald B. Anderson. 1952. Plant physiology. 2nd Ed. D. Van Nostrand Co., Princeton, N.J. 784 p.
Parker, Kenneth W., and S. Clark Martin. 1952. The mesquite problem on southern Arizona ranges. U.S. Dep. Agr. Circ. 908. 70 p.
Plains Pricklypear Is a Good Forage for Cattle
M.
C. SHOOP, EJ.
ALFORD, AND H. F. MAYLANDHighlight: Singed plains pricklypear was assessed as a cattle forage. In an 84.day feeding trial, six pairs of heifers were individually fed a basal ration of bay and cottonseed meal at 2.3% of initial bodyweight. One heifer in each pair also ate singed pricklypear offered ad Iibitum. Pricklypear increased total dry matter consumption 43% and weight gain 72%. The heifers experienced no digestive problems during the trial or ensuing 60 days on pricklypear range. Chemical analyses and microdigestion trials indicated that digestibility of pricklypear was equal or superior to that of high quality alfalfa hay. Pricklypear contained about 40% m,xe soluble carbohydrates than alfalfa hay, but contained only 3.4% digestible protein. Therefore, rations eon- tainting pricklypear would usually require protein supple- mentation. We concluded that singed pricklypear was a palatable and nutritious feed and should be evaluated as an additional forage on shortgrass range.
Most cattlemen operating under range conditions on the shortgrass plains of Colorado cannot successfully calve replacement heifers as 2.year-olds @hoop and Hyder 1976). However, successful calving of heifers at 2 years of age instead of 3 years can increase calf production on a ranch about 10% (Pinney et al. 1972).
Heifers need to weigh at least 272 kg (600 lb) at breeding and 363 kg at calving for successful calving and rebreeding as 2- year-olds (Bond and Wiltbank 1970; Wiltbank 1972; Clanton
1973). To meet these weight criteria, weaner heifers produced on shortgrass range must gain about 0.38 kg/day more during winter than is typical at present (Shoop and Hyder 1976). However, most ranchers on shortgrass range must buy energy feeds if they want to improve rate of gain of replacement heifers. Many have found this uneconomical.
Over 560 kg/ha (500 lb/acre) of plains pricklypear (Opunfia
polyacantha Haw.) dry matter occur on some range sites in
northeastern Colorado (D. N. Hyder private communication). Currently, plains pricklypear is regarded to be essentially worthless as a livestock forage, is a nuisance to man and beast,
and is a barrier that prevents cattle from grazing a considerable portion of the herbage (Bement 1968) (Fig. I).
Cattlemen have successfully fed various species of prickly-
par (Opuntia spp.) for many years, bath as a drouth feed and as
aforage(Griffiths 1905;Griffiths 1912;Woodwardetal. 1915).
The Opuntia species that have been analyzed for nutrient
contents are high in energy and low in protein (National Research Council (NRC) 1970). However, we were unable to fund any analyses or feeding trial results for plains pricklypear, even though ranchers had fed it to cattle.
The purpose of this study was to evaluate plains pricklypear (hereafter, pricklypear) as a forage and as a potential energy source for hastening growth of replacement heifers.
Materials and Methods
Experimental Area
We conducted the study on the Central Plains Experimental Range located 61 km (38 miles) northeast of Fort Collins, Colorado. An- nual precipitation averages 31 cm (12.2 inches), 85% of which falls during the growing season, April through October. Range sites are mostly loamy plains and sandy plains. Blue grama (Boure- loua gracilis) is the dominant forage species.
Feeding Trial
Twelve yearling heifers were placed in individual drylot pens in a paired experimental design. The heifers were paired according to ownership, previous 2.month gains, conformation, breed, and weight; and were then assigned at random to treatments. They averaged 249 kg shrunk weight at the start of the trial.
Table 1. Average weight gain and feed intake of heifers pear ration and of heifers fed only the basal diet. *
fed prickly- Feed Analyses
Item
Basal ration plus pricklypear
6
Basal ration
Heifers (number)
Initial weight 9/2/74 (kg) 254
6 242 Fiial weight 1 l/25/75 (kg)
Daily feed intake (kg) Basal ration:
Hay pellet
Cottonseed meal (4 1% cp) Crested wheatgrass hay
Sub-total Pricklypear
Total
Daily gain (kg) Feed intake (kg/kg) gain
310
5.15 0.30 0.41
5.86 2.53
8.39
.67 a 12.5 c
275
4.98 0.30 0.41
5.69 -
5.69
.39 b 14.6 d
- ‘Means on the same line followed by different letters differ significantly at I% level (a,b)
or 5% level (c,d).
range. The small amount of crested wheatgrass hay was included to alleviate lack of cud chewing, chewing of corral fences, and grinding of teeth that existed prior to its addition.
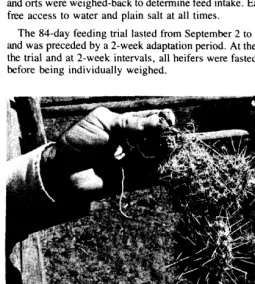
One heifer in each of the six pairs received singed pricklypear in addition to the basal ration. The pricklypear was gathered daily with a hand rake and was singed in a metal tank with a propane weed burner until its spines no longer felt sharp when touched (Fig. 2). After the pricklypear was singed, it was fed to the heifers without further processing.
1
The heifers received their basal ration in equal morning and evening feedings and pricklypear ad libitum. All feeds were weighed when fed and arts were weighed-back to determine feed intake. Each heifer had free access to water and plain salt at all times.
The 84-day feeding trial lasted from September 2 to November 25 and was preceded by a 2-week adaptation period. At the beginning of the trial and at 2-week intervals, all heifers were fasted for 12 hours before being individually weighed.
Fig. 2. Untreated pricklypear pads (above) and singed pads (below).
Samples of the singed pricklypear being fed were collected daily during the feeding trial, cornposited into monthly aliquots(September, October, and November), and analyzed for nutrient composition. Samples of the grass-hay pellets and alfalfa hay (Medicago sativa; sun-cured, earlybloom) were also analyzed. The alfalfa hay was used as a standard of comparison for the feeds in the feed analyses and was not fed.
Additional pricklypear samples were collected monthly after completion of the feeding trial to study the effect of season on dry matter content and mineral composition. Samples were dried at a temperature of 65°C for 72 hours to minimize chemical changes (Van Soest 1965; Danley and Vetter 197 I).
As part of the nutrient analyses, samples were analyzed for neutral detergent fiber (NDF), acid detergent fiber (ADF), and acid detergent lignin (ADL) by the procedures outlined by Van Soest and Wine ( 1967) and Goering and Van Soest ( 1970).
Two microdigestion trials were conducted with the feeds to estimate their apparent dry matter digestibility (DMD). These included a one-stage in vitro digestion trial and an in vivo nylon bag trial. A 6-year-old Charolais cow fitted with a IO-cm rumen fistula was used
for the in vivo trial and as a source of rumen fluid for the in vitro trial. The cow was maintained on a diet of blue grama grass and a daily protein supplement of about 400 g of 41% protein cottonseed meal. In vitro dry matter digestibility (IVDMD) was determined by using the first-stage procedure of Tilley and Terry (1963), as modified by Bigelow and Heflin. ’ Samples were analyzed in sextuplicate.
In the in vivo trial, nylon-bag-dry-matter digestibility (NBDMD) was determined as described by Van Dyne ( 1962). Samples of each feed were analyzed in quadruplicate for each of two time periods of digestion. Half of the samples were removed from the cow after 16 hours of digestion and half were removed after 48 hours.
The DMD of each feed was calculated using the equation for pre- dicting DMD described by Van Soest (1967):
DMD = 0.98 S + W 147.3 - 78.9 Log L -12.9 100
Where:
S = % neutral detergent solubles (cell contents) W = % cell walls (NDF)
L = % lignin in ADF [=(ADL/ADF)x 1001
Nitrogen was determined by micro-Kjeldahl analyses and a factor of 6.25 was used for calculating crude protein (A.O.A.C. 1970). Energy contents were determined by adiabatic bomb calorimetry. All feed weights are reported on an oven-dry basis. Units of measure are frequently expressed with their standard deviation.
Results and Discussion Feeding Trial
Pricklypear was a palatable feed (Fig. 3). Individual heifers often ate the pricklypear before eating the hay pellets. The heifers fed pricklypear consumed an average of 2.53 2 0.59 kg of pricklypear daily in addition to consuming all of their basal ration, 5.86 2 0.73 kg (Table 1). Total daily dry matter intake by the heifers fed pricklypear averaged 3.0% of body weight. This intake compared favorably with normal intake of high quality alfalfa hay (Crampton and Harris 1969). Even con- sidering that the pelleted portion of the basal ration probably allowed increased dry matter intake (Maynard and Loosli
1969), singed pricklypear was a highly palatable forage. The only major factor that influenced voluntary intake of pricklypear was degree of burning of pads during singeing. All heifers promptly rejected pricklypear with spines remaining.
Fig. 3. Heifers ate singed pricklypear readily.
However, the glochids (minute hair-like spines), which fre- quently escaped burning, did not affect consumption. Heifers seemed to prefer just enough burning to remove all large spines. A minor factor that reduced pricklypear consumption was the accumulation of soot on pricklypear. The soot accumulated during singeing whenever an excessive amount of grass and forbs was gathered with the pricklypear.
Pricklypear did not cause any apparent digestive disturbances during the trial or succeeding 60 days, even though the glochids appeared in the feces and seemed to be completely undigested. Following the feeding trial, the heifers grazed native range for 60 days. Although pricklypear was abundant, the heifers did not feed on it. In a listing of the disadvantages of Opuntiu in most areas of Texas, Hoffman and Dar-row (1955) stated that cattle often continued to eat it after burning stopped. However, refusal of our heifers to eat pricklypear with spines indicated that cattle fed at least a maintenance ration will not tend to eat unsinged pricklypear. Kearns (1952) reported similar results with other species of Opuntia in southern Texas, and indicated that not until cattle are tortured by hunger will they feed on Opuntia with spines.
Eight days after the start of the trial, we observed blood in the feces of the heifers fed only the basal ration. Fecal examinations revealed the presence of 60 to 430 eggs per gram produced by the Trichostrongyloid group of nematodes. In contrast, the feces of only one of the heifers fed pricklypear contained eggs, and the egg content of that was only 40 per gram.
The bloody feces ceased 6 days after starting, and after treatment with worming medicine, sulfas, and antibiotics. However, the blood was not due to nematode infestation. Instead, it was tentatively identified as being due to bovine virus diarrhea (BVD). The heifers fed pricklypear showed no symp- tons of BVD, probably because of somewhat better physical and nutritive condition. However, we do not know why the heifers fed pricklypear were essentially free of the nematode eggs. Heifers fed pricklypear in addition to the basal ration gained about 72% faster than heifers fed only the basal ration (Table 1). Also, heifers fed pricklypear were about 17% more efficient in converting feed to body gain than those fed only the basal ration. Total weight gains were related to total feed intake.
Table 2. Protein and energy concentrations of singed pricklypear, grass- hay pellets, and alfalfa hay standard. I
Hay Alfalfa Constituent Pricklypea? pellets2 hay
Crude protein (CP) (%) 5.3 b 5.7 b 16.8 a Digestible protein (DP) (%) 3.4 b 3.0 b 11.4 a Gross energy (GE) (Meal/kg) 4.75 a 4.01 b 4.87 a Digestible energy (DE) (Meal/kg) 2.61 a 2.08 b 2.64 a
‘Means on the same line followed by different letters differ significantly at 5% level. “Sampled daily during 84-day feeding trial and compiled into three monthly aliquots.
Feed Analyses
Protein
Crude protein and digestible protein (DP) concentrations of pricklypear were less than one-third that of alfalfa hay, but about equal to those of the grass-hay pellets (Table 2). Young cattle and brood cows require 4 to 9% dietary digestible protein (NRC 1970). Pricklypear contained only 3.4% digestible pro- tein. Therefore, a ration in which pricklypear was an appre- ciable component would require a protein supplement.
Energy
Pricklypear contained 2.6 Meal of digestible energy per kilogram, the same amount as alfalfa hay (Table 2). Mature grama grasses (Bouteloua spp.; aerial part, fresh) contain only about 1.6 Meal of digestible energy per kilogram (Crampton and Harris 1969). Therefore, the addition of pricklypear to the diet of cattle grazing dormant blue grama would appreciably increase their energy intake.
Minerals
The pricklypear samples contained some dust held by wrinkles of the epidermis. This was especially true of samples collected during dry weather and winter. An element in dust may be partially available to cattle, or might complex with other minerals in the digestive tract, depending on incompletely understood variables (Healy 1973).
Phosphorus content of pricklypear was about 25 to 50% of the 0.18 to 0.43% required in cattle diets (NRC 1970; Table 3). Also, the calcium:phosphorus ratio of about 36:l departed greatly from an optimum ratio of 2: 1 and even from a ratio of 7:1, which has been reported to be within satisfactory limits for cattle (NRC 1970). Consequently, rations with appreciable amounts of pricklypear would usually require phosphorus supplementation. The low sodium content of pricklypear would not normally be a problem if livestock salt was supplied. The concentrations of the other minerals analyzed (Table 3) appear to be within limits that would not normally lead to either deficiency or toxicity.
Table 3. Average mineral composition of singed plains pricklypear collect- ed monthly during winter and summer. ’
Mineral Winter Summer
Nitrogen (%) 0.742 0.09 0.74-t 0.09 Potassium (%) 1.88* 0.54 I.652 0.11 Magnesium (%) 0.77-t 0.08 0.85-e 0.06 Calcium (%) 3.642 1.01 3.382 0.29 Phosphorus (%) 0.102 0.01 0.10-t 0.01 Iron (%) 0.122 0.01 0.09-c 0.02 Sodium (%) 0.022 0.00 0.02-t 0.00 Manganese (ppm) 149 +30 266 rt94 Copper (ppm) 8.3 + 3.5 10.9 +- 1.8 Zinc @pm) 25.8 + 4.2 30.5 2 9.2
‘Some dust contamination is inherent in this feed, especially when soil is dry and during winter. Winter = Dec.-Apr.; Summer = May-&t. Standard deviation indicates varia- bility among months.
Table 5. Dry-matter digestibility (%-eS.D.) in vivo (NBDMD) and in vitro (IVDMD) of singed pricklypear, grass-hay pellets, and alfalfa hay standard.’
NBDMD IVDMD -
Feed
16 hour incubation
48 hour incubation
96 hour incubation
Pricklypea? Hay pellets2 Alfalfa hay
52.9k1.7 a 39.322.8 c 44.5kO.5 b
66.423.8 a 54.1rt1.4 c 62.921.1 b
63.820.6 a - 53.0t 1.4 b 63.7k2.2 a
_
Van Soest analyses
The Van Soest analyses generally indicated that pricklypear was a readily digestible forage. As compared to alfalfa hay, pricklypear contained only about 85% as much neutral detergent fiber, 70% as much acid detergent fiber, 80% as much acid detergent lignin, and 15% as much cellulose (Table 4). How- ever, pricklypear contained about 80% more ash, 10% more soluble portion, 55% more hemicellulose, and 40% more soluble carbohydrates than alfalfa hay.
The high level of soluble carbohydrates in pricklypear indicated that it has a readily available source of energy, which may combine efficiently with nonprotein nitrogen during di- gestion by cattle. If a pricklypear diet could be effectively sup- plemented with nonprotein nitrogen, crude protein could be elevated to correct the deficiency. Belasco et al. ( 1958) found that the nitrogen deficiency of pricklypear (species not speci- fied) could be compensated for by foliar application of an aqueous solution of urea, a common source of nonprotein nitrogen.
‘Means in the same column followed by dtfferent letters differ significantly at 5% level. ‘Sampled daily and compiled into three monthly aliquots.
Pricklypear and alfalfa hay did not differ significantly in dry matter digestibility in the 96-hour in vitro trial. However, in the 48hour nylon-bag trial, pricklypear was slightly higher (3.5 percentage points) in dry matter digestibility than alfalfa hay. The NBDMD and IVDMD of grass-hay pellets were about 11 percentage points lower than that of pricklypear (Table 5).
Application of the digestion-prediction equation of Van Soest (1967), showed average dry matter digestibility values for pricklypear, grass-hay pellets, and alfalfa hay of 61%, 52%, and 60%, respectively. This compares to IVDMD values of 63.8%, 53.0%, and 63.7%, respectively. Thus, the results of the chemical analyses agreed well with those of in vitro analyses.
Seasonal variation
Dry matter content of pricklypear was lowest in June (14.6%). It progressively increased to a high of 45.8% in February (Fig. 4). Apparent dry matter digestibility decreased from September through January at the same time that dry
50
Table 4. Chemical composition (%) of singed pricklypear, grass-hay pellets, and alfalfa hay standard. ’
Hay Alfalfa Constituent Pricklypear pellets’ hay
Total ash 13.5 a 7.5 b 7.5 b Neutral detergent fiber (NDF) 34.0 c 63.1 a 39.6 b Acid detergent fiber (ADF) 23.3 c 41.6 a 32.6 b Acid detergent lignin (ADL) 7.8 b 8.1 b 9.5 a Soluble portion 66.0 a 36.9 c 60.5 b Hemicellulose,’ 10.7 b 21.5 a 7.0 c Cellulose’ 2.0 c 26.1 a 15.6 b Soluble carbohydrates’ 60.6 a 31.2 c 43.7 b
‘Means on the same line followed by different letters differ significantly at 5% level. %u-npled daily and compiled into three monthly aliquots.
‘NDF minus ADF.
‘ADF minus ADL minus ash. ‘100 minus NDF minus CP.
Digestibility
Digestion of pricklypear was more rapid than that of either hay pellets or alfalfa hay (Table 5). Of the total digestion of pricklypear during 48 hours of incubation, 80% occurred within
16 hours, whereas only 73% and 7 1% occurred within 16 hours for hay pellets and alfalfa hay, respectively. Greater digestion of pricklypear within 16 hours means faster digestion and indicates more rapid passage through the digestive tract. More rapid passage allows greater feed intake and improved animal gain as compared with a feed otherwise having the same nutritive qualities (Church 1975).
40
h
o\o
(r 30
W l- t-
:
20
>
E
IO
0
~lSlOlNlDlJIFIMIAIMIJI
JI
MONTH
z o\
- 65 >r + .- .- D .- ; 60
Q) CT .- cl
; 55 c +
r”
6 50
+ - - - IVDMD (96 hr. incubation) - .-.’ NBDMD (48 hr. incubation) - NBDMD (16 hr. incubation)
September November January
Fig. 5. Apparent dry matter digestibility of plains pricklypear by nylon bag (NBDMD) and in vitro (IVDMD) methods. Means for given incubation method with difSerent letters d@er significantly at 5% level.
matter increased (Figs. 4 and 5). However, no other analyzed constituent changed appreciably from September to January (Fig. 6 and Table 6), nor did the digestion prediction equation (Van Soest 1967) indicate a decrease in digestibility from September through January.
Conclusions
We concluded that singed plains pricklypear is a palatable and nutritious cattle feed. Therefore, it should be evaluated as an addition to the normal winter feed of shortgrass range. It may be especially valuable for speeding the growth of replacement heifers so they can be bred as yearlings. Because of its relatively high content of soluble carbohydrates, the feeding of prickly- pear might make the use of nonprotein nitrogen supplements feasible on shortgrass range. The value of pricklypear control must be determined more completely because it bears on the
Table 6. Chemical composition (5%) of singed plains prickiypear during September, October, and November.’
Total ash 13.0 b 12.7 b 14.9 a Neutral detergent fiber (NDF) 32.8 b 35.7 a 33.7 b Acid detergent fiber (ADF) 22.9 a 23.9 a 23.2 a Acid detergent lignin (ADL) 8.3 a 7.4 a 7.7 a Soluble portion 67.3 a 64.3 b 66.4 ab Hemicellulose 9.8 a 11.8 a 10.4 a Cellulose 1.7 a 3.8 a 0.7 b Soluble carbohydrates 61.8 ,a 58.7 b 61.5 a
‘Mean5 on the same line followed by different letters differ significantly at 5% level.
16
5.0,
-
0
E 4.0. c ._ al c
0 &
3.0.
<
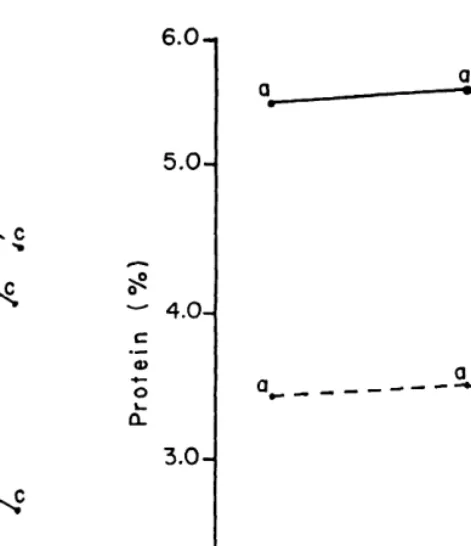
. . Crude protein
.- - - - ,Digestible protein
September November January
Fig. 6. Crude protein and digestible protein of plains pricklypear during September, November, and January 1974-75. Means for given protein with difSerent letters difSer significantly at 5% level.
economy of feeding pricklypear. The high gains made by the heifers fed pricklypear in addition to the basal ration, plus the evidence of rapid digestion of its energy fractions, appear to warrant research to develop prototype machinery and other methods for singeing pricklypear for converting it to a forage to be fed on the range.
Literature Cited
Association of Offtcial Agricultural Chemists (A.O.A.C.). 1970. Official methods of analysis. 1 lth ed. Ass. Offic. Agr. Chem., Washington, D.C. 957 p.
Relasco, I. J., M. F. Gribbins, and D. W. Kollerman. 1958. The response of rumen microorganisms to pasture grass and pricklypear cactus following foliar application of urea. J. Anim. Sci. 17:298-303.
Rement, R. E. 1968. Plains pricklypear: Relation to grazing intensity and blue grama yield on Central Great Plains. J. Range Manage. 21:83-86.
Bond, James, and J. N. Wiltbank. 1970. Effect of energy and protein on es&us, conception rate, growth and milk production of beef females. J. Anim. Sci. 30:438-444.
Church, D. C. 1975. Digestive physiology and nutrition of ruminants, I. 2nd ed. Distributed by 0 & B Books, Corvallis, Ore. 673 p.
Cianton, D. C. 1973. Developing of replacement heifers. Proc., the range beef cow: A symposium on production, III. Dec. 17-19, 1973, Rapid City, S. Dak. Univ. of Nebraska, Lincoln. p. 51-63.
Crampton, E. W., and L. E. Harris. 1969. Applied animal nutrition. 2nd ed. W. H. Freeman and Company, San Francisco, Calif. 749 p.
Danley, M. M., and R. L. Vetter. 1971. Changes in carbohydrate andnitrogen fractions and digestibility of forages: Methods of sample processing. J. Anim. Sci. 33:1072-1077.
Goering, H. K., and P. J. Van Soest. 1970. Forage fiber analyses (apparatus, reagents, procedures, and some applications). U.S. Dep. Agr., Agr. Hand- book No. 379. 12 p.