Simulation-Time Security Margin Assessment
against Power-Based Side Channel Attacks
Alessandro Barenghi
DEI - Dipartimento di Elettronica e InformazionePolitecnico di Milano Via Ponzio 34/5, 20133 Milano, Italy
[email protected]
Gerardo Pelosi
DEI - Dipartimento di Elettronica e InformazionePolitecnico di Milano Via Ponzio 34/5, 20133 Milano, Italy
[email protected]
Francesco Regazzoni
ALaRI - University of LuganoVia Buffi 13, 6900 Lugano, Switzerland
[email protected]
ABSTRACT
A sound design time evaluation of the security of a digital device is a goal which has attracted a great amount of research effort lately. Common security metrics for the attack consider either the theo-retical leakage of the device, or assume as a security metric the number of measurements needed in order to be able to always re-cover the secret key. In this work we provide a combined security metric taking into account the computational effort needed to lead the attack, in combination with the quantity of measurements to be performed, and provide a practical lower bound for the security margin which can be employed by a secure hardware designer. This paper represents a first exploration of a design-time security metric incorporating the computational effort required to lead a power-based side channel attack in the security level assessment of the device. We take into account in our metric the possible presence of masking and hiding schemes, and we assume the best measurement conditions for the attacker, thus leading to a conservative estimate of the security of the device. We provide a practical validation of our security metric through an analysis of transistor-level accurate power simulations of a 128-bit AES core implemented on a 65 nm library.
Categories and Subject Descriptors
C.3 [Special-Purpose and Application Based Systems]: Micro-processor/microcomputer applications; C.5.3 [Computer System Implementation]: Microcomputers—portable devices; E.3 [Data Encryption]: Standards (AES)
General Terms
SecurityKeywords
Side-Channel Attacks, Security Metrics, Design Time Security Evaluation, Correlation Power Attack, Secure Hardware
Permission to make digital or hard copies of all or part of this work for personal or classroom use is granted without fee provided that copies are not made or distributed for profit or commercial advantage and that copies bear this notice and the full citation on the first page. To copy otherwise, to republish, to post on servers or to redistribute to lists, requires prior specific permission and/or a fee.
WESS ’12October 11, 2012, Tampere, Finland.
Copyright 2012 ACM XXX-X-XXXX-XXXX-X/XX/XX ...$10.00.
1.
INTRODUCTION
Side channel attacks based on power consumption analysis are a well known and practical threat to the security of real world imple-mentations of cryptographic primitives. Among the possible im-plementations, the ones where it is harder to mitigate an effective attack after it has been discovered are surely the ASIC ones, as it is not possible to change the on-die circuit to patch a vulnerability after it has been exposed to the public. To this end, the designers of secure ICs perform extensive testing of the prototype chips in order to determine their resistance against side-channel attacks. How-ever, performing post tape-out tests implies providing a feedback on the effective security margin of the device in the late stages of the design and production flow. It is thus desirable to have a met-ric, applicable at design time, providing a conservative bound for the security margin provided by an implementation, possibly ex-pressed in terms of the computational effort required in order to overcome the protection provided by it. The idea of quantifying the computational effort required by a side-channel attack to suc-ceed allows the designer to tune the amount of countermeasures in such a way that, even assuming the attacker is able to perform extremely precise measures of the side-channel of interest, even in ideal conditions, he is not able to effectively crack the cryptosys-tem. This point of view is becoming more and more of interest as cheap, off-the-shelf massively parallel architecture are becoming more and more common, providing effective platforms to perform large-computational effort cryptanalyses [1, 2, 4]. This in turn pro-vides room to lead side-channel attacks employing a large number of key hypotheses, which were previously thought to be “very hard” in qualitative terms. To this end, this work provides a tentative met-ric to gauge the security margin of a cryptographic device against power analysis based side-channel attacks at simulation time, as-suming conservatively an attacker able to perform perfect measure-ments, and in full knowledge of the circuit implementation. For this scenario we provide computational complexity bounds and a sound estimate of the number of measurements needed in order to effec-tively extract the secret key embedded in the secure device, given a chosen statistical confidence.
provides the security evaluation of the case studies evaluating their base resistance against side-channel attacks, and the level of pro-tection needed to reach an 80-bit security level against side-channel attacks. Finally, Section 6 draws our conclusions.
2.
POWER CONSUMPTION MODELING
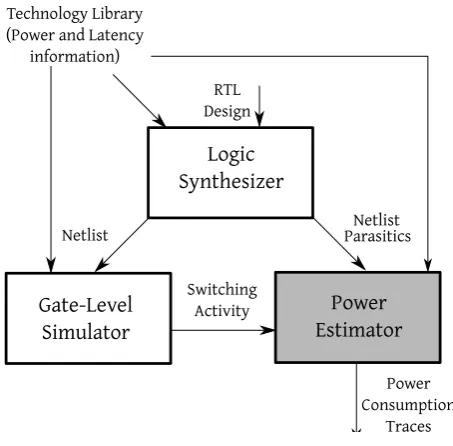
Willing to provide a design time metric for the security of a chip, we will focus on simulation-time evaluation of the informa-tion leakage from a cryptographic circuit. This choice is justified by the capability to provide instrumental noise-free data regarding the power consumption of a circuit, with a timescale beyond the one measurable with current state of the art instruments, in turn imply-ing a conservative estimation of the security margin provided by the actual implementation. To this end, we recall briefly the typical simulation flow employed to obtain power consumption estimates from a RTL specified chip design. The typical simulation flow, de-picted in Figure 1 involves as inputs the RTL design of the target circuit and a technology library with which the aforementioned cir-cuit will be realized in practice. The workflow starts by providing
Logic
Synthesizer
Gate-Level
Simulator
Power
Estimator
RTLDesign
Parasitics Netlist
Switching Activity
Power Consumption
Traces Technology Library
(Power and Latency information)
Netlist
Figure 1: Typical circuit simulation workflow
a Register Transfer Level (RTL) description of the circuit to a logic synthesizer: this description is usually obtained through processing a high level description of the design through a proper synthesis tool. The RTL description is complemented by a technology li-brary, providing the information concerning the actual logic build-ing blocks to the logic synthesizer tool. In particular the technology library provides the available atomic parts (i.e. logic gates, latches and occasionally other elementary parts such as muxes) which can be employed when mapping the RTL description of the circuit into a placeable and routable one. The last module of the logic synthe-sizer will output the description of a completely placed and routed circuit, in the form of a text file commonly called netlist. This circuit respects the constraints imposed by the designer in terms of area and longest critical path and describes closely the actual silicon implementation of the digital circuit. The obtained netlist can be employed to perform a functional simulation of the circuit through a gate level simulator, which will yield a time-accurate log of the switching activity of the circuit, taking into account the sig-nal propagation delays caused by the gates, as this information is
contained within the technology library. The switching activity in-formation output by the gate level simulation tool is fed, together with the netlist describing the circuit, and the technology library employed to obtain both, to the actual power estimation tool of the digital design toolchain. This tool, considering the input data to-gether with the parasitic capacitances caused by the wiring of the circuit, simulates accurately the current flows in the circuit, produc-ing as output a very accurate log of them. In particular, the class of power estimation tools we will be considering in this work is the one of transistor-level power simulators, which are effectively able to produce a simulated current log with a precision depending on the actual models of the transistors provided within the technology library. Usually, the minimum timescale for such simulations is in the picoseconds range. In particular, the currents obtained as a result of such a simulation are completely free from any measure-ment noise or disturbance which may be introduced by a physical measurement instrument, and thus represent a very accurate model of the circuit under exam.
3.
SECURITY METRIC
The capability of building a power model approximating the ac-tual power consumption of a cryptographic device is the first and fundamental step to lead a differential power analysis. This is due to the fact that power analysis exploits the correlation between the power employed by a device to carry out a computation and the values being elaborated. The ability of the attacker to build an ac-curate model of the power consumption of the targeted architecture relies on the depth of his knowledge of the implementation.
Typically, as the details may not be fully known, general models for the power consumption of vulnerable operations are the Ham-ming weight and the HamHam-ming distance, respectively. Indeed, the dynamic power consumption of the aforementioned operations is directly proportional to the switching activity triggered by opera-tions such as bitwise computaopera-tions or loads/stores on registers.
By contrast, a design time simulation of a gate-level descrip-tion of the targeted device provides a very accurate estimate of the power consumption profile, with a particularly fine timescale. In particular this circuit simulation is free from measurement noise and sports near-infinite bandwidth as there are no physical con-straint on the precision of the measure, and it is performed directly on the on-die wire to be probed. This, in turn, implies that the cir-cuit designer is able to simulate a conservative approximation of the most powerful attacker possible, as he is able to obtain both a higher accuracy (in terms of noise-free measurements) and pre-cision than the usual oscilloscope-based measures adopted by an attacker. We note that, employing a transistor level power simula-tion, we are bounded in our precision only by the precision of the actual simulators. Through exploiting this capability, the circuit de-signer is able to evaluate a sound lower bound of the computational effort required by an attacker trying to breach the security of the device being designed, and consequently take appropriate actions before the device is actually manufactured.
The following definition provides a comprehensive and formalized description of this sequence of observations.
DEFINITION3.1 (PERFECTATTACKER). The scenario with
con-sumption exhibits the highest variance w.r.t. the possible inputs). (4) The absence of instrumental or environmental noise.
Note that, “template attacks” build a-posteriori models which (in the best case) fits the a-priori knowledge of the aforementioned Per-fect Attacker, as they characterize the behavior of a clone of the tar-get device varying the inputs. Consequentially, the Perfect Attacker (i.e. the designer) is able to employ the common Pearson correla-tion coefficient to determine which of its consumpcorrela-tion hypotheses fits best the actual one, as the model in his possession fits the actual consumption up to a constant multiplicative factor. However, as he will estimate the actual correlation coefficient through computing its sample estimator, it is crucial that enough samples are available to him, so to effectively obtain a statistically sound estimation for a given confidence level. We will now analyze the computational complexity of conducting a correlation power analysis depending on the size of the parameters involved.
PROPOSITION 3.1. Letkbe the bit-length of the secret key to
be recovered, and letw be the number of bits of the secret key that are employed by the targeted design to compute the observed vulnerable operation iteratively. Assume that the attacker is able to recordntrmeasurements (traces), each of themlsamples long,
and denote asbthe number of bits employed in formulating the key-hypothesis (1≤b≤w) of the correlation-based attack (CPA). The computational complexity of a CPA led by a Perfect Attacker against an un-protected device is:O k
blF(ntr, b)
, where
F(ntr, b)=4ntr2b.
PROOF. Considering a specific time instant of the cryptographic algorithm execution, letX be the random variable representing the actual measured consumption for each possible input of the observed vulnerable operation and letY be the random variable modeling the predicted power consumption given a specific key-hypothesis. Computing the sample Pearson correlation coefficient
rXY =
nP
xiyi−PxiPyi
p
nP
x2 i−(
P
xi)2p
nP
y2 i−(
P
yi)2
where{x1, . . . , xntr}and{y1, . . . , yntr}are thentrsample
val-ues of the random variablesX, Y, respectively, has a complex-ity ofO(8ntr)1. A straightforward approach for the attacker
im-plies that2b correlation coefficients are computed independently,
yielding a complexity ofO(8ntr2b). However, since only the
Y variable changes value during all the computations, it is pos-sible to pre-compute and store the values depending only fromX thus effectively lowering the total complexity fromO(8ntr2b) to O(4ntr2b). Taking into account the fact that this computation
must be done for all thelsamples of the measurement, and the whole key should be retrieved, the computational complexity of the whole CPA attack is thusO lkb4ntr2b.
The computational complexity of the CPA provides a mean to de-rive the optimal values of the free variablesntrandb(i.e. the
num-ber of traces and the numnum-ber of key hypotheses) for the attacker to perform the least possible computational effort. Nonetheless, these two variables are non-trivially bound as the number of traces de-pends on the values of the correlation coefficients corresponding to each key hypothesis. In particular, for a successful CPA, it should hold that the correlation coefficient for the correct key is the high-est one and the confidence interval for it does not overlap with the
1We recall thatx
irepresents the instantaneous power consumption
of the device computing with thei-th plaintext as input at a certain time instant, whileyiis the consumption predicted for the same
computation, given a fixed value of the key hypothesis.
10
010
110
210
310
410
−210
−110
0Number of traces (x100)
W
idth
of
the
interv
al
Figure 4: Width of the bilateral confidence interval, α∈{0.2,0.1,0.05,0.01,0.001}, raising the number of traces
ones of the correlation coefficients of other key guesses [3, 7, 15]. To this end, we recall the width of the bilateral confidence interval for the sample correlation coefficientr, given the number of traces ntrand the error probabilityα.
DEFINITION3.2 (CONFIDENCEINTERVALS). Given a
sam-ple correlation coefficient valuerobtained withntr samples, its
confidence intervalIr=[ξinf, ξsup]for a chosen error probability
α, defines the continuous interval where the actual coefficient re-sides with probability1−α. Alternatively the confidence interval can be seen as the margin of uncertainty in the estimation of the the-oretical value of correlation, given a confidence of1−α. The size of the confidence interval,|Ir|=2
z√1−α/2
n−3 , decreases as the chosen
value for the error probabilityαincreases, and as the number of samplesntremployed in the estimation grows2.
Meaningful values forαrange in0<α<0.5, asα=0.5is equiv-alent to a fair coin toss to decide whether the result is correct or not. Figure 4 depicts the sizes of the confidence intervals forα∈ {0.2,0.1,0.05,0.01,0.001}, where the lighter grey represents a greater value of α, with the number of traces ntr ranging from
thirty to one million.
Depending on the operation being modeled by the attacker, the distance of the theoretical value of the correlation coefficient of the correct key guess from the one most likely to be mistaken by it changes. A statistically sound criteria to actually distinguish them is that the sum of their unilateral confidence intervals is smaller than the distance between the sample correlation values. For in-stance, thexoroperation, which is by far the most common way to performKEY-ADDITIONs, has the property of having the value of the consumption hypothesis being linearly related to the ratio of correctly guessed bits over the total bits of the secret key be-ing employed in the operation. This, in turn, implies that guess-ingb−1 out ofbbits of the secret key during aw-bit wideKEY
-ADDITION(1≤b≤w) will yield a distance between the sample
cor-relation coefficients ofδ=ρb−ρb−1 =ρb
1−q1−1 b
, with
ρb=ρ
q
b
w whereρdenotes the correlation coefficient computed
guessingb=wbits [15]. Therefore, the value of the sum of the uni-lateral confidence intervals forρbandρb−1should be smaller than
2
z1−α/2 denotes the quantile of order1−α/2of the normal
1 2 3 4 5 6 7 8 0
500 1,000 1,500
No. of guessed bits out of 8
Number
of
traces
(a) 8-bit datapath (w=8)
4 8 12 16 20 24 28 32 0
0.5 1 1.5 2 2.5
·104
No. of guessed bits out of 32
Number
of
traces
(b) 32-bit datapath (w=32)
16 32 48 64 80 96112128 0
1 2 3 4
·105
No. of guessed bits out of 128
Number
of
traces
(c) 128-bit datapath (w=128)
Figure 2: Expected number of traces required to lead a CPA against the 1st ADDROUNDKEYof an hardware implementation of AES-128 as a function of the number of bits employed to formulate the key hypothesis (and of the error probabilityα in
{0.2,0.1,0.05,0.01,0.001}) in case the device can compute the ADDROUNDKEYwithw=8,w=32orw=128bits at time. Lighter greys represent greater values forα
1
2
3
4
5
6
7
8
16
18
20
22
Guessed bits (out of 8)
Computational
ef
fort
(a) 8-bitxor
5
10 15 20 25 30
20
25
30
35
40
45
Guessed bits (out of 32)
Computational
ef
fort
(b) 32-bitxor
0
20 40 60 80 100 120
20
40
60
80
100
120
140
Guessed bits (out of 128)
Computational
ef
fort
(c) 128-bitxor
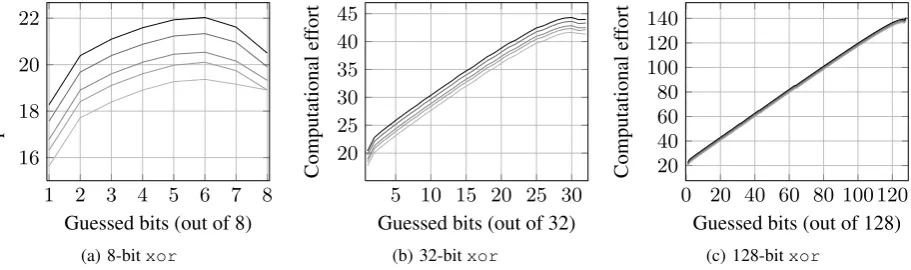
Figure 3: Computational effort required to retrieve the full key (k= 128) with an attack against thexoroperation,w∈ {8,32,128}, as a function of the number of bitsbinvolved in the key hypothesis. The computational effort is plotted inlog2scale (i.e. number of
bits of equivalent security margin) and considering an error probability ofα∈ {0.2,0.1,0.05,0.01,0.001}(lighter gray stands for largerαs). The effective trace length to compute the complexitylis 1, as the attacker knows the exact time instant.
δ. Consequentially the minimum number of traces needed to led a successful CPA corresponds to the one which yields the confidence intervals small enough to match this condition.
Figure 2 depicts the values of the expected number of traces varying the number of guessed bits for 8- 32- and 128-bit wide
xoroperations, respectively, (i.e. the values ofF(ntr, b))
consid-ering an error probability varying in{0.2,0.1,0.05,0.01,0.001}. The bell-like shape of the plots is to be ascribed to the fact that the difference betweenρbandρb−1widens with the growing number
of hypothesized bits, while the confidence intervals for the values ofρbandρb−1shrink. In case the operation being modelled does
not enjoy the aforementioned property, we note that it has a finite number of inputs (e.g. 28for an 8-bit S-BOX). To determine the values of the correlation coefficients of the correct and most likely to be mistaken key hypothesis the simulated power model (which fits perfectly the circuit) can be employed, computing the corre-lation coefficients for each possible key hypothesis and observing which one is the most likely mistaken one. After the most likely to be mistaken key hypothesis has been determined, it is possible to simply compute the distanceδ between its correlation coefficient and the one of the correct key hypothesis. Finally, this value ofδis employed as before to find out the minimum number of tracesntr
that is necessary to acquire to perform a successful CPA for a fixed value of the error probabilityα.
DEFINITION 3.3. Letlbe the number of samples of a trace and
kthe total number of key bits to be retrieved, the minimum Ideal computational effort to lead a CPA is the one where the number of key bitsbguessed during a single CPA minimizes the computational effort to retrieve the whole key:
b= argmin
b∈{1,...,k}
k
blF(ntr, b)
Figure 3 depicts the amount of computational effort required to lead a successful attack against an 8-, 32- and 128-bitxor, consid-ering asntrthe minimum one to obtain the desired value ofα, i.e.
1 2 3 4 5 6 7 8 9 10 11 12 12
14 16 18 20 22 24 26 28
Number of Masks
Computational
ef
fort
(a) Masking only
1 2 3 4 5 6 7 8 9 10 11 12 20
30 40 50 60 70 80 90 100 110 120
Number of Masks
Computational
ef
fort
(b) Masking and Hiding (h= 16)
1 2 3 4 5 6 7 8 9 10 11 12 20
30 40 50 60 70 80 90 100 110 120
Number of Masks
Computational
ef
fort
(c) Masking, Hiding (h= 16) and consid-ering sampling
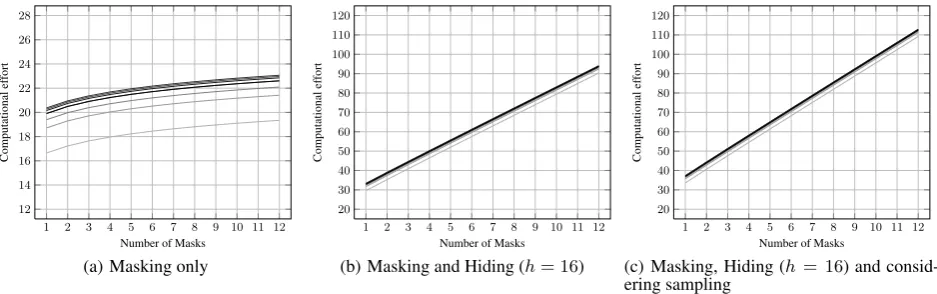
Figure 5: Computational effort required to breach a masked implementation of the 8-bitxor operation, considering an error probability ofα = 0.2, only. The computational effort is plotted inlog2 scale (i.e. number of bits of equivalent security margin). Lighter greys indicate a lower number of guessed bits at once (1≤b≤w)
3.1
DPA Countermeasures
and High-Order Attacks
Countermeasures to prevent the leakage of power-based side-channels are split into two categories:masking, i.e. performing a randomized computation where the actual sensitive value is added to random masks, andhiding, i.e. performing the computation in a different time instant at each run of the algorithm.
3.1.1
Masking
Masking aims at invalidating the link between the predicted hy-pothetical power consumption values and the actual values pro-cessed by the device. In a masked implementation, each sensitive intermediate value is concealed through splitting it in a number of shares, which are processed in different time instants. Hence, the target algorithm is modified to correctly process each share and to recombine them at the end of the computation. A masking scheme with only two shares is composed by the valuesvmandm, where
mis a randomly chosen mask andvmis a share such that the value
vto be protected can be derived asv = vmm, with
denot-ing an invertible binary operation (usually, the bitwise xor). To compensate for this countermeasure, more sophisticated DPA at-tacks, known as higher-order DPAs (HO-DPA) rely on predicting the consumption of the operations handling the shares and try to obtain a combination of them which is independent from the mask-ing values. This value must subsequently be correlated with an analogous combination of the measured consumption values, em-ploying the usual Pearson correlation coefficient. Thus, under the hypothesis of a perfect knowledge of all the time instants where the masked operations are performed, introducing anm-th order mask-ing scheme on a cipher implies a growth of the effective length of the tracelup tom+1(as enough relevant power consumption samples must be obtained). However, as the attacker performs the actual correlation analysis on the post-processed values, the com-plexity of the DPA increase simply by the amount of time required to perform the pre-processing action, typically a computational ef-fort linear in the number of acquired traces. This in turn implies that a masking scheme is effectively raising by a significant margin the security of the implementation only if the attacker is not able to know exactly where the masked values are computed, i.e. he needs to sample more thanl=m+1points and compute the recom-bination function for all the possible comrecom-bination of them. In the general case it holds that the attacker needs to compute m+1l
cor-relation analyses for anm-th order masking scheme, thus obtaining
a computational complexity ofO l m+1
lkb2b4ntr
. This in turn implies that the exact knowledge of the time instant when the sen-sitive masked operations happen is a crucial asset for an attacker as, in turn, when this knowledge is not available, the computational effort grows very quickly.
3.1.2
Hiding
Hiding methods aim to conceal the relation between the power consumption and the operations performed by the target algorithm to compute the intermediate values. This is done either through randomizing the time instant in which the sensitive operation is performed (also known as hiding in the time dimension [14]), or through adding extra dummy computation performed in parallel with the sensitive operation, thus lowering the theoretical maxi-mum correlation (also known as hiding in power). The protection strategies employed in the open literature are based on execution flow randomization via shuffling the order of some operations (f.i., permuting the sequence of accesses to lookup tables) and inserting random delays built with dummy operations or with clock random-ization methods [18, 22, 23]. To minimize the performance over-head, the execution must be interleaved with delays in multiple places, keeping the individual delays as short as possible. In this way, an attacker faces a cumulative and hardly predictable sum of delays between the start (the end, respectively) of the algorithm and the location of the observed intermediate operation in time [13]. Hiding in timeis effective in reducing the maximum correlation obtainable by an attacker, since computing the usual correlation co-efficient overntrtraces, where the sensitive operation is performed
AES Design HDL Code
R TL validation
Post-Synth Validation
Post-P&R Validation
Synthesis (Synopsys DC)
Place & Route (Encounter)
Synthesized Netlist
Routed Netlist
00000000 10101010 11111111 Validated Test Vectors
CMOS Library Front-end/Back-end View
Transistor Level Simulation (Synopsys Nanosim)
Transistor Models
Current Intensity Log Files
Parasitic Capacitances
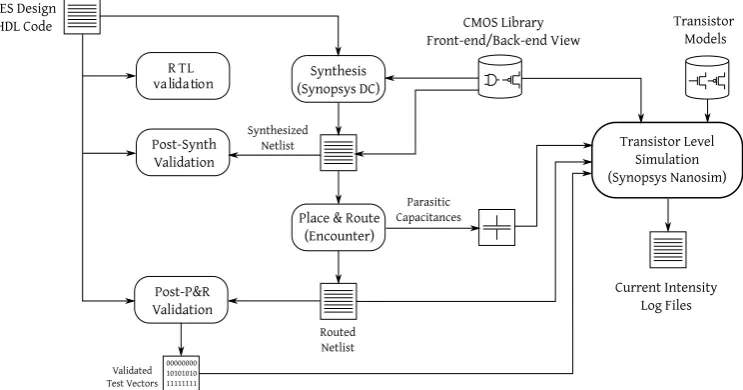
Figure 6: Detailed description of the simulation and verification tools employed to obtain the simulated power traces. The workflow is a specialization of the general one described in Figure 1
depending on the entity of the consumption of the power operation. This reduction cannot be compensated in any way: the attacker is forced to collect more traces in order to obtain a reliable estimation of a smaller correlation coefficient. The amount of this reduction can be evaluated considering the dummy operation as a component of the sensitive operation and applying the method mentioned in the previous subsection. Summing up, the net effect of applying hiding strategies to an implementation of a cipher is a√hdecrease in the correlation coefficient and an increase in the number of sam-ples of the power consumption which should be acquired tohin order to record the power consumption of the correct operation. Consequentially the computational effort required for a DPA attack against an implementation protected with hiding techniques will rise as a consequence of the higher number of traces required to achieve a statistically sound estimation of a smaller difference in correlation coefficients.
3.1.3
Combined Strategies
The typical countermeasure solutions usually employ both hid-ing and maskhid-ing in a combined setthid-ing to provide a higher secu-rity margin. Typically, engineering solutions limits the overhead of high-order masking schemes with respect to the unprotected im-plementation, resorting to the combination of two-share masking schemes and hiding techniques [18, 19] and this is commonly ac-cepted to be reasonably secure. Willing to provide a quantitative margin of the security of employing a combined hiding and mask-ing scheme we note that the two approaches have a strong positive synergy, as hiding masked operations raises the possible positions which the attacker should consider to compute the recombining function required for HO-DPA attacks. More in detail, given an m-th order masking scheme, the total number of power consump-tion samples which should be acquired ish(m+1)as every masked operation is hidden within anhsamples wide window. Consequen-tially the total computational complexity of the scheme rises up to
O mh+h
m+1
lk b2
b 4ntr
. Figure 5 provides an evaluation of the computational complexity of a masked implementation,
consider-ing both the plain maskconsider-ing and the combined action of maskconsider-ing and hiding withh= 16.
Willing to provide an insight on an attacker which is not able to determine the perfect time instant in which the sensitive operation takes place, but is able to determine the clock cycle in which this operation happens, we recall that he should sample to at least2.5
times the clock frequency of the device, in order to obtain the full information modulated on the clock edges [7–9, 16]. This in turn implies at least a growth factor2.5on the value ofh(m+ 1), of which the effects on the security margin are depicted in Figure 5.
4.
CASE STUDY ARCHITECTURE
AND SIMULATION ENVIRONMENT
In this section we describe the architecture employed to imple-ment the AES cipher in our case study evaluation.The 128-bit datapath implementation of the AES is a fully paral-lel one where one complete round is computed at each clock cycle. To do so, there are 16 instances of the sameS-box. TheS-box
is implemented in a combinatorial fashion, i.e. its behavior is de-scribed in HDL language and then synthesized and left to be opti-mized by the synthesis tool. The other primitives are performed in a straightforward parallel fashion on the whole state and only the result of the round computation is saved back in the 128-bit regis-ter at the end of the clock cycle. The initial plaintext and all the round keys were provided to the module as external signals via the HDL test bench, assuming the key schedule has already been per-formed during the bootstrap phase to enhance the throughput of the implementation.
Figure 6 depicts the detailed simulation setup we have employed in our evaluation procedure, following the one proposed by Regaz-zoni et al. in [17]. The general design flow is the one of the stan-dard Electronic Design Automation (EDA) described in Section 2 taking as input the the Register Transfer Level (RTL) description of the considered cores obtained from the synthesis of their HDL description. The output of the simulation flow is a text file which stores the noise-free instantaneous current at the power supply line of the circuit.
STMicroelec-0 0.2 0.4 0.6 0.8 1
·104
−0.4
−0.2 0 0.2 0.4
Number of Traces
Peak
Correlation
Coef
ficient
(a) 4-bit key hypothesis
0 0.2 0.4 0.6 0.8 1
·104
−0.6
−0.4
−0.2 0 0.2 0.4 0.6
Number of Traces
Peak
Correlation
Coef
ficient
(b) 8-bit key hypothesis
0 1,000 2,000 3,000 4,000
−0.6
−0.4
−0.2 0 0.2 0.4 0.6
Time[ps]
Peak
Correlation
Coef
ficient
(c) Time domain representation
Figure 7: Correlation coefficients obtained estimating respectively 4 bit (Subfigure (a)) and 8-bit (Subfigure (b)) of the 128 bit XOR, together with the trend of the values of Pearson’s correlation coefficient in time, estimated with 10000 traces (Subfigure (c))
tronics 65 nm GP SVT CMOS standard cell library [20] and Synop-sys Design Compiler[21]. The place and route is carried out using Cadence Silicon Encounter and the transistor level simulation is performed using Synopsys Nanosim, simulating the environment with a time resolution of 1 ps per sample and a precision in the current measure of 1 pA. This simulation setup is the equivalent of gathering measurements on the actual circuit with an effective bandwidth of 500 GHz (taking into account Nyquist’s bound) and considering a voltage probe sampling at the ends of an 1Ωresistor for a peak-to-peak dynamic consumption variation of 4µV with a 20-bit ADC. With the current state-of-the-art technologies, such precision in measurements is not achievable in practice, especially considering that the chip bonding wires add substantial parasitic ca-pacitances which cannot be removed easily at measurement time. Moreover, the current measurements provided by the simulator are perfectly aligned timewise and do not suffer of any measurement noise. Taking into account these facts, we consider the quality of the measurements produced by our simulation a conservative up-per bound on the measurement capability of any practical attacker targeting our implementations.
The implementation was correctly synthesized, placed and routed constraining the clock period to be 4 ns or shorter (thus support-ing a worksupport-ing frequency of 250 MHz) and optimizsupport-ing for area as much as possible within that constraint. We notice that a significant part of the 128-bit core is taken up by theS-Boxes andxorgates (namely, roughly 72% of the final circuit area). Consequentially, we expect the correlation coefficients obtained from the simulation of the 128-bit core to be closer to the theoretically predicted ones.
5.
METRIC EVALUATION
In order to evaluate our metric, we collected simulated measure-ments from both the implementation of the AES, employing as plaintexts the ones provided by the NIST test-benches, in order to be able to provide also the correct validation values to the simulator and check for the correct operation of the circuit.
Willing to evaluate the effectiveness of our metric, we collected 10000 measurements, in order to provide an estimate of the cor-relation coefficients obtained performing attacks against thexor
operation employed to compute the ADDROUNDKEY primitive. According to the metric, this should be sufficient to estimate the sample correlation coefficientrfor ab=8bits of key-hypothesis on the 128-bitxorwith error probabilityαas low as 0.001. The expected correlation coefficient for the correct key value is thus of
q
8
128 = 0.25, assuming that all the 128xoroperations are
per-formed exactly in the same instant.
The results of the actual correlation power analysis conducted on the collected measurements are depicted in Figure 7 and show that the actual sample correlation coefficient obtained on the sim-ulated measurements is higher than the one expected and, more precisely is≈0.5. Willing to explain this behavior we analyzed the post-place-and-route floorplan of the circuit and observed that the floorplanning tool clustered together banks of 32-bitxorgates during the synthesis, thus effectively splitting the 128-bit widexor
operation into four 32-bit wide ones. This layout causes thexorto be computed in slightly different time instants, thus resulting in an effective estimate of 8-bit out of 32 being computed, which in turn
yields a theoretical correlation coefficient of
q
8
32 = 0.5, which is
actually coherent with our theoretical estimates. In this case, esti-mating a-priori the theoretical correlation coefficient allowed us to discover that the our design was not placed and routed as expected, thus yielding an effective reduction in the number of operation be-ing performed in the same instant. We note that, takbe-ing into account the fact that only 32xoroperations are performed together, we still able to consider the estimates we obtain from 10000 measure-ments to be reliable with an error probability lower thanα=0.05
in estimating the highest correlation coefficient. The results de-picted in Figure 7 were computed to further confirm the fact that actually only 32 of thexoroperation are computed at once, and, also in this case, the estimated correlation coefficients match the theoretical ones, while the error probability is reduced toα=0.01, according to Section 3.
negligible, and the correct key emerges with a statistical confidence greater than 99%. This is consistent with what has been reported in open literature in [5] as the possibility of performing Leakage Power Analysis, i.e. exploiting the static power consumption to perform side channel attacks.
Willing to apply our security metric to the 128-bit core under exam, employing the correct model for the placed and routed im-plementation, following the results proposed in Section 3 we obtain that a 9th order masking scheme on thexoroperation, with a hid-ing factor of 16 (i.e. eachxoroperation takes place in one out of 16 possible time instants, which is implementable with no ef-fort through shuffling the order of the four 32-bit operations) yields an effective computational security margin greater than 80 bits, as-suming that the attacker is able to choose the most advantageous computational effort. This estimate for the security margin of the cipher implementation is rather conservative, and can be brought closer to reality taking into account the2.5×penalty factor in time uncertainty brought in by the need of the attacker to sample the power consumption while keeping in mind Nyquist’s bound. In this case, the effective number of masks required to achieve a 80-bit computational security margin is reduced to 7, which, albeit being higher than the usual advised number of 2 is bound to provide an effective security margin even taking into account the best possible measurement and modeling skills of the attacker against this cipher primitive.
6.
CONCLUSIONS
In this work we presented a first exploration of a design-time se-curity metric to evaluate the effective computational sese-curity mar-gin against side-channel attacks of an implementation of a cryp-tographic primitive. We employed an attacker model which as-sumes the ability of performing perfect measurements and the com-plete knowledge of the implementation details by the attacker, and consequentially provided the computational complexity of a power analysis side-channel attack against the implementation. We evalu-ated the effect of employing hiding and masking countermeasures to raise the security margin of a design up to the point where it matches the one provided by the cipher under exam (AES-128 in our case). Finally, we evaluated practically a case study, comparing the theoretical correlation coefficient with the one obtained practi-cally from the simulations in order to understand its vulnerability to attacks, providing a quantitative estimate of the entity of the mask-ing and hidmask-ing needed to secure the implementation.
7.
REFERENCES
[1] G. Agosta, A. Barenghi, F. De Santis, A. Di Biagio, and G. Pelosi. Fast Disk Encryption through GPGPU Acceleration. InPDCAT, pages 102–109. IEEE Computer Society, 2009.
[2] G. Agosta, A. Barenghi, F. De Santis, and G. Pelosi. Record Setting Software Implementation of DES Using CUDA. InITNG, pages 748–755, 2010.
[3] G. Agosta, A. Barenghi, and G. Pelosi. A Code Morphing Methodology to Automate Power Analysis Countermeasures. In P. Groeneveld, D. Sciuto, and S. Hassoun, editors,DAC, pages 77–82. ACM, 2012.
[4] G. Agosta, A. Barenghi, and G. Pelosi. Exploiting Bit-level Parallelism in GPGPUs: a Case Study on KeeLoq Exhaustive Search Attacks. InARCS Workshops, pages 385–396, 2012.
[5] M. Alioto, L. Giancane, G. Scotti, and A. Trifiletti. Leakage Power Analysis Attacks: A Novel Class of Attacks to Nanometer Cryptographic Circuits.IEEE Trans. on Circuits and Systems, 57-I(2):355–367, 2010.
[6] A. Barenghi, G. Bertoni, L. Breveglieri, and G. Pelosi. A FPGA Coprocessor for the Cryptographic Tate Pairing overFp. InITNG,
pages 112–119. IEEE Computer Society, 2008.
[7] A. Barenghi, G. Pelosi, and Y. Teglia. Improving first order differential power attacks through digital signal processing. In O. B. Makarevich, A. Elçi, M. A. Orgun, S. A. Huss, L. K. Babenko, A. G. Chefranov, and V. Varadharajan, editors,SIN, pages 124–133. ACM, 2010.
[8] A. Barenghi, G. Pelosi, and Y. Teglia. Information Leakage Discovery Techniques to Enhance Secure Chip Design. In C. A. Ardagna and J. Zhou, editors,WISTP, volume 6633 ofLecture Notes in Computer Science, pages 128–143. Springer, 2011.
[9] A. Barenghi, G. Pelosi, and F. Terraneo. Secure and Efficient Design of Software Block Cipher Implementations on Microcontrollers.Int. Journal of Grid and Utility Computing, 2012.
[10] G. Bertoni, L. Breveglieri, L. Chen, P. Fragneto, K. A. Harrison, and G. Pelosi. A pairing SW implementation for Smart-Cards.Journal of Systems and Software, 81(7):1240–1247, 2008.
[11] C. Clavier, J.-S. Coron, and N. Dabbous. Differential Power Analysis in the Presence of Hardware Countermeasures. In Çetin Kaya Koç and C. Paar, editors,CHES, volume 1965 ofLecture Notes in Computer Science, pages 252–263. Springer, 2000. [12] C. Clavier and K. Gaj, editors.Cryptographic Hardware and
Embedded Systems - CHES 2009, 11th International Workshop, Lausanne, Switzerland, September 6-9, 2009, Proceedings, volume 5747 ofLecture Notes in Computer Science. Springer, 2009. [13] J.-S. Coron and I. Kizhvatov. Analysis and Improvement of the
Random Delay Countermeasure of CHES 2009. In S. Mangard and F.-X. Standaert, editors,CHES, volume 6225 ofLecture Notes in Computer Science, pages 95–109. Springer, 2010.
[14] S. Mangard. Hardware Countermeasures against DPA? A Statistical Analysis of Their Effectiveness. In T. Okamoto, editor,CT-RSA, volume 2964 ofLecture Notes in Computer Science, pages 222–235. Springer, 2004.
[15] S. Mangard, E. Oswald, and T. Popp.Power analysis attacks -revealing the secrets of smart cards. Springer, 2007.
[16] A. Moradi, A. Barenghi, T. Kasper, and C. Paar. On the vulnerability of FPGA bitstream encryption against power analysis attacks: extracting keys from Xilinx Virtex-II FPGAs. In Y. Chen, G. Danezis, and V. Shmatikov, editors,ACM Conference on Computer and Communications Security, pages 111–124. ACM, 2011. [17] F. Regazzoni, A. Cevrero, F.-X. Standaert, S. Badel, T. Kluter,
P. Brisk, Y. Leblebici, and P. Ienne. A Design Flow and Evaluation Framework for DPA-Resistant Instruction Set Extensions. In Clavier and Gaj [12], pages 205–219.
[18] M. Rivain, E. Prouff, and J. Doget. Higher-Order Masking and Shuffling for Software Implementations of Block Ciphers. In Clavier and Gaj [12], pages 171–188.
[19] K. Schramm and C. Paar. Higher Order Masking of the AES. In D. Pointcheval, editor,CT-RSA, volume 3860 ofLecture Notes in Computer Science, pages 208–225. Springer, 2006.
[20] STMicroelectronics. Clock 90 GPLVT 1.2V 2.2 Standard Cell Library User Manual and Databook, Sept. 2006.
[21] Synopsis Corporation. Design Compiler Ultra. White paper Sep. 2012,
http://www.synopsys.com/tools/implementation/ rtlsynthesis/dcultra/Pages/default.aspx. [22] S. Tillich and C. Herbst. Attacking State-of-the-Art Software
Countermeasures-A Case Study for AES. In E. Oswald and P. Rohatgi, editors,CHES, volume 5154 ofLecture Notes in Computer Science, pages 228–243. Springer, 2008.