CENTRE FOR
ADV
ANCED
SP
A
TIAL
ANAL
YSIS
W
orking Paper Series
Paper 63
NETWORK
GEOGRAPHY
Centre for Advanced Spatial Analysis University College London
1-19 Torrington Place Gower Street
London WC1E 6BT
[t] +44 (0) 20 7679 1782 [f] +44 (0) 20 7813 2843 [e] [email protected] [w] www.casa.ucl.ac.uk
http//www.casa.ucl.ac.uk/working_papers/paper63.pdf
Date: July 2003
ISSN: 1467-1298
© Copyright CASA, UCL
Network Geography: Relations, Interactions, Scaling and Spatial Processes in GIS
Michael Batty
Centre for Advanced Spatial Analysis, University College London, 1-19 Torrington Place, London WC1E 6BT, UK
Network Geography: Relations, Interactions, Scaling and
Spatial Processes in GIS
Michael Batty
11Centre for Advanced Spatial Analysis, University College London,
1-19 Torrington Place, London WC1E 6BT, UK
Email: [email protected], Web: http://www.casa.ucl.ac.uk/
July 2, 2003
Abstract
This chapter argues that the representational basis of GIS largely avoids even the most rudimentary distortions of Euclidean space as reflected, for example, in the notion of the network. Processes acting on networks which involve both short and longer term dynamics are often absent from GI science. However a sea change is taking place in the way we view the geography of natural and man-made systems. This is emphasising their dynamics and the way they evolve from the bottom up, with networks an essential constituent of this decentralized paradigm. Here we will sketch these developments, showing how ideas about graphs in terms of the way they evolve as connected, self-organised structures reflected in their scaling, are generating new and important views of geographical space. We argue that GI science must respond to such developments and needs to find new forms of representation which enable both theory and applications through software to be extended to embrace this new science of networks.
Acknowledgements
MB wishes to thank the ESRC Nexsus Project (L326-25-3048) for support. Jake Desyllas provided the images of Berlin from his PhD thesis. Sam Rich gave permission for the use of two screen shots from his London Underground web pages at http://www.fourthway.co.uk/
1. Spatial Relations and GI Science
If we unpack the term ‘geographic information science’, it is immediately clear that its reference to ‘geography’ is simplistic. This is the geography of locations not relations. It is the geography of place in an absolute sense, represented by points, lines and polygons which enable attributes to be associated with these geometric objects, attributes which are largely unordered. Moreover, in terms of the word ‘system’, GIS does not have any of the connotations of general systems theory which is the study of basic elements and their interactions, of their parts and wholes, with the whole being ‘more than the sum of the parts’ (von Bertalanffy, 1968). Interactions – relations – are also key to systems. The system in GIS does not refer to the geographical system but to the way information is organised and only in this sense, can relations be found, based on ways in which raw or processed data is represented in relational fashion: how points, lines, and polygons are ordered geometrically to aid efficient processing and visualisation, rather than implying order to the geography which GIS purports to represent.
These limitations to GIS are perfectly understandable given its history and purpose. But in an era when the ‘system’ in GIS is being translated into ‘science’, and in the light of rapid developments in systems theory in many fields which are changing the focus to bottom-up dynamics as the generator of more aggregate spatial order and pattern, the inability of GIS to embrace spatial relations, interactions, and their connectivity is posing a major barrier to its continued development. The rapidly developing science of networks is predicated not on the representation of static structures per se but on processes of change occurring on and within such structures. This problem of an appropriate representation lies at the very heart of GIS. If GIS is to be useful in articulating and operationalising contemporary geographical theory, it must not only incorporate relations. It must enable such representation to be focussed on processes rather than structures for the emerging logic of how many kinds of system – from rivers to central places, from natural ecologies to cities as built forms – is one which espouses any form of equilibrium, treating evolution as processes in which relations and interactions are never at rest.
storage and manipulation technology rather than a vehicle on which to make contemporary geographical theory applicable and practicable.
We should also note that by identifying networks of interactions and relations as having a central place in contemporary geography, this necessarily involves the temporal dimension. Traditional GIS is largely atemporal, representing locational structures at a single point in time. In so far as time has been involved, such systems simply represent a series of cross-sections in comparative static manner, with little functionality or science being developed to deal with processes that link these cross-sections through their temporal evolution. The problems posed by these limits on our use of traditional GIS for the study of networks become clear when we begin our discussion of ways in which geographic information scientists have attempted to adapt and extend GIS to embrace interactions. As we shall see, such extensions are invariably ad hoc, treating interactions between locations at a snapshot in time, often using GIS simply as a means to visualize resultant relational structures. GIS is not well adapted to treating interactions although its tool box nature does allow various plug-ins to be developed that deal with networks. However our main purpose here is to illustrate how new views of networks need to be incorporated within GIS and this means new forms of representation in time as well as space.
We thus turn to the emerging network paradigm and sketch its key components, illustrating how important the idea of evolution is to our understanding of locations and their relations. There is a strong spatial theme in all this which involves the unifying force of scaling. Many networks scale in time as well as space and this uniformity can be exploited in building a spatial science of networks. Although these ideas can be easily demonstrated in traditional geographic applications, we turn to two popular examples of these developments: ideas about the scale of networks in the form of small worlds which have local properties which generate global pattern, and notions about the way networks mirror ways in which systems such as the world wide web, grow from the bottom up, in cyberspace which can be mapped onto the Euclidean space which is the world that GIS represents. Here we will challenge GI science to deal with network representations that are intrinsically dynamic, scale with both space and time, and which map onto different kinds of geometries, other than the Euclidean, suggesting that this is a major challenge in our quest for re-presenting GIS.
2. Spatial Interactions at the Cross-Section
This problem is seen quite distinctly in the failure of transportation to be represented appropriately in GIS. This area, called GIS-T, has never really taken off. The recent book by Miller and Shaw (2001) which is as good a summary of the state-of-the-art in GIS-T as there is, reveals that GIS, in terms of its software, is largely peripheral to the transportation modelling, forecasting, and planning processes. Although shortest route problems have been configured within some GIS software, these have been mainly used for more partial planning problems such as location-allocation modelling which lies outside the mainstream of transportation planning. GIS has largely been influenced by transportation geographers dealing problems of facilities location and the software that has been developed is unable to embrace the fully-fledged transportation planning process which still revolves around the four stage modelling process of trip generation, distribution, modal split and assignment. GIS at best is used in a supportive role, for organising data inputs and outputs to and from more mathematically-based software and of course for visualisation. What at first sight appears to be a synthesis of transport and GIS turns out to be a recasting of traditional and new transportation planning technologies under the general banner of GIS in its interpretation as GI science, by GIS scientists rather than transportation engineers.
The limits to GIS in dealing with transport are seen most widely in problems of visualising interactions. Because GIS software is not well adapted to dealing with anything other than area or point locations, it has proved difficult to develop programs within GIS for displaying flows between locations, for example, which are the stock in trade of transport modelling. Desire line diagrams and assigned flows to networks are rarely a feature of visualization in GIS. For example, de Jong and van Eck (1996) have developed specific software for enabling such flows to be represented. Their FLOWMAP software plugs into various GIS packages (http://flowmap.geog.uu.nl/); it is focussed entirely on a range of problems involving the direction and volume of movement relevant to everything from migration to road traffic, and is designed to exploit standard GIS packages from which the various inputs and outputs used in visualising such flows are taken.
been used largely because its plug-ins and extensions enables various kinds of spatial analysis and 3D visualization to be accomplished with relative ease.
The third example which involves interaction and networks within GIS is a rather new development, very much in the spirit of other chapters in this book. Okabe (2003) argues that for many spatial problems, the kind of homogeneous spatial landscape where every point and area has the same intrinsic importance is often a gross simplification of the reality under scrutiny. Many features and objects locate with respect to a landscape which is a network. Indeed one of the arguments of space syntax is that streets or lines of sight are more important to understanding how activities locate than are areas, plots, or viewsheds. In short, the notion of developing spatial analysis on a network is gaining widespread interest. In such characterizations, what might appear to be a random distribution of activity in Euclidean space is often seen as being highly ordered on a network. What is random on a network is often highly ordered in Euclidean space and there are many other possibilities in between that differentially combine different networks and planar spaces. Okabe’s (2003) software – SANET – Spatial Analysis on a NETwork – has been developed for such problems. Again, such software is compatible with GIS for visualization purposes but stands independently of the representational basis of conventional GIS which does not have the flexibility to embrace these news kinds of order that rely on the connectivity of point locations, rather than point patterns per se.
We should not give the impression that GIS software engineers have been unable to adapt their software to embrace ideas about networks. Much of what exists is dictated by the market place where network applications are considerably less prominent that location-based projects. However, GI scientists have not in general developed their science to embrace the idea of the network. Where this has occurred it has been peripheral to the mainstream and where there is real momentum for network applications as in transport, GIS has not responded. Systems for such planning focus much more on analysis and simulation than on representation. All this however is changing. The idea of the network and more particularly the evolution of networks is a science in the making, and this will force us to re-present GIS. Devising a GI science on the basis of a landscape of changing relations is likely to lie at the heart of this field in the coming years.
3. The Network Paradigm
which shifts the baseline from physics to biology where growth and evolution rather than structure is now the prime concern. But the shift is much wider for as human systems and societies have evolved over the last 50 years, it has become increasingly apparent that societies function from the bottom up and that top-down control can never effectively manage or control the problems that such systems manifest.
At the heart of this shift from a centralised to decentralised view of systems, is the idea that, in Adam Smith’s terms, there is no ‘hidden hand’ guiding evolution. Systems function from the bottom up, where local action often motivated by purely local gain, gives rise to more global order. Indeed complexity theory which is another dimension of this concern for decentralized explanation, argues that it is this uncoordinated, relatively non-ordered basis for local action that gives rise to the kind of global order that we see around us. Indeed, most systems that survive, depend on their functioning at the local level adapting to produce resilient structures which are then reflected in a relative global order. In this sense, the structures that emerge cannot be explained without recourse to the dynamics of local action. Moreover any order that is generated must be maintained and this requires energy. Order in fact is the equilibrium that we see around us although as it requires much energy to sustain it, then this order is hardly an equilibrium based on least effort. It is in fact an order which is far-from-equilibrium in the traditional terms of classical physics and it is this that makes the focus on processes which reach, maintain and evolve these structures so essential to this new science.
One of the key signatures of complex systems is in the fact that many patterns repeat themselves at different spatial and temporal scales. If we focus on spatial scales for the moment, then simple processes which generate growth at the most local level, when applied uniformly in building up structures from the simplest seed location, generate the same pattern at successively larger scales. Such order across scales which is marked by spatial self-similarity is said to be scaling and the structures that result are fractals. One of the best examples is the tree-like structure that shows similarity at all scales from the tiniest branches to the entire network. Dendritic patterns such as rivers and transport systems in cities which both grow at the local level to ‘service’ their surrounding space in the most minimalist fashion, provide excellent examples of growth processes that scale, are never in equilibrium in the traditional sense, and require the same continual operation of basic local rules or codes to maintain their structure.
models although implicit, do indicate the way in which formal networks underlie such complexity.
These kinds of process change the representation quite radically once formal relations between their objects are involved. In fact proper representation of this kind of complexity is through the notion of relations embodied in networks with their interactions formed by processes which operate over such networks. The main focus in network science is no longer on searching for patterns in structures which, in fact, are developed satisfactorily enough in some GIS software through well established algorithms which generate shortest routes, but on the way such networks change and evolve. An essential measure of how such systems evolve is through the way various elements are connected. We will sketch two emerging models. The first is a model where the number of objects which form the network remains fixed but the connections between these objects evolve or change. The second model developed in the next section, is where the number of objects and their connections change through time. The first model does not deal with growth in the size of the system but with the growth or change in the number of links – the connectivity of the system. The interest in this kind of model is the effect of the change in the number of links on how complex – or how connected – how accessible if you like – the system might become. The second model examines this too but is also concerned with the distribution of objects in terms of the strength or otherwise in their competition for new links, as new objects are introduced into the system. The latter is more general than the former.
We need some formal definitions to make sense of this problem. We first index an object by its node number i. We call each node ni =1 if it exists and ni =0 if it does not and thus there are n=
∑
ini fixed nodes in the system. An arc between any two nodes is defined as aij =1 if nodes i and j exist or 0 otherwise with the total number of nodes in the system a=∑
ijaij. From these definitions, the average connectivity ofthe system is given as a/ which varies from zero where no nodes are connected, to n n
where every node is connected to every other. In-degrees – incoming arcs into any node – and out-degrees – outgoing arcs from any node – are defined respectively as
∑
= j ij
i a
a and aj =
∑
i aij . Where an arc is symmetric in that it exists in bothdistance in the network taking each link as a distance of unity, then what happens is that quite suddenly, the average distance drops as nodes become more connected.
Essentially the probability of finding a shortest path between two nodes increases rapidly as more nodes are connected gradually. In short, from a situation where most people have to traverse several nodes to get from i to j, then suddenly it becomes easier to go from i to j by ever shorter routes. In the limit when all nodes are connected to each other, the average distance is unity and everyone can reach everyone else in one step. This might be pictured as the evolution of a transport network where more and more links are built as the society gets richer and people want to travel more. But if those financing the transport network realise that you can achieve the same by simply adding more capacity to the routes, then it is possible that once everyone can reach everyone else either directly or indirectly, no more links would be built and thus a kind of critical level of connectivity might be reached. In this sense, we might picture the evolution of the transport network as being self-organised to this critical level.
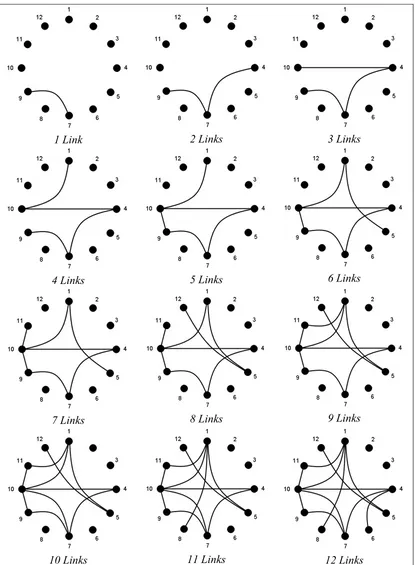
In Figure 1, we show several stages of network construction for a system composed of 12
=
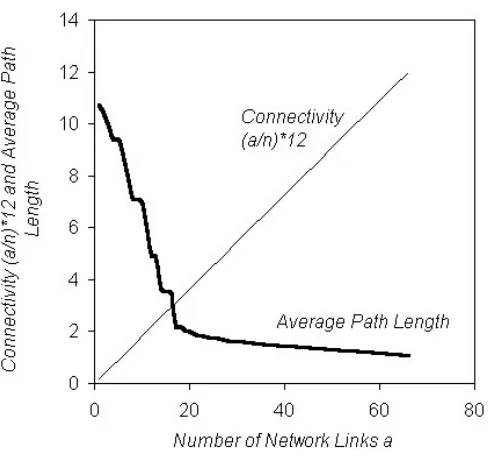
n nodes. In Figure 2, we also show a graph of the number of arcs used to connect nodes (out of a total of a=n(n−1)/2=66 for 12 nodes where we do not count the self connections from i to i) and the average distance travelled. Because up to a given level, some nodes are not reachable from any other, then with a small number of nodes, the average distance in the graph is infinity. To get over this problem, we assume that when we begin, the average distance to go anywhere from anywhere is equal to 12 units. When two nodes are connected, then the arc distance for the nodes in question is equal to 1 and then the average distance reduces quite rapidly. What actually happens is that quite suddenly we reach a threshold where every node is connected to every other directly or indirectly and then the average distance travelled from any node to any other stabilises. This is the critical threshold. After this, adding more links does not change the average distance very much. What happens to our hypothetical 12 node network is shown in Figure 2 where we also plot the graph of the average distance. Note how it stabilises when the network reaches 17 links at which point it becomes strongly connected. In fact the network can have a total of 66 two-way links, the ratio of network density varying in the same way as the number of arcs or connectivity.
1 Link 2 Links 3 Links
4 Links 5 Links 6 Links
7 Links 8 Links 9 Links
10 Links 11 Links 12 Links
13 Links 14 Links 15 Links
16 Links 17 Links: The Threshold
All Nodes Connected
Figure 1 continued
Figure 2: Link Density, Connectivity and Average Path Length
the terms calls it, is one where the dynamics keeps the system at the critical state in most situations through a combination of local actions which never combine to breach or pass the threshold needed to initiate such a radical change. Such radical changes can in fact take place in self-organised critical systems but then the system would move to another state, another regime where its fundamental structures and processes are assumed to act rather differently. Technological change sometimes leads to such fundamental transitions and for city transport, we might see the changes in connectivity as reflecting such technological shifts. A similar demonstration is given by Kauffman (1995) and summarised by Batten (2000). The problem is also related to percolation in networks where gradual increases in connectivity can suddenly lead to dramatic changes in percolation as the network connects up. Clearly the movement of fluids through porous media is a basic application but so too are diffusion problems such as forest fires.
We need to summarise what all this means. In essence, what we are saying is that systems become more complex as they accumulate interactions. In a system where interactions take place between objects, as the number of interactions grows as the square of the number of objects, then complexity increases according to this power law. However what critical thinking is all about is identifying thresholds and limits to such increasing complexity. Systems do not have undifferentiated complexity as they grow; they add links selectively and they optimise. Other examples that illustrate how such growth in complexity self-organizes are traffic density based on the number of cars on a highway; as their density increases, after a certain point they are all interacting with each other and queues and jams form whereas when traffic density is light, they barely interact with each other. Another example of how accumulated interactions lead to qualitative changes in state, to critical thresholds.
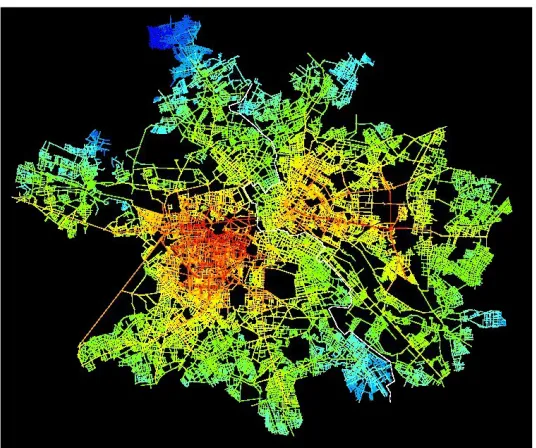
Berlin 1989 Before Unification
Berlin 1999 After Unification
Figure 3: Accessibility in Berlin: Before and After the Wall is Demolished
The colours indicate the street segment accessibility illustrating a massive increase in the central area after the wall is demolished. The scale for accessibility varies from high – red through yellow to green to
movement from nomadic existence to settled agriculture about 10000 BC is one such transition, the formation of the first cities in 3000 BC or so another. The collapse of ancient civilisation and the ensuing dark ages is a reversal while the revival of trade in the early Middle Ages and then the Renaissance yet another. Finally the Industrial Revolution is the most recent with some speculation that the ongoing transition to a Post-Industrial society is another.
In some senses, this kind of punctuated equilibrium is reminiscent of phase transitions. Whether or not the notion that civilizations are held at some sort of threshold – a level of criticality – is speculation but there is some sense in which balance is reached. Quite clearly transitions and criticality are issues which are scale dependent in both space and time, and this is an issue of profound important in applying these ideas. It is worth quoting from an early paper on these ideas as applied to urban development. Iberall and Soodak (1987), referenced in Johnston (2001) describe the process by which Europe underwent a transition,’… not unlike that between H2O molecules changing from the
fluid state of water to the crystallized state of ice: for centuries the population is liquid and unsettled – and then suddenly a network of towns comes into existence, possessing a stable structure that would persist more or less intact until the next great transformation in the nineteenth century during the rise of the industrial metropolis.” (Johnston, 2001, page 110-111).
4. The Unifying Force of Scaling
Our first demonstration of scaling relates to the paths that exist in a graph as its connectivity increases. At the critical threshold when the graph becomes strongly connected, that is when it first becomes possible to move from any node to any other, paths in the network exist on all scales. Like many mathematical demonstrations, the proof is long winded but a sketch of what happens at this point is easy to make. As the network becomes more and more connected by adding one link at a time, then more and more paths of different lengths exist with shorter paths clearly being more frequent than longer paths. As the threshold is reached, the frequency distribution of these paths implies that paths of different lengths exist on all scales, that is, that the relationship between the number and length of paths decreases according to a power law which is the hallmark of scaling. At this point the system is fractal but beyond the threshold, the frequency distribution becomes degenerate in that when the graph is completely connected, all path lengths are the same – all are of any length and thus the distribution is no longer scaling as an inverse power but is uniform. This kind of characteristic essentially implies that only at the point of criticality – at the threshold – is the system complex. Before that point it has little order but beyond that point it is disordered in an entirely different way with no structure whatsoever. Although we cannot demonstrate this here, different levels of connectivity imply different kinds of order with four classes of order being identified for different levels of connectivity as implied in Wolfram’s (2002) work on cellular automata.
connectivity less than that at the threshold, and cities with the kind of uniformity which exists beyond the threshold – must be hypothetical. It might be argued that the world is getting more complex and in some characterisations of urban evolution, it might be useful to establish the current city as the baseline, compare cities in history with this, and thus extract their increasing connectivity and changing order. But what is more likely is that any city always exists at some critical threshold and that this threshold changes qualitatively as technology changes. Mediaeval cities were indeed connected to one another but the connectivity was different in form from the industrial city. The post-industrial city will still have order on all scales but this is likely to have a different form from the industrial city, being based on multiple technologies of communication rather than the few technologies that characterise earlier city forms. Nevertheless although our first model is limited in direct applicability, it is still a useful metaphor for establishing the idea of evolving networks and it illustrates that connected cities where the connections are just enough to make the city coherent and workable, imply scaling, in contrast to hypothetical cities with too few links or too many which do not display the same levels of complexity.
Our second approach to networks is somewhat different in that our concern is with the overall properties of a growing network rather than the more static view of its connectivity. To explore these properties, we need to focus on the frequency distributions of the size of the nodes that make up these networks, where we will define the size of a node in terms of its in-degrees (or out-degrees). We refer to the frequency of a node in terms of its in-degrees, say, as N(a) where this is the number of nodes – frequency of nodes – with in-degree of size a. If we consider the distribution of these frequencies, in a graph whose arcs have been formed randomly, this distribution is Poisson but in many networks which reflect competition in space and time, there is considerably more order with such distributions following a power law. In short, what we see in the real world are numbers of nodes which vary inversely with the number of links that are associated with them. In other words, we see very many nodes with hardly any links at all but a few, very significant nodes with an extremely large number of links. Thinking now of frequency as probability, then the typical density function for networks in urban space and cyberspace is N(a)~a−λ where λ is the rate at which the
density falls off as size of the node increases. It is often easier to work with cumulative distributions and the one that is favoured here is the complementary or counter cumulative defined as r=N(A>a)~a−λ+1 which is in effect the Pareto distribution.
This is the distribution of the number of nodes greater than size a which is the rank )(r
of the node(s) in question. The rank-size distribution popularized for city systems and word frequencies by Zipf (1949) is based on a simple manipulation of this as
)] 1 /( 1 [
~ar −λ
r where aris now the in-degree associated with the node ranked r.
ideas have been applied directly to networks (Barabasi, 2002). The world wide web has been the most significant focus but other kinds of system such as social networks, food webs, cell networks, and the transport of energy, information, and people have all been shown to scale in this way: clear evidence of course for systems that grow from the bottom up.
We will show evidence of such scaling below but our concern is for plausible models of network growth that gives rise to such scaling. Many such models exist, all of them based on simple stochastic processes that generate growth through the addition of new objects that connect to existing objects in some preferential manner. The basic model goes back to Yule in the 1920s but was first properly formalised by Simon (1955). Essentially this model when applied to network growth is based on two key assumptions. The process of growth adds one new node for each time period and thus the growth of the system in terms of the total number of nodes n is directly proportional to time t. When a node is added, there is a probability ρ that it attaches itself to any node in the system and there is complementary probability 1−ρ that it attaches itself to nodes in proportion to the number of in-degrees that they already have; that is, this probability is proportional to the product of the number of nodes N(a) and their in-degrees a, aN(a). We can formalise this as follows. An increase in the in-degree of nodes )N(a is defined as
[
ρN(a−1)+(1−ρ)(a−1)N(a−1) t]
while there is corresponding decrease in the nodes[
ρN(a)+(1−ρ)aN(a) t]
. This occurs for all nodes in the system other than the new node N(0). It generates a differential equation that defines the change in the in-degree of any node as1 , )] ( ) 1 ( ) 1 )[( 1 ( )] ( ) 1 ( [ ) ( = − − − − − − − ≥ a t a aN a N a a N a N dt a
dN ρ ρ
whereas the appropriate equation for the new node a=0 is
t N dt
dN(0)=1−ρ (0) .
If we now argue that in the steady state, dN(a)/dt=0, these two equations can be manipulated accordingly. The recurrence which is established by the steady state then implies that the distributions of the in-degrees must satisfy a power law for the steady state to hold. In fact in terms of the counter cumulative or rank-size, it is easy to show that this is equivalent to r~a−[1/(1−ρ)]. This treatment follows Mitzenmacher (2003) who
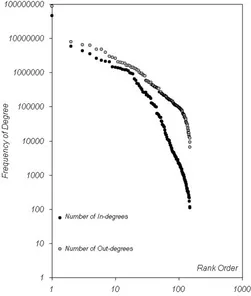
To conclude our discussion, it is worth noting that city size distributions can be generated using at least the metaphor of this network model. It is however hard to identify the kinds of connections that would be necessary to show how cities grow in this manner. In terms of physical transport, there are limits on the way cities grow in that transport links are fashioned so that they link many settlements at once. In a sense, although not random, the idea that there are more and more physical links from all cities to those further up the rank hierarchy is simply not feasible in physical terms. To show how cities grow in terms of networks, we probably need to look at information flows which are not physical in the traditional sense. If we were to assemble all the kinds of links that cities make with one another in terms of government, business, social networks and so on, then this is likely to show the requisite scaling. We do not have data to show this here but what we can do is examine some of the scaling of in-degrees and out-degrees between 180 countries with respect to the hits generated through web pages. This is based on measuring the hits made to each of the domain names – country domains where we have excluded US domain names which we cannot unambiguously associate with that country. This, we realise is a crude picture but it does reveal scaling as we illustrate in Figure 4 for the in-degrees and out-degrees for the countries in our data set. The data was produced using the AltaVista search engine (Shiode and Batty, 2000).
The relationships in Figure 4 deviate from pure scaling suggesting that the underlying probability distribution is more likely to be lognormal than a power function. In fact this is generally the case for many distributions in that the power function is usually a good approximation for the fat or heavy tail, in this case, the upper left region of the distribution. In fact for distributions where the variance of the frequencies is large, then the power function is a good approximation whereas in this example, where the distributions of in-degrees and out-degrees is clearly still changing rapidly, the variance is not as large as it will ultimately be and the approximation at this stage is less good. What this means is that we need to be very careful in studying evolving networks which clearly have not reached any steady state. Indeed all scaling models rely on finding a distribution at the steady state and comparing this with an actual distribution which is unlikely to be in the steady state. This is the Achilles heel of network science in that we do not have much idea about how actual networks grow although we are ready to make assumptions about their equilibrium form. Much remains to be done on their dynamics and this is what makes the area so challenging.
5. Small Worlds and Wide Webs
Figure 4: In-degrees and Out-degrees associated with Country Name Domains from the Alta Vista Search Engine, April 1999.
pass from the points where the letters originated, to the targets. He found that the average number of individuals through which such letters would need to pass before they reached their target was around 6. From this, he speculated that the average number of links in the social network to reach anyone from anywhere was of this order. To enable this, he directed the sender to a particular target who they did not know by asking them to send the letter to someone who they thought was closer to the target than they were, with the instruction that that person was to send it on to an even closer target, and so on until the letter arrived. The fact that it only took six steps was evidence of the fact that the world was much ‘smaller’ than had been imagined, although it has subsequently been noted that a person six steps removed from one, is still a lifetime and a continent away (Watts, 2003).
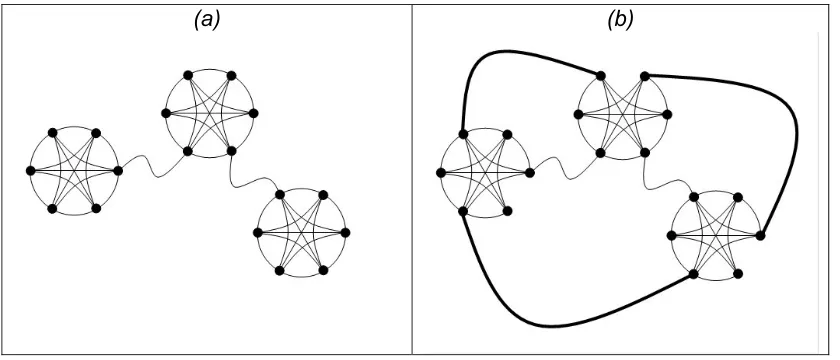
in our first example where we illustrated how distances reduced massively at the critical threshold where the graph became strongly connected. This is one extreme form where there is little local clustering but low average path lengths. At the other extreme, there are what Watts and Strogatz (1998) call ‘cave-man worlds’ where there are dense clusters strung together but these have high average path distances because one has to pass through each cluster to visit any other. Small worlds lie somewhere in between. Watts and Strogatz (1998) show that by starting from a cave-man world of dense clusters and requiring a small fraction of links to bypass the local clusters leads very quickly to a small world with a much lower average distance between the nodes.
We illustrate a picture of these kinds of network in Figure 5 where we illustrate a clustered graph (cave-man world) and a small world which results by rewiring the clustered graph through changing only 3 links. We have not computed the path lengths or the cluster values but the example is obvious enough in making the point that real networks often show a small world quality simply to enable efficient movement. The resurrection of this problem has led to a flurry of work. All kind of networks appear to have a small world quality, the world wide web being the most obvious one (Barabasi, 2002) but so do energy networks, nervous systems, chemical bonds, and social networks which spread everything from friendship to disease (Watts, 2003). Moreover small worlds can also be consistent with the kind of scaling that we illustrated in the previous section although there are many networks which scale which are not small worlds. We do not have time to describe the ways in which connectivity, scaling and structure in the various types of networks we have used here can all be integrated through the new science of networks but this is occurring rapidly at present and readers are referred to the work of Albert and Barabasi (2002) for a comprehensive survey.
We will conclude our speculations with an example which is suggestive rather than definitive but does pose the key challenge for network geography and for the way this might be incorporated in GI science and GIS. The network of streets which is the base on which cities grow and change is clearly not a small world. Street networks are planar graphs composed of junctions and street segments with junctions usually having a small number of in-degrees and out-degrees, usually no more than 6 with a mean around 4. In fact the distribution of in-degrees and out-degrees in street systems is likely to be Poisson. Only in countries such as Britain where the roundabout is used widely for street intersections are there many examples where more than four ways intersect and even there, five or six way intersections are very much a minority. However physical networks to move people in cities are small worlds if all the various networks corresponding to different modes of travel are considered. Let us consider the growth of the modern city in these terms as a metaphor for how small worlds emerge. If we go back to the medieval city, then the street system was simplistic although even there there were arrangements to control some streets for certain restricted purposes. In the industrial era, all this changed for as cities began to grow, new forms of transportation technology were needed to enable people to move greater distances at faster speeds. For example, freight was moved using canal systems while the emergence of the railways in the early 19th century in western Europe enabled people to move into peripheral
(a) (b)
Figure 5: Creating a Small World
(a) The original ‘Cave Man World’ based on weakly connected clusters
Rewiring (a) to add strategic links retaining the high degree of clustering but enabling a massive reduction in the average path length between all nodes
transport system with much restricted nodal access to the street system was layered on top of the existing roadways. In short, people would use the train with its limited stops to access the local clusters. In London, for example, which was expanding to embrace local villages in its hinterland, this was a way of connecting what were previously remotely linked clusters to each other.
In the 20th century, all this was added to by the development of the automobile and new high speed road systems. In the 1920s, the ring road and the bypass were examples of such roads with relatively restricted access compared with the basic street system but it was the development of freeways with highly restricted access in the 1950s and 1960s that really produced new layers of segregated movement akin to the railways before, that reinforced the small world quality of urban networks. As large cities have become global, then these networks have extended to the airlines, and more recently to cyberspace, to information flows which really do produce dramatic changes in the way we can communicate over very large distances. In one sense, one can see this process as adding new layers of transportation which involves a limited amount of rewiring of the old but more new wiring for new forms of movement technology with higher speeds and the need for restricted access to enable such networks to function in the way they are intended.
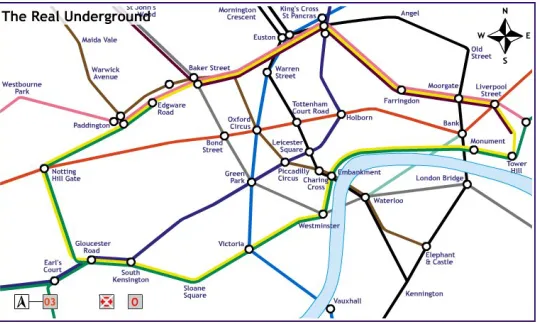
to their transport systems We are not able to illustrate this with specific examples of where the small world idea has been applied for as yet there are none but what we can do is show how new networks have been formed and provide some snapshots of how cities have evolved in terms of linking new transport nets to the existing structure. A particularly good example of the way two different networks – the street and the subway system – have co-evolved can be illustrated with respect to London, although over the last 200 years, the suburban railway system and more recently the freeway system have also reinforced the 'small worldliness' of the city. Nevertheless, the street and subway system is a good example of how it is necessary to move people around more efficiently as the city has grown, in that the subways interface with the street system at very specific points. Indeed many people who work and live in London often find it difficulty to provide an integrated picture of how these systems interact in that the subway system implies a topology quite different from the street system which is even encoded in the maps that people use.
In Figure 6, we show Sam Rich’s map of the topology of the subway system as mapped onto the actual street pattern for the central area. His web site
http://www.fourthway.co.uk/ illustrates how the real subway map can be mapped back onto Beck’s original topology which forms the basis of the current non-Euclidean map used by most travellers to navigate their way around the subway. Although we are not able to say more about this process of moving from the topological to the Euclidean and back which is another aspect of the way we might represent networks (see Cox, 2002), such transformations make it clear how small worlds can never faithfully represent movement in terms of real maps. From the real map, one can see directly how one can travel quickly between local neighbourhoods using this mapping. If one adds the suburban and mainline rail network to this, then we begin to get a more comprehensive picture of how useful the small world idea can be. Moreover we can begin to think about measuring its connectivity and clustering, the distribution of its path lengths, and then consider how these can be used to compute its efficiency. It could in fact be argued that in London, the current difficulties of travelling in the city are due to lack of investment in keeping the small world quality of the network intact, given the underinvestment in freeway and the subway systems during the last 50 years. To this picture, we must also add cyberspace and all the other networks that exist in transporting people, information, and energy, but this will remain another challenge until we perfect our measurement systems for identifying such comparatively invisible interactions.
6. Next Steps
(a) Morphing the Topological Subway Map to the Real Geography
(b) Connecting the Subway Topology to the Euclidean Street Pattern
Figure 6: The Way the London Subway Connects to the Real Street Pattern
A dynamic illustration of this morphing is at http://www.fourthway.co.uk/ (by permission Sam Rich and Transport for London)
geography more generally, and it is in this domain that we need to grasp the dynamics of networks. Okabe’s (2003) proposal is a start, notwithstanding his focus on point patterns on a network rather than relationships and interactions per se. But what we need is new research on how network systems evolve and in this regard, developments in the physical world, for river and related hydrological systems for example, in the economic world based on trade flows and exchange, and in the social world where there is a renaissance in ideas about evolving social networks, all point the way.
GIS. In this way, processes working on networks which interact with ways in which such networks evolve must provide the new focus. In this, we consider that GI science must become more substantively based, that methodologies embracing processes that have substantive content must be developed. In this the network idea is intrinsic to spatial systems where exchange and interaction are key constituents of the way in which spatial structures can be explained, represented, modelled and ultimately understood.
7. References
Albert, R., and Barabasi, A. L. (2002) Statistical Mechanics of Complex Networks, Reviews of Modern Physics, 74, 47-109.
Bak, P. (1996) How Nature Works: The Science of Self-Organized Criticality, Springer-Verlag, New York.
Barabasi, A. L. (2001) The Physics of the Web, Physics World, 14, 33-42.
Barabasi, A. L. (2002) Linked: The New Science of Networks, Perseus Publishing, New York.
Batten, D. F. (2000) Complex Landscapes of Spatial Interaction, in A. Reggiani (Editor) Spatial Economic Science, Springer, Berlin and New York, 51-74.
Batty, M. and Rana, S. (2002) Reformulating Space Syntax: The Automatic Definition and Generation of Axial Lines and Axial Maps, Working Paper 58, Centre for Advanced Spatial Analysis, University College London, at
http://www.casa.ucl.ac.uk/working_papers/paper58.pdf
Batty, M., Dodge, M., Jiang, B., and Smith, A. (1999) Geographical Information Systems and Urban Design, in J. Stillwell, S. Geertman, and S. Openshaw (Editors) Geographical Information and Planning, Springer, Heidelberg, Germany, 43-65. .
Bertalanffy, L. von 1968, General System Theory: Foundations, Development, Applications, George Braziller, New York.
Cox, L. (2002) Investigating the Cartography of the London Underground Map, MSc Thesis, Department of Geomatic Engineering, University College London, Gower Street, London.
Desyllas, J. (1999) The Relationship between Urban Street Configuration and Office Rent Patterns in Berlin, PhD Thesis, The Bartlett, University College London, Gower Street, London.
Iberall, A., Soodak, H. (1987) A Physics for Complex Systems, in F. E. Yates (Editor) Self-Organizing Systems: The Emergence of Order, Plenum Press, New York, 499-520.
Jiang, B., Claramunt, C., and Batty, M. (1999) Geometric Accessibility and Geographic Information: Extending Desktop GIS to Space Syntax, Computers, Environments and Urban Systems, 23, 127-146.
Johnston, S. (2001) Emergence: The Connected Lives of Ants, Brains, Cities, and Software, Scribner, New York.
Jong, T. de and Ritsema van Eck, J. R. (1996), Location Profile Based Measures as an Improvement on Accessibility Modelling in GIS, Computers, Environment and Urban Systems, 20, 181-190, see http://flowmap.geog.uu.nl/.
Kauffman, S. (1995) At Home in the Universe, Oxford University Press, New York.
Milgram, S. (1967) The Small World Problem, Psychology Today, 1, 61-67.
Miller, H. J. and Shaw, S-L. (2001) Geographic Information Systems for Transportation: Principles and Applications, Oxford University Press, New York.
Mitzenmacher, M. (2003) A Brief History of Generative Models for Power Law and Lognormal Distributions, Internet Mathematics, 1, forthcoming
Okabe, A. (2003) A New Approach to Spatial Analysis: Spatial Analysis on a Network with SANET, CUPUM ’03: Proceedings of the 8th International Conference on Computers in Urban Planning and Urban Management, Center for Northeast Asian Studies, Tohoku University Sendai, Japan, 9-20, see
http://okabe.t.u-tokyo.ac.jp/okabelab/atsu/sanet/sanet-index.html
Shiode, N. and Batty, M. (2000) Power Law Distributions in Real and Virtual Worlds, Working Paper 19, Centre for Advanced Spatial Analysis, University College London, at http://www.casa.ucl.ac.uk/powerlaw.pdf
Simon, H. A. (1955) On a Class of Skew Distribution Functions, Biometrika, 42, 425-440
Watts, D. J. and Strogatz, S. H. (1998) Collective Dynamics of “Small World” Networks, Nature, 393, 440-443.
Watts, D. J. (2003) Six Degrees: The Science of a Connected Age, W.W. Norton and Company, New York.
Wolfram, S. (2002) A New Kind of Science, Wolfram Media Incorporated, Urbana, IL.