Available online: http://edupediapublications.org/journals/index.php/IJR/ P a g e | 254
Fuzzy based Hough Transform for Lane Mark Detection
Manpreet Kaur1, Ravneet Kaur Sidhu2
Department of Computer Science and Engineering CT Institute of Technology and Research
Jalandhar, India
E-mail: [email protected], [email protected]2
ABSTRACT
Lane Detection plays an important role in Intelligent Transportation system. Lane detection is an important aspect of autonomous vehicles. It is also a preventive measure for road accidents. Hough Transform technique uses the edge map obtained from segmentation to detect the lane marks. The overall objective of this paper is to improve the lane detection algorithm using adaptive segmentation techniques like Otsu, Fuzzy and K-means. It has been found that the value used to segment the road image containing lanes has been taken statically. To overcome this, a new lane detection method with an adaptive segmentation value has been proposed. This approach has the ability to boost the lane colorization in Far-view, Near-view and curved road images in efficient manner by utilizing the Additive Hough Transform algorithm with optimized segmentation techniques. Various parameters like Accuracy, F-measure, Mean Square Error are used for calculating the effectiveness of this technique. The proposed technique yields accurate results as compared to existing techniques.
KEYWORD
ROI; Hough Transform; Otsu; K-means; FCM; Additive Hough Transform; Lane detection.
1. INTRODUCTION
Roads are one of the finest modes of transportation among all modes of transportation. Due to the negligence of drivers, road crashes are continuously increasing day by day. Localizing lane marks painted in the road image is called Lane detection. The major objective of lane recognition is to detect as well as recognize the lane marks painted on the road and then provide these locations to an intelligent system. In intelligent transportation systems, intelligent vehicles cooperate with smart infrastructure to achieve a safer environment and better traffic conditions.
Available online: http://edupediapublications.org/journals/index.php/IJR/ P a g e | 255 detection of straight or curved roads as well as
far-view and near-view road images.
2. LITERATURE SURVEY
Road safety is the major concern of all the lane detection systems. Most of the road accidents happen when the driver departs from the lane. The Hough Transform (HT) developed by Poly Hough in 1962 is the most commonly used technique to detect the lane marks. Many varieties and applications to detect the lane lines can be found in the literatures: Yu et al. have proposed a lane detection technique that uses the Hough Transform with a parabolic model under various road and weather conditions. A multi- resolution strategy has been employed to improve the Hough Transform but the method is computationally tractable and less prone when the noise is present in the image [1].Tseng et al. have proposed a lane detection algorithm that uses Geometry information and Hough transform but the algorithm was time-consuming and also failed when the lane boundaries intersected in a region which is a non-road area [2]. Kim et al. have presented robust lane detection and tracking algorithm based on random sample consensus and particle filtering [3]. An algorithm to detect the painted as well as unpainted roads has been designed by Khalifa that uses Hough Transform for line extraction [4]. Borkar et al. have proposed a lane detection algorithm that is suitable for detecting the lane marks at night. Low resolution Hough Transform has been employed to detect the straight lanes [5]. Wang et al. have used the ideas of region of interest and Random Hough Transform to detect the road edges [6]. Lakshmi et al. have proposed the color segmentation procedure to detect the white and yellow colored lanes on the road [7]. Mariut et al. have proposed a method that detects the lane marks using Hough Transform and has the tendency to determine travelling direction of the vehicle [8]. Ghazali et al. have proposed an
algorithm for detecting unexpected lane changes. The algorithm uses H-maxima approach and improved Hough Transform is applied on the near-field of view to detect the straight lines [9]. Phaneendra et al. have proposed an accident avoiding system that uses Hough Transform to detect the left and right marks and determines the position of the vehicle with respect to these marks and gives a warning message whenever the vehicle departs from the lane [10]. Cho et al. have proposed a lane recognition algorithm that uses multiple region of interest. Hough transform with applied accumulator cells has been applied to detect the lane marks in each region of interest [11]. Yi et al. have discussed the existing lane detection techniques and the benefits and limits of existing lane colorization problems. It has been found that most of the existing researchers have used the Hough Transform algorithm for lane detection and also neglected the overheads of existing techniques. The limitation of Hough Transform is its time complexity to solve trigonometric functions to evaluate parameter values. To reduce the limitations of existing researchers, the author has proposed a modified approach for lane detection called as Additive Hough Transform that accelerates the HT process in computationally efficient manner and making it suitable for real-time lane detection. The algorithm randomly selects two points in the image space and solves them using additive property to obtain a point in the parameter space [13]. After surveying the literature, it has been found that most of the existing researchers have used the Traditional Hough transform that is capable for detecting straight lines only and static threshold is used to segment the image to obtain the edge map. In order to reduce the limitations of existing researchers, a new strategy has been proposed in this paper that consists of Improved Hough Transform using adaptive segmentation techniques.
Available online: http://edupediapublications.org/journals/index.php/IJR/ P a g e | 256 The proposed algorithm works in two steps –
pre-processing and post-processing. Pre-processing is low level image Pre-processing that deals with images from the camera and generate useful information for detection parts. It includes ROI selection and gray scale conversion. Initially the road image is captured by the camera and a region of interest is extracted from input image in order to reduce the search area and to save computational time. Then the gray scale conversion of the image is done to reduce the processing. Post-processing consists of two steps. In first step, image segmentation is done to obtain an edge map which is used as an input by Additive Hough Transform. In second step Additive Hough Transform is applied to detect the lane marks.
3.1 Region of interest
The road image is captured by the camera that is mounted in front of the vehicle. The region of interest is extracted from the original image by cropping the road image. It increases the speed and accuracy of the lane detection algorithm. The maximum region of interest mainly lies in the bottom half of the road image where all the necessary objects such as lane markings, pedestrians and other vehicles are present. On the basis of the dimensions of the image, the region of interest is calculated by reducing each side of the image.
3.2Gray-scale Conversion
The RGB image is converted into gray- scale format. Gray-scale conversion transforms a 28 bit, 3 channel RGB color image into 8 bit, one channel and gray-scale image. Generally, road surface can be made up of various obstacles such as shadows, tire skids, oil strains, diverse pavement style which changes the color of the road surface and lane markings to form one
image region to another. Due to this, the image is converted into gray scale.
3.3Image Segmentation
Image segmentation is an important step in image analysis and object recognition. It divides an image into meaningful structures. Lane detection algorithm uses edge map of the image to detect the lanes. The proposed algorithm consists of thresholding and clustering based image segmentation techniques that are used to segment the road lane image. The various image segmentation techniques used in this algorithm are Otsu, K-means and Fuzzy segmentation technique. These segmentation techniques divide the road image using an adaptive threshold value which results in better lane detection results.
3.3.1 Otsu Threshold based segmentation
Otsu's segmentation algorithm automatically clusters pixels into two groups: background and foreground. The main idea of Otsu's algorithm is to find threshold that would maximize between-class variance and minimize within-class variance. All pixels are within-classified into two classes using the threshold. First step is to create a histogram of pixel values. After it, probability of pixel value is estimated. Pseudo code for Otsu’s algorithm is given below:
Step 1: Compute Normalized Histogram of the input image and denote the
components of the Histogram by
𝑝𝑖= 𝑛𝑖
𝑀𝑁 (1)
Where 𝑀𝑁 is pixels of the image and
𝑝𝑖denotes the number of pixels with
intensity 𝑖.
Step 2: Compute the cumulative sums,
𝑃1(𝑘), for 𝑘=0,1,2,………, L-1, using eqn.
(2).
𝑃1(𝑘) = ∑𝑘𝑖=0𝑝𝑖 (2)
Step 3: Compute the cumulative means,
𝑚(𝑘), for 𝑘=0,1,2,………, L-1, using eqn.
Available online: http://edupediapublications.org/journals/index.php/IJR/ P a g e | 257
𝑚(𝑘) = ∑𝑘𝑖=0𝑖𝑝𝑖 (3)
Step 4: Compute the global intensity
mean,𝑚𝐺 using eqn. (4).
𝑚𝐺= ∑𝐿−1𝑖=0𝑖𝑝𝑖 (4)
Step5: Compute the between class
variance,𝜎𝐵2(𝑘) for 𝑘=0, 1, 2, L-1,
using eqn. (5).
𝜎𝐵2(𝑘) =
[𝑚𝐺𝑃1(𝑘) −𝑚(𝑘) ]2
𝑃1(𝑘)[1−𝑃1(𝑘) ] (5)
Step 6: obtain the Otsu threshold,𝑘∗ as
the value of 𝑘 for which 𝜎𝐵2(𝑘) is
maximum, using eqn. (6). 𝜎𝐵2(𝑘∗)= max
0≤𝑘≤𝑙−1𝜎𝐵
2(𝑘) (6)
The new image is reduced to a binary image where every image is transformed with a dynamic threshold.
3.3.2 K-means clustering
K-means clustering is another way of classification of given data elements through a certain number of clusters that are fixed prior. The number of clusters is selected randomly. Then the distance between the data element and cluster centre is calculated. The data element is assigned to the cluster centre whose distance from the cluster centre is minimum of all cluster centers. Then new cluster centre is recalculated using eqn. (7).
𝑣𝑖 = (1 𝑐
𝑖
⁄ ) ∑𝑐𝑖 (
𝑗=1 xi) (7)
Where ‘ci’ represents the number of data points
in ith cluster. This algorithm aims
at minimizing an objective function known as squared error function given by:
𝐽(𝑉) = ∑ ∑𝑐𝑖 (‖𝑥𝑖−𝑣𝑗‖
𝑗=1 𝑐
𝑖 =1 )2 (8)
3.3.3 Fuzzy based segmentation
The fuzzy c-means (FCM) algorithm is a clustering algorithm. It was developed by Dunn and Bezdek. The aim of FCM algorithm is to find an optimal fuzzy c-partition by evolving the
fuzzy partition matrix iteratively and computing the cluster centers [12]. In order to achieve this, the algorithm tries to minimize the objective function:
𝐽𝐹𝐶𝑀 = ∑ ∑ 𝜇𝑖𝑗𝑚(‖𝑥
𝑖− 𝑣𝑗‖ 𝐶
𝑗=1 𝑁
𝑖 =1 )2 (9)
Where m is any real number greater than 1, uij is
the degree of membership of xi in the cluster j, xi
is the ith data, 𝑣𝑗is the center of the cluster. Membership 𝜇𝑖𝑗 is given by:
𝜇𝑖𝑗 =Ʃ
𝑘=1
𝑐 [‖𝑥𝑖−𝑣𝑗‖
‖𝑥𝑖−𝑣𝑘‖]
2 𝑚−1
(10)
3.4 Hough Transform
Available online: http://edupediapublications.org/journals/index.php/IJR/ P a g e | 258
Fig.1 Hough transform for detecting straight lines .
Hough transform is unsuitable for real time applications because high computational time incurred by conventional Hough voting attributed to trigonometric functions and multiplications applied to every edge pixel.
3.5 Additive Hough Transform
From the various implementation of Hough Transform, it is known that the classic Hough algorithm has heavy calculation burden resulted into ineffectiveness to satisfy real-time request. Therefore, we modify it for detecting both straight and curved roads efficiently as well as for calculating more than one edge point. The idea is to select two points and solve them using the equations (11) and (12).
𝜃𝑖 = tan−1((𝑥𝑖− 𝑥𝑖+1)|(𝑦𝑖+1− 𝑦𝑖)) (11)
𝜌 = 𝑥𝑖cos 𝜃𝑖 + 𝑦𝑖 sin 𝜃𝑖 (12)
The corresponding accumulator units are set to zero in the parameter space. If the points exist in the parameter space the corresponding accumulators count plus 1. If not, the points are inserted into the parameter space.
4. EXPERIMENTS & RESULTS
We have performed the experiments in MATLAB under Hp computer having Intel(R) Core™ i5 processor, 32 bit windows 7 operating system, 4.00 GB RAM and RADEON Graphics. A database of more than 25 road images has been collected and is divided into three sets on the basis of curved images and images captured
by the camera from near and far. This technique has been implemented on a number of images acquired along the roads with different illumination conditions in different situations such as single/double lane marks, supplementary road marks etc.
4.1 Detection of lane marks using Hough transform and Additive Hough Transform:
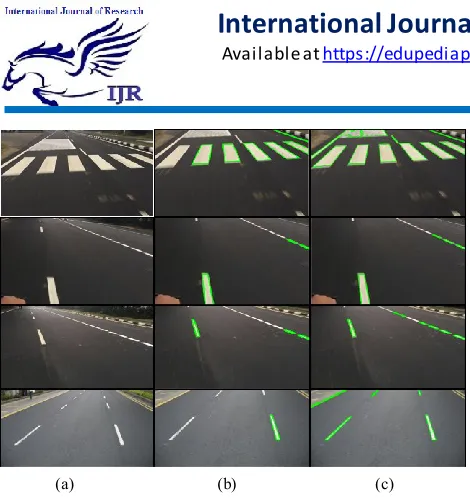
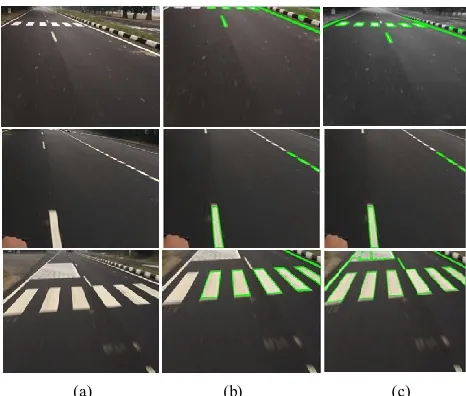
Hough Transform and Additive Hough transform techniques have been applied on the different test images. The lane detection results of the following four different test images on applying these techniques are shown in Fig. 2. In Fig.2, column (a) represents the original images captured by the camera, column (b) represents the lane detected images obtained on applying the Traditional Hough Transform technique and column (c) represents the lane detected images on applying AHT Hough Transform technique. From subjective evaluation it is evident that more lines are detected by AHT as compared to HT. Also to evaluate the performance of HT and AHT, the average values of Accuracy, F-measure and MSE are evaluated for three image sets. The average values of these parameters are shown in Tables 1, 2, and 3. From experimental results and performance measures, it is vivid that results of AHT are more accurate as compared to HT.
ρ
ρ = xcosθ+ysinθ
Available online: http://edupediapublications.org/journals/index.php/IJR/ P a g e | 259 Performance Evaluation:
Performance Evaluation table shows the analysis of lane detection techniques using different parameters such as Geometric Accuracy, F-measure and MSE. The average values of parameters of conventional and new techniques have been calculated to analyze the performance. Performance evaluation tables are shown for three sets of images named as sets containing images captured by the camera from Far, Near-view and a set containing curved lane images.
a) Accuracy
Accuracy is the major requirement of the lane detection techniques. Geometric accuracy is the accuracy of a resulted image compared to the original image. In Table 1, 2, 3, Accuracy value obtained by HT and AHT techniques for Far-view, Near-view and Curved lane images is shown. From table values, it is clear that accuracy of AHT is more as compared to HT.
Table 1 Performance evaluations of Accuracy, F-measure and MSE on applying HT and AHT techniques on Far-view images.
IM
G. ACCURACY HT AHT HT F-MEASURE AHT HT MSE AHT
1 0.3597 0.4259 59.2136 62.8741 0.5562 0.5310 2 0.5246 0.5891 68.3042 71.4368 0.4871 0.3935 3 0.8523 0.9173 89.4269 93.7638 0.0924 0.0779 4 0.8621 0.8906 88.5713 92.1536 0.0648 0.0601 5 0.7953 0.8261 84.1367 87.3642 0.1726 0.1587 6 0.8796 0.9083 86.7432 91.7680 0.0982 0.0900 7 0.8478 0.8957 88.2149 94.5796 0.0824 0.0781 8 0.8876 0.9310 87.1567 90.2926 0.2493 0.2105 9 0.7820 0.8196 89.2674 93.2478 0.0416 0.0397 10 0.8936 0.9279 82.3648 87.4965 0.0587 0.0429 11 0.8706 0.9201 88.2146 92.7543 0.0816 0.0631 12 0.9150 0.9486 84.2397 90.7462 0.0220 0.2114 Avg
. 0.7892 0.8334 52.9878 87.3731 0.1672 0.1630
b) F-measure
F-measure parameter is used to compute the average of information retrieval precision and recall matrices.
Table 2 Performance evaluations of Accuracy, F-measure and MSE on applying HT and AHT techniques on Near-view images.
IM
G. ACCURACY HT AHT HT F-MEASURE AHT HT MSE AHT
1 0.1478 0.1834 9.2197 11.0130 0.9754 0.9527 2 0.6520 0.6982 79.2036 82.9742 0.3152 0.2942 3 0.8472 0.8860 88.3796 92.7481 0.1287 0.0963 4 0.6752 0.7089 79.1053 82.7952 0.3168 0.2840 5 0.8950 0.9581 92.1406 95.1009 0.0298 0.0176 6 0.7835 0.8509 86.4113 89.9745 0.3249 0.2067 7 0.8291 0.8862 90.2014 92.4978 0.1921 0.1132 8 0.8973 0.9359 92.3674 95.7201 0.0845 0.0798 9 0.7924 0.8660 89.4783 90.3478 0.2871 0.1392 10 0.7861 0.8446 88.3607 90.8119 0.4129 0.2510 11 0.5532 0.5982 71.2413 74.2940 0.4073 0.3823 12 0.5607 0.6391 75.4971 78.3495 0.3574 0.3341 Avg. 0.7016 0.7546 78.4671 81.3855 0.3193 0.2625
Fig.2 (a) Input Image; (b) Traditional Hough Transform lane detected image; (c) Additive Hough Transform lane detected image.
Available online: http://edupediapublications.org/journals/index.php/IJR/ P a g e | 260 A larger F-measure value indicates high
classification or clustering quality. In Table 1, 2, 3, F-measure value obtained by HT and AHT techniques for Far-view, Near-view and Curved lane images is shown. From table values, it is clear that F-measure of AHT is more for all image sets as compared to HT.
c) Mean Square Error
Mean Square Error is a risk function corresponding to expected value of squared error loss or quadrate loss. It is a measure of image quality index. The large value of MSE means the image is a poor quality image. In Table 1, 2, 3, the MSE taken by HT and AHT techniques on Far-view, near-view and curved images is shown. From table values, it is clear that AHT has least value of MSE for all image sets as compared to HT.
Table 3 Performance evaluations of Accuracy, F-measure and MSE on applying HT and AHT techniques on Curved lane images.
IM
G. ACCURACY HT AHT HT F-MEASURE AHT HT MSE AHT
1 0.1587 0.1979 9.1276 12.7569 0.9590 0.9406 2 0.8852 0.9167 90.0378 94.3715 0.1084 0.0981 3 0.8219 0.8892 91.0078 93.6473 0.1162 0.0982 4 0.1086 0.1379 19.6347 24.8413 0.9634 0.8796 5 0.8331 0.8856 89.1439 92.9309 4.1009 2.9645 Av
g.
0.5615 0.6054 59.7903 63.7095 1.2495 0.9962
4.2 Improved Hough Transform using segmentation techniques:
Additive Hough Transform (AHT) technique uses an edge map obtained by image gradient processing method as an input for lane detection. The threshold value used to segment the image is taken statically. Therefore adaptive threshold value is required to improve the results further. The Additive Hough Transform technique is applied with three adaptive segmentation techniques based on Otsu
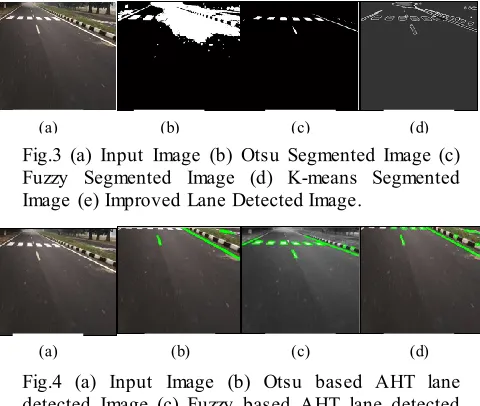
Algorithm, Fuzzy Segmentation algorithm and K-means clustering algorithm. These techniques are applied on three data sets of images that contain images captured by the camera from far view, near view and curved images. The segmentation results obtained by Otsu, Fuzzy and K-means are shown in Fig.3. From visual perspective, it is clear that the segmentation results of Fuzzy are more accurate than others.
In Fig. 4, the lane detection results of AHT by using Otsu, Fuzzy and K-means segmentation are shown.
Table 4 Performance evaluation of Accuracy on applying segmentation based AHT techniques on Far-view images.
Accuracy Evaluation IMG. IMPRO VED AHT
O TSU FUZZY K-MEANS 1 0.8965 0.9881 0.4986 2 0.6310 0.9790 0.9789 3 0.9496 0.9843 0.9484 4 0.9559 0.9804 0.9437 5 0.8557 0.9700 0.9590 6 0.9538 0.9968 0.9633 7 0.9485 0.9966 0.9258 8 0.9638 0.9780 0.9590 9 0.8584 0.9983 0.8408
(a) (b) (c) (d)
Fig.3 (a) Input Image (b) Otsu Segmented Image (c) Fuzzy Segmented Image (d) K-means Segmented Image (e) Improved Lane Detected Image.
(a) (b) (c) (d)
Available online: http://edupediapublications.org/journals/index.php/IJR/ P a g e | 261
10 0.9675 0.9768 0.9753 11 0.9637 0.9773 0.9609 12 0.9808 0.9832 0.9811 Avg. 0.9104 0.9841 0.9112
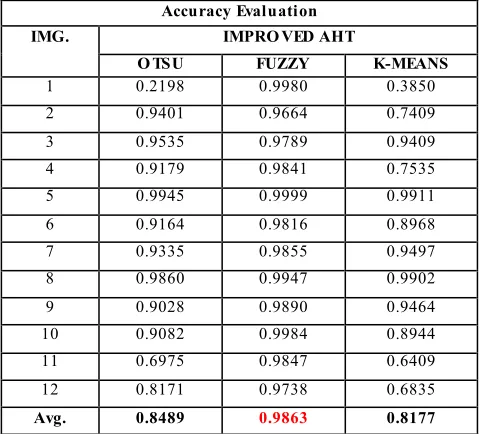
From the experimental results, it is vivid that Fuzzy based AHT gives more accurate lane results as compared to the other techniques. In Table 4, 5, 6, accuracy values obtained by segmentation based AHT techniques on far-view, near- view and curved lane images are shown. From the table values, it is vivid that Fuzzy based AHT has more accuracy as compared to Otsu and K-means based AHT for all image sets.
Table 5 Performance evaluation of Accuracy on applying segmentation based AHT techniques on Near-view images.
Accuracy Evaluation IMG. IMPRO VED AHT
O TSU FUZZY K-MEANS 1 0.2198 0.9980 0.3850 2 0.9401 0.9664 0.7409 3 0.9535 0.9789 0.9409 4 0.9179 0.9841 0.7535 5 0.9945 0.9999 0.9911 6 0.9164 0.9816 0.8968 7 0.9335 0.9855 0.9497 8 0.9860 0.9947 0.9902 9 0.9028 0.9890 0.9464 10 0.9082 0.9984 0.8944 11 0.6975 0.9847 0.6409 12 0.8171 0.9738 0.6835 Avg. 0.8489 0.9863 0.8177
In Table 7, 8, 9, F-measure values obtained by segmentation based AHT techniques on far-view, near- view and curved lane images are shown.
Table 6 Performance evaluation of Accuracy on applying conventional and segmentation techniques on Curved lane images.
Accuracy Evaluation IMG. IMPRO VED AHT
O TSU FUZZY K-MEANS
1 0.2198 0.9980 0.3850 2 0.9535 0.9789 0.9409 3 0.9496 0.9843 0.9484 4 0.1633 0.8718 0.6371 5 0.9409 0.9777 0.9453 Avg. 0.6454 0.9621 0.7713
Table 7 Performance evaluation of F-measure on applying segmentation based AHT techniques on Far-view images.
F-measure Evaluation IMG. IMPRO VED AHT
O TSU FUZZY K-MEANS 1 93.8230 99.4013 66.0001 2 76.7785 98.9357 98.9356 3 97.4138 99.1657 97.3522 4 97.6471 98.9448 97.0804 5 91.8641 98.4624 97.9056 6 96.9549 99.5355 98.1854 7 98.1074 99.8326 98.1174 8 97.2963 99.8169 96.1486 9 98.1455 98.8407 97.9074 10 92.3676 99.9006 91.6310 11 96.6253 98.4313 97.5536 12 96.9746 98.4284 98.3244 Avg. 94.4998 99.1413 94.5951
Table 8 Performance evaluation of F-measure on applying segmentation based AHT techniques on Near-view images.
F-measure Evaluation IMG. IMPRO VED AHT
Available online: http://edupediapublications.org/journals/index.php/IJR/ P a g e | 262 From table values, it is clear that Fuzzy based
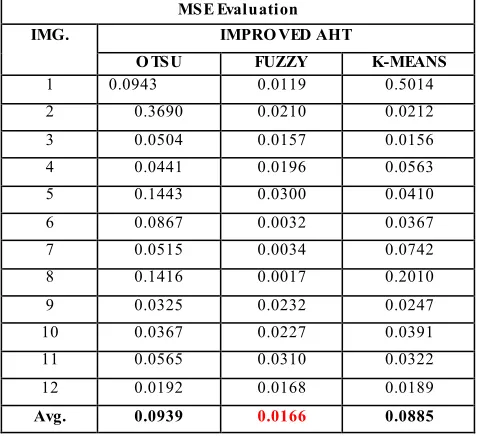
Improved AHT technique has higher F-measure values for far-view, near-view and curved images. In Table 10, 11, 12, MSE values obtained by segmentation based AHT techniques on far-view, near- view and curved lane images are shown. From table values, it is clear that Fuzzy based AHT has least value of MSE as compared to Otsu and K-means based AHT.
Table 9 Performance evaluation of F-measure on applying segmentation based AHT techniques on Curved lane images.
F-measure Evaluation IMG. IMPRO VED AHT
O TSU FUZZY K-MEANS 1 15.2197 97.9009 25.6197 2 97.9009 98.2197 96.6132 3 97.4138 99.1657 97.3522 4 27.7523 90.7637 77.6383 5 96.9569 98.8013 97.1735 Avg. 67.0487 96.9702 78.8793
Table 10 Performance evaluation of MSE on applying segmentation based AHT techniques on Far-view images.
MSE Evaluation IMG. IMPRO VED AHT
O TSU FUZZY K-MEANS 1 0.0943 0.0119 0.5014 2 0.3690 0.0210 0.0212 3 0.0504 0.0157 0.0156 4 0.0441 0.0196 0.0563 5 0.1443 0.0300 0.0410 6 0.0867 0.0032 0.0367 7 0.0515 0.0034 0.0742 8 0.1416 0.0017 0.2010 9 0.0325 0.0232 0.0247 10 0.0367 0.0227 0.0391 11 0.0565 0.0310 0.0322 12 0.0192 0.0168 0.0189 Avg. 0.0939 0.0166 0.0885
Table 11 Performance evaluation of MSE on applying segmentation based AHT techniques on Curved images.
MSE Evaluation IMG. IMPRO VED AHT
O TSU FUZZY K-MEANS 1 0.9493 0.0020 0.8963 2 0.0465 0.0211 0.0591 3 0.0504 0.0157 0.0516 4 0.8367 0.1282 0.3629 5 1.4766 0.0223 0.0547 Avg. 0.6719 0.0378 0.2849
Table 12 Performance evaluation of MSE on applying segmentation based AHT techniques on Near-view images.
MSE Evaluation IMG. IMPRO VED AHT
O TSU FUZZY K-MEANS 1 0.9493 0.0020 0.8963 2 0.0599 0.0336 0.2591 3 0.0465 0.0211 0.0591 4 0.0821 0.0159 0.2465 5 0.0055 0.0010 0.0089 6 0.0836 0.0184 0.1024 7 0.0665 0.0145 0.0503 8 0.0629 0.0053 0.0421 9 0.0972 0.0110 0.0602 10 0.0918 0.0016 0.1056 11 0.3025 0.0153 0.3591 12 0.1829 0.0262 0.3165 Avg. 0.1692 0.0138 0.2088
From the experiments and performance
measures, it is clear that Fuzzy based Hough Transform yields better lane detection results for three types of image sets than Otsu and K-means based AHT and is capable to detect lanes from far-view and near view of image as well as to detect straight or curved road lanes.
4.2 Fuzzy based Hough Transform:
Available online: http://edupediapublications.org/journals/index.php/IJR/ P a g e | 263 HT as compared to AHT technique. Fig. 5
shows the enhanced lane detection results of original image obtained by using AHT and Fuzzy based HT techniques. Performance evaluation Tables 13, 14, 15 are showing the comparison and complete analysis of AHT and Fuzzy based HT techniques. In Table 13, for the Far-view images, the average values of Accuracy, F-measure and MSE obtained by AHT and Fuzzy based Hough Transform techniques are shown. From the table values, it is clear that the results of Fuzzy based Hough transform technique are more accurate as compare to AHT technique.
Table 13 Performance evaluations of Accuracy, F-measure and MSE on applying AHT and Fuzzy based HT techniques on Far-view images.
IMG. ACCURACY F-MEASURE MSE
AHT Fuzzy
based HT AHT Fuzzy based HT
AHT Fuzzy based HT
1 0.4259 0.9881 62.8741 99.4013 0.5310 0.0119
2 0.5891 0.9790 71.4368 98.9357 0.3935 0.0210
3 0.9173 0.9843 93.7638 99.1657 0.0779 0.0157
4 0.8906 0.9804 92.1536 98.9448 0.0601 0.0196
5 0.8261 0.9700 87.3642 98.4624 0.1587 0.0300
6 0.9083 0.9968 91.7680 99.5355 0.0900 0.0032
7 0.8957 0.9966 94.5796 99.8326 0.0781 0.0034
8 0.9310 0.9780 90.2926 99.8169 0.2105 0.0017
9 0.8196 0.9983 93.2478 98.8407 0.0397 0.0232
10 0.9279 0.9768 87.4965 99.9006 0.0429 0.0227
11 0.9201 0.9773 92.7543 98.4313 0.0631 0.0310
12 0.9486 0.9832 90.7462 98.4284 0.2114 0.0168
Avg. 0.8334 0.9841 87.3731 99.1413 0.1630 0.0166
Table 14 Performance evaluations of Accuracy, F-measure and MSE on applying AHT and Fuzzy based HT techniques on Near-view images.
IM
G. ACCURACY F-MEASURE MSE AHT Fuzzy
based HT
AHT Fuzzy based HT
AHT Fuzzy based HT 1 0.1834 0.9980 11.0130 97.9879 0.9527 0.0020
2 0.6982 0.9664 82.9742 97.6440 0.2942 0.0336
3 0.8860 0.9789 92.7481 98.9057 0.0963 0.0211
4 0.7089 0.9841 82.7952 98.8982 0.2840 0.0159
5 0.9581 0.9999 95.1009 99.9972 0.0176 0.0010
6 0.8509 0.9816 89.9745 98.7349 0.2067 0.0184
7 0.8862 0.9855 92.4978 99.0822 0.1132 0.0145
8 0.9359 0.9947 95.7201 99.7182 0.0798 0.0053
9 0.8660 0.9890 90.3478 99.3457 0.1392 0.0110
10 0.8446 0.9984 90.8119 99.9116 0.2510 0.0016
11 0.5982 0.9847 74.2940 98.8995 0.3823 0.0153
12 0.6391 0.9738 78.3495 98.0860 0.3341 0.0262
Av
g. 0.7546 0.9863 81.3855 98.9342 0.2625 0.0138
Table 15 Performance evaluations of Accuracy, F-measure and MSE on applying AHT and Fuzzy based HT techniques on Curved lane images.
IM
G. ACCURACY F-MEASURE MSE AHT Fuzzy
based HT
AHT Fuzzy based HT
AHT Fuzzy based HT
(a) (b) (c)
Available online: http://edupediapublications.org/journals/index.php/IJR/ P a g e | 264
1 0.1979 0.9980 12.7569 97.9009 0.9406 0.0020
2 0.9167 0.9789 94.3715 98.2197 0.0981 0.0211
3 0.8892 0.9843 93.6473 99.1657 0.0982 0.0157
4 0.1379 0.8718 24.8413 90.7637 0.8796 0.1282
5 0.8856 0.9777 92.9309 98.8013 2.9645 0.0223
Avg. 0.6054 0.9621 63.7095 96.9702 0.9962 0.0378
From subjective analysis and performance measures, it is observed that Fuzzy based HT technique gives more accurate lane detection results than AHT technique.
5. CONCLUSION
The lane detection technique is an essence of Intelligent Transportation Systems. It has been found that the value used to segment the image in lane detection algorithm is taken as static. To overcome this limitation, we have introduced a modified Hough approach that uses different adaptive segmentation techniques like Otsu, Fuzzy and K-means clustering to enhance the segmentation results which in turn results in better lane detection. The proposed technique is implemented on a database of more than 25 road images that is further divided into three image sets based on images captured by the camera from Far-view, near-view and curved. From quality measures, it has been analyzed that the value obtained by Fuzzy based HT technique is more efficient than HT and AHT techniques. Fuzzy based Hough Transform technique yields more accurate results for Far-view, Near-view and Curved images than other techniques. Therefore, the proposed technique is capable to detect straight as well as curved lanes. In the future, we will further enhance the results of this technique using filters in order to remove the noise from the road image.
REFERENCES
[1] B. Yu and A. Jain, “Lane Boundary Detection Using a Multi-resolution Hough Transform”, in Proceedings IEEE International Conference on Image Processing, vol. 2, pp. 748 – 751, (1997).
[2] C.C. Tseng, H.Y. Cheng and B.S. Jeng, "A lane detection algorithm using geometry information and modified Hough transform”, 18th IPPR conference on
Computer Vision, Graphics and Image Processing, (2005).
[3] Z. Kim, “Robust Lane Detection and Tracking in Challenging Scenarios”, in IEEE Transactions on Intelligent Transportation Systems, vol. 9, no. 1, pp. 16 - 26, (2008).
[4] O.O. Khalifa and A.H.A Hashim, “Vision-Based Lane Detection for Autonomous Artificial Intelligent Vehicles”, in IEEE International Conference on Semantic Computing, Berkeley, CA, pp. 636 - 641, (2009).
[5] A. Borkar, M. Hayes, M. Smith and S. Pankanti, "A layered approach to robust lane detection at night," in IEEE Workshop on Computational Intelligence in vehicles and Vehicular System, pp. 51-57, (2009). [6] Z. Teng, J.H. Kin and D.J. Kang, “Real-time Lane detection by using multiple cues”, in IEEE International Conference on Control Automation and Systems, pp. 2334 - 2337, (2010).
[7] J. Wang, Y. Wu, Z. Liang and Y. Xi, “Lane detection based on random Hough transform on region of interesting”, IEEE International Conference on Information and Automation, pp. 1735-1740, (2010). [8] M. DhanaLakshmi and B.J. Deepika, “A brawny multicolor lane colorization method to the Indian scenarios”, International Journal of Emerging Trends and Technology, vol. 2, no. 4, pp. 202-206, (2012).
[9] F. Mariut, C. Fosalau and D. Petrisor, “Lane Mark Detection Using Hough Transform", IEEE International Conference and Exposition on Electrical and Power Engineering, pp. 871- 875, (2012).
[10] K. Ghazali, R. Xiao and J. Ma, “ Road Lane Detection Using H-Maxima and Improved Hough Transform”, 4th International Conference on
Computational Intelligence, Modeling and Simulation, pp. 2166-8531, (2012).
Available online: http://edupediapublications.org/journals/index.php/IJR/ P a g e | 265
[12] S. Lakshmi and V. Sankaranarayanan, “A Robust Background Removal Algorithms Using Fuzzy C-means Clustering”, International Journal of Network Security and Applications, vol. 5, no. 2, pp. 93-101, (2013). [13] J.H. Cho, Y.M. Jang and S.B. Cho, "Lane recognition algorithm using the Hough Transform with applied accumulator cells in the multi-channel ROI", 18th IEEE International Symposium in Consumer Electronics, pp. 1-3, (2014).