ISSN 2348 – 7968
472
Assessment of Conventional and Improved SAPV Sizing Methods
Using Statistical Indicator
NurDalilah Nordin1,2 and Hasimah Abdul Rahman1,2*
1 Centre of Electrical Energy System, Institute of Future Energy, UniversitiTeknologi Malaysia,
Skudai, 81310Johor Bahru,Malaysia
2Faculty of Electrical Engineering, UniversitiTeknologi Malaysia,
Skudai, 81310Johor Bahru,Malaysia
Abstract
Photovoltaic (PV) system sizing installation tools have played an important role in order to avoid undersizing or oversizing of system components which lead to inaccurate initial costing. In addition, the system is usually designed to fulfill the specific load demand, which close to its point of utilization. This paper presents an assessment of a conventional method (CM) and an improved standalone photovoltaic sizing method (ISAPVSM) by employing statistical evaluations i.e. RMSE, MBE and MAPE .The findings show that the improved sizing method gives lower LCOE and optimum components configuration for SAPV system.
Keywords:Optimal Sizing, Stand Alone, Photovoltaic, Validations, Renewable Energy.
1. Introduction
Malaysia is located in equatorial zone, between 100˚ to 120˚ in east longitude and between 1˚ to 7˚ in north latitude. The country is still in urbanization process, and based on [1], the level of electrification in Malaysia's rural area in 2012 is still not exceeded 96%. In addition, past researches indicated that electricity demand and country's population have been increasing regularly for past decades [2].
However, surging oil prices, the decrease of fossil fuel sources and its effects on environment have become major concerns. Thereby, renewable energy has been explored to be alternative energy resources. Among all possible renewable energy available in Malaysia, photovoltaic (PV) generation is the most promising, since Malaysia receives abundance sunshine throughout the year.
Unfortunately, solar energy is underutilized, due to high initial cost and the requirement of large space area. The system is also unpredictable, since the energy is fluctuated throughout the day. Due to that, the generated energy will not match with the load required. Therefore, in most cases, battery is used as backup supply at night and during
cloudy days. It is important to use an efficient method to design stand alone photovoltaic (SAPV) system, so the system will not over/undersized.
The authors in [3-6]used conventional methods to design the SAPV system in order to fulfill an average daily load demand. Also they used simple calculations to determine the number of PV panels, batteries, charge controller and inverter ratings.
This paper presents a new design method to improve the published conventional technique [3], for a similar hypothetical case of typical load usage in Malaysia's residential area. Then, both methods will be evaluated using Mean Bias Error, Root Mean Square Error, and Mean Percentage Error.
2. Conventional Method (CM) of SAPV Sizing
This section discussed in detailed the calculations using conventional method in system sizing, configuration and arrangement for SAPV system, as published in [3, 7].
2.1 Estimate Load Demand
Daily DC and AC demand, EDC and EAC(Wh) is calculated
using Eq. 1 and 2, where DClosses is 0.2 and AClossesis 0.35
[7].The total energy required is calculated by employingEq. 3.Then, daily system charge requirement,
Qreq(Ah), is obtained by using Eq. 4, where VDCbus is DC
bus voltage (V).
DClosses DC
losses E *
DC (1)
AClosses AC
losses E *
AC (2)
DC AC losses losses
req AC DC E E
ISSN 2348 – 7968
473 DCbus
req req
V E
Q (4)
2.2PV Array Sizing
Based on Qreq (Ah) inEq. 4, system charging current from
PV array, Icharge (A) is calculated usingEq. 5 [7] and the
month with the lowest peak sun hour (h),PSHlowest is
selected in designing the PV array.
lowest req e
arg ch
PSH Q
I (5)
Then, number of parallel string, Npis calculated usingEq.
6, where ISCTis module's current output in STC condition
(A).Followed by the series-connected modules in a parallel string, Nmod/strgis calculatedusing Eq. 7, where Vmod_rated is the module's rated voltage and total modules
(V), NPVisdetermined by Eq. 8 [7]:
STC charge p
I I roundup
N (6)
DCbus rated mod_ strg
mod/
V V
N (7)
strg mod/ p PV N *N
N
(8)
2.3Battery Sizing
Battery capacity required (Ah), Qbatreq is calculated based
on Eq. 9 [6, 7], where Nc is battery's reserved days, and DOD is battery's depth of discharge. Nc usually set as 1- 4
days, and it is advised that battery's depth of discharge should not be over 60%. Number of batteries in series connection for a parallel string, Nbat_seriesis calculated using
Eq. 10 where Vbat is individual battery voltage (V).
Number of parallel connection, Nbat_parallelis calculated as
Eq. 11, where Qbat is individual battery capacity (Ah)[7].
DOD N * Q
Qbatreq req c (9)
bat series _ bat
V V
N DCbus (10)
bat batreq parallel
_ bat
Q Q roundup
N (11)
2.4Charge Controller Sizing
The voltage rating needs to be sized according to DC bus voltage. Most controllers have equal battery charge rating,
Icc_charge and load current rating, Icc_output (A). Icc_charge and Icc_output are calculated as Eq. 12 and 13, where PDCload is
total DC load power (W) and 1.25 is set as oversized factor to provide margin for PV module current and load current [8].
_ arg
*
*1.25
cc ch e p sc
I
N
I
(12)25 . 1 * V P I
DC DCload output
_
cc (13)
2.5Inverter Sizing
Inverter power rating , Pinvis selected using Eq. 14, where PACload is total power from AC load demand and 1.25 is set
as oversized factor [8].
25 . 1 * P
Pinv ACload (14)
3. An Improved SAPV SizingMethod
(ISAPVSM)
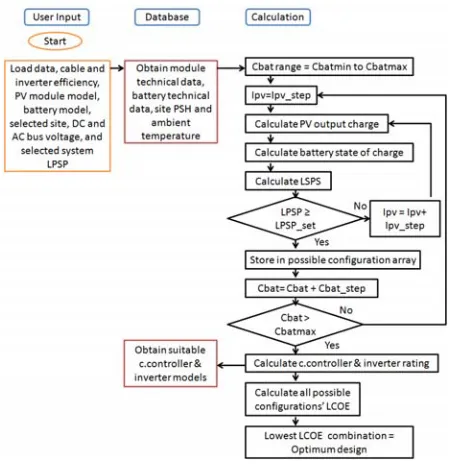
This section discussed the design steps and calculations by using new improved method as depicted in Fig. 1.
3.1 Estimate Load Demand
Design process started with an estimation of hourly energy requirement,Ereq.as stated in Eq. 3 where the hourly
system charge requirement, Qreq(Ah), is calculated using
ISSN 2348 – 7968
474 Fig. 1 Design Flowchart.
3.2PV Array Sizing
For sizing the PV array the output must be able to meet total load demand plus extra energy to cover system losses. However, designers need to obtain the hourly PSH at the selected sitebefore sizing the PV arrays.Eq. 15is only applicable to a system that involves charge controller with MPPT and the hourly output charge generated by PV generator, Qpv(Ah) is calculated as below, where Imp_stc is
the maximum power point current output of the module (A),Npv_par is number of parallel connections in module
array, temp is temperature de-rating factorwire is cable
efficiency , inv is inverter efficiency, mm is module
mismatch or power tolerance, and dirt is dirt de-rating
factor [9, 10].
dirt mm inv
wire temp par _ pv stc _ mp pv
* * *
* * N * I * ) t ( PSH ) t ( Q
(15)
3.3Battery Sizing
To estimate battery state of charge (SOC), Qbat in
amp-hour analysis is shown as Eq.16[11, 12]Existence of charge controller will prevent battery to overcharge/over-discharge. Hence, when battery is fully charged or its' capacity reaches maximum DOD; the SOC is modeled as
Eq. 17. 7.
t Q
t 1
I
t I
t
Qbat bat pv_Ah load (16)
t Q
t 1
Qbat bat (17)
3.4Charge Controller Sizing
Icc_charge and Icc_output are calculated as previous Eq.12 and
13[8]. Then, the number of charge controller required in the system, is determined using Eq. 18, 19 and 20, as follows [13]:
pv stc max _
pv P *N
P (18)
e arg ch _ cc DCbus max
_
cc V *I
P (19)
max _ cc
max _ pv cc
P P
N (20)
wherePstcis the maximum power output for a solar panel
under solar radiation of 1000W/m2(W)
;Npv is number of
PV panel in an array, and Ncc is number of charge
controller.
3.5Inverter Sizing
Inverter power rating , Pinv is selected using Eq. 14 as
stated in section 2.5, where PACloadis total power from AC
load demand and 1.25 is set as oversized factor [8].
3.6Loss of Power Supply Probability
To calculate LPSP, the equation below is used:
T
retime Powerfailu LPSP
T t
(21)
3.7Levelized Cost of Energy
LCOE is calculated by dividing producing electricity annualized cost, LCCwith total useful electrical energy
generated, EPV[4].
PV year 1
E LCC
LCOE (22)
4. Case Study
ISSN 2348 – 7968
475 model to the actual model. Low value of RMSE ad MBE
is desirable. However, for MBE and MPE, each over-estimated data will cancel any under-over-estimated data.
The expression for MBE, RSME and MPE are as presented by Eq. 22, 23 and 24.
N Q Q MBE
N 1
i new conv
(22)
N Q Q RMSE
2 N
1
i new conv (23)
N / 100 * Q
Q Q MPE
req new conv
(24)
whereQnew is supply charge conventional method, as
calculated using expression below:
ing arg disch _ bat pv conv /
new Q Q
Q (25)
5. Case Study
5.1Load Profile
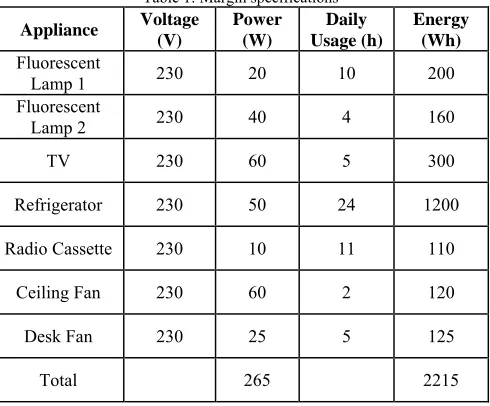
A typical house load profile for rural area in Malaysia is used as a case study andtabulated in Table I.The hourly load profile is as illustrated in Fig. 2 with an assumption that the daily energy requirement remains the same throughout the year [11].
Table 1: Margin specifications
Appliance Voltage
(V)
Power (W)
Daily Usage (h)
Energy (Wh)
Fluorescent
Lamp 1 230 20 10 200
Fluorescent
Lamp 2 230 40 4 160
TV 230 60 5 300
Refrigerator 230 50 24 1200
Radio Cassette 230 10 11 110
Ceiling Fan 230 60 2 120
Desk Fan 230 25 5 125
Total 265 2215
Fig. 2Hourly Load Profile.
5.2Components Price
Solarbuzz[14] provided a complete average monthly pricing for components related to solar industry such as module, inverter, battery, charge controller and solar electricity prices, up until March 2012. The SAPV system components prices are shown in Table 2 below, after conversion into Malaysian currency
.
Table 2: SAPV System Components
System Components Unit Price
Module MYR/Wp (≥125 W) 7.5554
Battery MYR/Output Wh 0.703 Charge Controller MYR/A 19.565
Inverter MYR/ W 2.3458
Support Structure &
Installation cost MYR/Wp 4
6. Results and Analysis
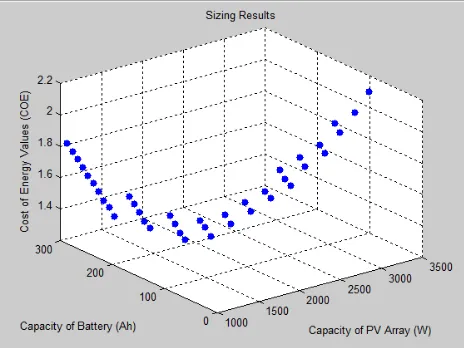
The sizing results obtained from an improved method is illustrated in Fig. 3. The optimum configuration obtained based on the lowest LCOEis a 1.4kWp PV array, 130 Ah battery, 54.3A for the minimum rating of charge controller and 340W for the minimum rating of inverter. The results are also compared with published results that used conventional sizing method in [3], as shown in Table 3.
ISSN 2348 – 7968
476 having a battery. On the other hand, the battery capacity
obtained from this improved method is almost similar to several published papers[11, 15], and much smaller compared to [3]. In the economic analysis, the system's LCOE of the improved method is MYR 1.05/kWh, which is much lower, compared to conventional method, which is RM 1.76/kWh.
Fig. 3Sizing Results by using an improved sizing method
Table 3: Comparison between CM and ISAPVSM
Improvements
Conventional[
3] Improved
Method Nordin, N.
Optimum Design Ppv=1120Wp; Cbat=500 Ah;
Ppv=1400Wp; Cbat=130Ah;
LPSP=0.01
Consider PV & battery
connection √ √
Include temperature
effect √ - Using 0.85
as average value for total
derating factors
√
Include inv √
Include dirt √
Include wire √
Includemm √
Using Hourly Analysis X-monthly √
PV generator (W) 1120 1400
Capacity Battery (Ah) 500 150
Rating Charge
Controller (A) 43.4 54.25
Rating Inverter (W) 331.25 331.25
Max DOD in
performance analysis 50% 80%
LPSP X-not involved 1%
Initial Cost (RM) 23234.27 20,873.37
LCOE (RM/kWh) 1.76 1.05
The performance of the optimized ISAPVSM system isassessed by using statistical indicator, i.e. MBE, RMSE, and MPE. The assessment summary is as in Table 4 below. By comparing the charge supply in the improved SAPV sizing methodto conventional method, the value of MBE, RMSE and MPE are 1.2554, 2.3473 and -8.8653 respectively. From the test, it can be seen that the charge supplied by system in the improved method is higher compared to the conventional method.
Table 4: Assessment by using Statistical Indicator
Methods MBE RMSE MPE
Improved Method 1.2554 2.3473 -8.8653
7. Conclusions
Solar Energy has great potential as one of the alternative energy in Malaysia. SAPV system sizing by using conventional methods have a lot of weakness and tend to give an oversized results. Hence, an improved method was proposed, to improve existing technique. Based on economic analysis, the LCOE obtained by the new method is lower than the conventional method, which is MYR 1.5/kWh. In addition, the statistical tests were performed to analyze the improved sizing method in the systems' performance compared to conventional method.
Acknowledgments
Theseauthors wish to acknowledge the supports for this research paper received from Malaysian Ministry of Higher Education (MOHE) and UniversitiTeknologi Malaysia through Research University Grant (GUP) vot 04H79.
References
[1] H. Borhanazad, S. Mekhilef, R. Saidur, and G. Boroumandjazi, "Potential application of renewable energy for rural electrification in Malaysia," Renewable Energy, vol. 59, pp. 210-219, 2013.
[2] (28 October 2014). The Malaysian Economy in Figures 2013. Available: http://www.epu.gov.my/en/the-malaysian-economy-in-figures-2013
ISSN 2348 – 7968
477
Conversion (CENCON), 2014 IEEE Conference on, 2014, pp. 152-157.
[4] J. Abdulateef, K. Sopian, W. Kader, B. Bais, R. Sirwan, B. Bakhtyar, et al., "Economic analysis of a stand-alone PV system to electrify a residential home in Malaysia," in
the 10th IASME/WSEAS International Conference on Heat Transfer, Thermal Engineering and Environment (HTE'12). Istanbul, Turkey, 2012.
[5] A. Kumra, M. Gaur, R. Kumar, C. Malvi, and R. Gupta, "SIZING OF STANDALONE PHOTOVOLTAIC SYSTEM FOR COTTAGE INDUSTRY IN A REMOTE RURAL AREA IN INDIA."
[6] A. Nafeh, "Design and Economic Analysis of a stand-alone PV system to electrify a remote area household in Egypt," Open Renewable Energy Journal, vol. 2, pp. 33-37, 2009.
[7] M. Hankins, Stand-alone Solar Electric Systems: The Earthscan Expert Handbook for Planning, Design and Installation: Earthscan, 2010.
[8] S. I. Sulaiman, T. K. A. Rahman, I. Musirin, and S. Shaari, "Sizing grid-connected photovoltaic system using genetic algorithm," in Industrial Electronics and Applications (ISIEA), 2011 IEEE Symposium on, 2011, pp. 505-509.
[9] R. Dufo-López, J. M. Lujano-Rojas, and J. L. Bernal-Agustín, "Comparison of different lead–acid battery lifetime prediction models for use in simulation of stand-alone photovoltaic systems," Applied Energy, vol. 115, pp. 242-253, 2014.
[10] S. I. Sulaiman, T. K. A. Rahman, I. Musirin, S. Shaari, and K. Sopian, "An intelligent method for sizing optimization in grid-connected photovoltaic system,"
Solar Energy, vol. 86, pp. 2067-2082, 2012.
[11] W. Shen, "Optimally sizing of solar array and battery in a standalone photovoltaic system in Malaysia,"
Renewable Energy, vol. 34, pp. 348-352, 2009.
[12] J. Li, W. Wei, and J. Xiang, "A Simple Sizing Algorithm for Stand-Alone PV/Wind/Battery Hybrid Microgrids,"
Energies, vol. 5, pp. 5307-5323, 2012.
[13] J. Abdulateef, "Simulation of solar off-grid photovoltaic system for residential unit."
[14] S. Buzz. (2012, 1 December 2014). Module Pricing. Available: http://www.solarbuzz.com/facts-and-figures/retail-price-environment/module-prices
[15] T. Khatib, A. Mohamed, K. Sopian, and M. Mahmoud, "A new approach for optimal sizing of standalone photovoltaic systems," International Journal of Photoenergy, vol. 2012, 2012.
NurDalilahNordin,was born in Johor Bahru, Malaysia. She Received her
BSc in Engineering (Electrical) from UniversitiTeknologi Malaysia in Aug-2012. She is currently working towards her MSc at Centre of Electrical energy Systems, Faculty of Electrical Engineering, UniversitiTeknologi Malaysia, since 2013. Her field of interest includes Power System Generation and Renewable Energy Technology.
Hasimah Abdul Rahman,is a Senior Lecturer at Faculty of Electrical