© The Author 2017. Published by Oxford University Press for the Infectious Diseases Society of America.
This is an Open Access article distributed under the terms of the Creative Commons Attribution License (http://creativecommons.org/licenses/by/4.0/), which permits Cost-effectiveness of community-based HIV self-testing in Blantyre, Malawi
Hendramoorthy Maheswaran1,2,3; Aileen Clarke2; Peter MacPherson1,4; Felistas Kumwenda3; David G Lalloo3,4; Elizabeth L. Corbett3,5; Stavros Petrou2;
1. Department of Public Health and Policy, University of Liverpool, UK
2. Division of Health Sciences, University of Warwick Medical School, Coventry, UK
3. Malawi-Liverpool-Wellcome Trust Clinical Research Programme, Blantyre, Malawi
4. Department of Clinical Sciences, Liverpool School of Tropical Medicine, UK
5. London School of Hygiene and Tropical Medicine, London, UK
Corresponding author:
Hendramoorthy Maheswaran
Department of Public Health and Policy
University of Liverpool
Liverpool L69 3GB (UK)
Email: [email protected]
summary: A cost-effectiveness analysis of community-based HIV self-testing (HIVST)
Abstract
Background: HIV self-testing (HIVST) is effective, with scale-up underway in sub-Saharan Africa. We assessed cost-effectiveness of adding HIVST to existing facility-based HIV testing
and counselling (HTC) services. Both 2010 (initiate at CD4<350 cells/μl) and 2015 (initiate all)
WHO guidelines for antiretroviral treatment (ART) were considered.
Methods: A microsimulation model was developed that evaluated cost-effectiveness, from both health provider and societal perspectives, of an HIVST service implemented in a
cluster-randomised trial (CRT) (ISRCTN02004005) in Malawi. The economic model drew upon health
outcomes data observed in the CRT, and primary health economic studies undertaken in the
trial population. Costs and health outcomes were evaluated over a 20-year time horizon,
using a discount rate of 3%. Probabilistic sensitivity analysis was conducted to account for
parameter uncertainty.
Results: From the health provider perspective and 20-year time horizon, facility HTC using 2010 WHO ART guidelines was the least costly (US$294.71 per person,
95%CrI:270.79-318.45) and least effective (11.64 QALYs per person, 95%CrI:11.43-11.86) strategy.
Compared to this strategy, the incremental cost-effectiveness ratio (ICER) for facility HTC
using 2015 WHO ART guidelines was US$226.85 (95%CrI:198.79-284.35) per quality-adjusted
life year (QALY) gained. The strategy of facility HTC plus HIVST, using 2010 WHO ART
guidelines, was extendedly dominated. The ICER for facility HTC plus HIVST, using 2015 WHO
ART guidelines, was US$253.90 (95%CrI:201.71-342.02) per QALY gained compared with
facility HTC and using 2015 WHO ART guidelines.
Conclusions: HIVST may be cost-effective in a Malawian population with high HIV prevalence. HIVST is suited to an early HIV diagnosis and treatment strategy.
Introduction
More than half of all people living with HIV (PLHIV), new HIV infections and HIV-related deaths are in East and Southern Africa [1]. Despite intensive efforts to meet 90-90-90 UNAIDS testing, treatment and retention goals, nearly half of PLHIV remain unaware of their HIV status [2]. HIV testing and counselling (HTC) in health facilities is essential but remains underutilised [3]. Community-based HIV testing strategies have greater reach, but delivering these services remains costly, difficult to sustain, and can fail to offer satisfactory levels of privacy [4].
HIV self-testing (HIVST) resolves many of these issues by enabling individuals to perform and interpret their own HIV test result in private [2], and can be delivered to communities safely and at low cost by trained volunteers [5, 6]. HIVST has achieves high population HTC uptake, especially amongst men, and good rates of linkage into HIV treatment [5]. However, no formal economic evaluation has been undertaken to inform policy makers in the region whether scaling-up self-testing offers efficient use of scare resources.
Recently, a pragmatic cluster-randomised trial (CRT) was undertaken to investigate the impact of offering population-wide HIVST through community volunteers in Blantyre, Malawi (ISRCTN02004005) [5]. In this study, we undertook a cost-effectiveness analysis of this community-based HIVST intervention. We sought to use clinical effectiveness and economic data collected from participants of this trial [5, 7, 8], as well as data from
secondary sources, and extrapolate the findings to the population-level and over longer time horizons than observed in the trial. We additionally explored the effects of changes in WHO and Malawian antiretroviral treatment (ART) initiation guidelines, which occurred after completion of the trial [9].
Methods
Analytic overview
We developed a microsimulation model to explore the impact of implementing HIVST in communities with high HIV prevalence and available facility-based HTC. The model simulates health provider and societal costs, and health consequences of acquiring HIV infection, HIV disease progression and initiation of ART. Simulating these costs and health consequences at the individual-level has the advantage that parameters (e.g. likelihood of accessing HIV testing) can reflect individual-level characteristics (e.g. age, sex). The model drew heavily upon evidence from the CRT [5].
HIV testing and treatment strategies
During the CRT (February 2012 to August 2014), Malawi used the 2010 WHO ART guidelines, with ART initiated if the patient had CD4 counts <350 cells/mm3, was WHO stage 3 or 4, or was pregnant or breastfeeding [10]. Since August 2016, Malawi has used the 2015 WHO ART guidelines with ART offered to all HIV-positive individuals [9]. We therefore evaluated four strategies. The base-case was defined as (1) availability of facility HTC, using 2010 ART guidelines. We compared this strategy to: (2) availability of facility HTC plus HIVST, using 2010 ART guidelines; (3) availability of facility HTC, using 2015 ART guidelines; and (4) availability of facility HTC plus HIVST, using 2015 ART guidelines. We did not consider the potential impact of other HIV prevention interventions.
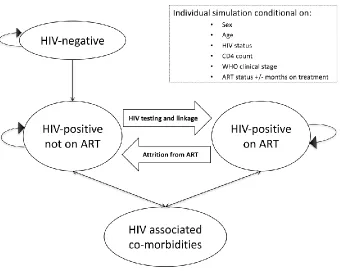
Decision-analytic modeling used TreeAge Pro 2017 (TreeAge Software, Williamstown, Massachusetts). Figure 1 provides an overview of the model structure, which contained four health states; (1) HIV-negative; (2) HIV-positive and not on ART; (3) HIV-associated co-morbidities; and (4) HIV-positive and on ART. Every month, individuals transitioned through these health states. The model records, and in some cases updates, certain characteristics including: sex; age; HIV status; CD4 count; WHO clinical stage; ART status; and months of ART received. These characteristics were used to estimate uptake of HIV testing; HIV
incidence and prevalence; eligibility for ART initiation; risk of mortality; risk of HIV associated co-morbidities; and retention on ART.
Characteristics of individuals
Baseline population characteristics were estimated from the trial post-intervention survey in control clusters, showing 58% of participants were female; mean age 30 years; HIV
prevalence ranged from 2.3% in 16-19 year old males to 28.6% in 40-49 year old females; 2.1% HIV-positive with a CD4 count =<50 cells/μl and 36.6% HIV-positive with a CD4 count >500 cells/μl (Table 1).
HIV testing and linkage into HIV care
Trial data were used to derive probabilities for accessing each testing modality by sex and age [5]. Individuals who tested HIV-negative did not re-test for one year. In the trial, the HIVST service was provided independently of existing facility-based HTC; we therefore assumed mutually exclusive probabilities for accessing HIV testing modalities. Those who tested HIV-positive through HIVST incurred an additional cost for facility-based confirmatory HIV testing. A cohort study conducted before introduction of HIVST provided estimates of linkage into HIV treatment after facility HTC [11]. Linkage into HIV treatment after HIVST was based on trial findings [5]. For strategies including 2010 WHO ART guidelines, data from the literature were used to model the likelihood of those not eligible for ART returning for repeat assessment for ART initiation [12-17].
Transition probabilities
Death occurred from HIV-related [18, 19] and unrelated causes, with Malawian specific age- and sex mortality rates used to model HIV-unrelated mortality [20]. HIV-negative individuals were at risk of acquiring HIV infection. As the model did not allow for interaction between individuals modeled [21], we assumed HIV incidence varied by age and sex but was otherwise constant and used estimates from a South African study with comparable ART coverage to Malawi [22].
For HIV-positive individuals, a CD4 count was assigned on entry into the model or when infected with HIV. HIV-positive individuals’ CD4 counts decreased if not receiving ART, and increased if receiving ART [23], with rates of change estimated from previous studies [16, 19, 24-27]. Modelled CD4 counts determined individual eligibility to start ART, and likelihood of HIV-associated co-morbidity or death. The model simulated progression to WHO clinical stages 3 or 4 [18] to account for ART eligibility under 2010 WHO guidelines.
For HIV-associated co-morbidities, we only considered the costs and impact on health-related quality of life (HRQoL) arising from hospitalisation [30]. For HIV-positive individuals not on ART, we multiplied the risk of experiencing these HIV associated co-morbidities [18, 27] by the risk of hospitalisation [18]. For HIV-positive individuals on ART, we additionally multiplied these risks by the relative reduction in hospitalisation attributable to ART [31]. We assumed that HIV-positive individuals on ART who were hospitalised continued to take ART. We assumed individuals who experienced these co-morbidities would undergo HIV testing with a similar likelihood of linking into HIV treatment as after facility HTC. Additional information about the modelling approach (Appendix A), model parameter synthesis
processes (Appendix B) and model external validation procedures (Appendix C) are provided in the appendices.
Costs
The direct health provider and societal costs of facility HTC, HIVST, assessment for ART eligibility, and ART were all derived from primary costing studies that recruited participants from the CRT [7, 8]. The costs associated with different HIV associated co-morbidities were derived from primary costing of adult medical admissions to the main public hospital in Blantyre [30]. Costs were adjusted to reflect the one-month cycle length used in the model. Societal costs incorporated estimates of direct health provider costs, direct non-medical costs and indirect costs. Table 2 shows the cost parameters in 2014 US dollars.
Health-related quality of life
The primary health outcome was quality-adjusted life years (QALYs), estimated by
multiplying health utility scores assigned to the different health states in the model by the time spent in each health state, and summing across health states [32]. Utility scores varied by HIV status. For HIV-positive individuals, utility scores decreased as CD4 count decreased, and following HIV-associated co-morbidity [33, 34]. Utility scores for all health states were derived from primary economic studies in Blantyre that recruited participants from the CRT [7, 8], or from adult medical admissions [30]. In these studies the Chichewa version of the EuroQoL EQ-5D-3L [35] was used to assess HRQoL of participants. The EQ-5D utility scores for the health states were derived using the Zimbabwean [36] EQ-5D tariff set (Table 3).
Cost-effectiveness analysis
The model was used to project the costs and QALYs for each testing/ART strategy. A time horizon of 20 years rather than the standard lifetime horizon [32] was used, given likely changes in HIV incidence, and testing and treatment strategies over time. Scenario analyses included alternative time horizons of 10 and 40 years.
Probabilistic sensitivity analysis (PSA) was used to address parameter uncertainty. The beta distribution was fitted to transition probabilities and health state utilities, and the gamma distribution for costs [37]. For each strategy, we ran 5,000 model runs, randomly selecting a value for each parameter from its distribution. For each model run, we estimated total costs and QALYs for a sample of 5000 individuals.
We report mean discounted costs and QALYs per person across these simulations for each testing/ART strategy. We estimated the mean incremental cost and incremental QALYs by comparing the least costly and least effective strategy to the next least costly and least effective strategy. The incremental cost-effectiveness ratio (ICER) for respective
results are presented with 95% credible intervals (CrI). This interval represents the 2.5th and 97.5th percentiles from the distribution of results from all simulations. Separate analyses were undertaken from health provider and societal perspectives [32]. Costs are represented in 2014 US and International dollars, and a discount rate of 3% was applied to both costs and health effects.
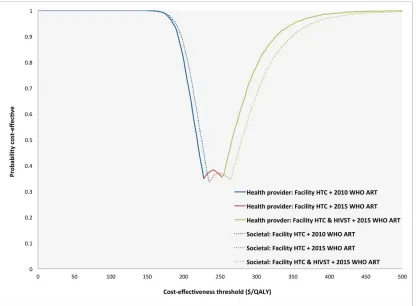
We compared estimated ICERs against increasing cost-effectiveness thresholds: US$0/QALY; US$250/QALY; US$500/QALY; US$750/QALY. For each testing/ART strategy, we present the probability of cost-effectiveness at these thresholds. This probability represents the
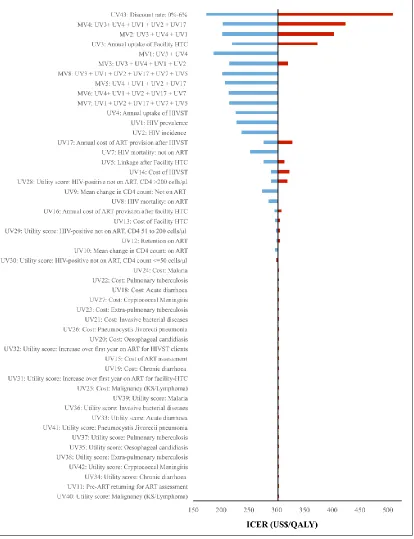
proportion of all simulations where the estimated ICER was below the specified cost-effectiveness threshold [32]. As we compared multiple strategies, and because decision makers may have different cost-effectiveness thresholds, we also present cost-effectiveness acceptability frontiers (CEAF) [38] to show which strategy is optimal at increasing cost-effectiveness thresholds. We undertook a series of deterministic sensitivity analyses, using the point estimate for all parameters except the one being explored, to evaluate the impact on the ICER. We estimated the ICERs across the plausible ranges for the parameter of interest and present findings in a tornado plot.
Results
Health provider costs
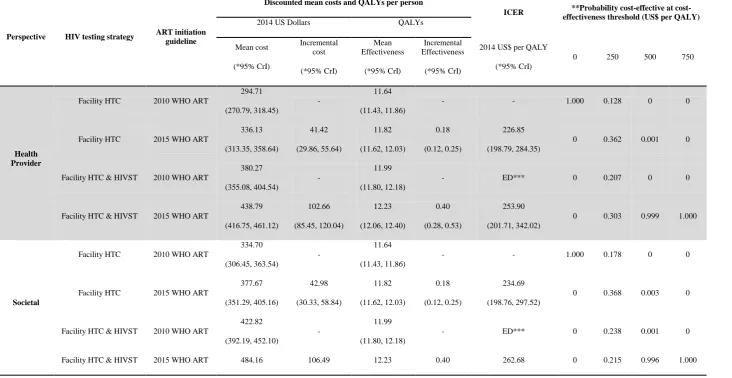
Over a 20-year time horizon and health provider perspective, availability of facility HTC and using 2010 WHO ART guidelines was the least costly strategy (US$294.71 per person, 95%CrI:270-318.45) (Table 4). The next least costly strategy was facility HTC and using 2015 WHO ART guidelines (US$336.13 per person, 95%CrI:313.35-358.64). The two strategies of facility HTC plus HIVST, using either the 2010 or 2015 WHO ART guidelines, had higher mean discounted costs of US$380.27 (95%CrI:355.08-404.54) and US$438.79 (95%CrI:416.75-461.12) per person, respectively.
Societal costs
Over a 20-year time horizon and societal perspective, facility HTC and using 2010 WHO ART guidelines was the least costly strategy (US$334.70 per person, 95%CrI:306.45-363.54). The next least costly strategy was facility HTC and using 2015 WHO ART guidelines (US$377.67 per person, 95%CrI:351.29-405.16). The two strategies of facility HTC plus HIVST, using either the 2010 or 2015 WHO ART guidelines, had higher mean discounted societal costs of US$422.82 (95%CrI:392.19-452.10) and US$484.16 (95%CrI:456.30-512.96) per person, respectively.
Health outcomes
Over a 20-year time horizon, facility HTC and using 2010 WHO ART guidelines was the least effective strategy (11.64 QALYs per person, 95%CrI:11.43-11.86). The next least effective strategy was facility HTC and using 2015 WHO ART guidelines (11.82 QALYs per person, 95%CrI:11.62-12.03). Facility HTC plus HIVST, using either the 2010 or 2015 WHO ART guidelines, were more effective, generating 11.99 (95%CrI:11.80-12.18) and 12.23 (95%CrI:12.06-12.40) QALYs per person, respectively.
Cost-effectiveness analyses
ICER for facility HTC plus HIVST and using 2015 WHO ART guidelines was US$253.90 (95%CrI:201.71-342.02) per QALY gained compared with facility HTC and using 2010 WHO ART guidelines.
From the societal perspective and 20-year time horizon, the ICER for facility HTC plus HIVST and using 2015 WHO ART guidelines was US$234.69 (95%CrI:198.76-297.52) per QALY gained compared with facility HTC and using 2010 WHO ART guidelines. The strategy of facility HTC plus HIVST and using 2010 WHO ART guidelines was extendedly dominated. The ICER for facility HTC plus HIVST and using 2015 WHO ART guidelines was US$262.68
(95%CrI:203.75-363.20) per QALY gained compared with facility HTC plus HIVST and using 2010 WHO ART guidelines. Appendix D shows the findings when the costs were estimated in 2014 International Dollars.
Table 4 shows the probability that each strategy is cost-effective at cost-effectiveness thresholds of: US$0/QALY; US$250/QALY; US$500/QALY; US$750/QALY. Figure 2 shows the CEAF for the optimal strategies across increasing cost-effectiveness threshold values. Up to a threshold value of approximately US$200, the strategy of facility HTC and using 2010 WHO ART guidelines remained optimal in cost-effectiveness terms. At a cost-effectiveness threshold of US$250/QALY, the strategy of facility HTC and using 2015 WHO ART guidelines was optimal. At threshold values higher than approximately US$270, facility HTC plus HIVST and using 2015 WHO ART guidelines was the optimal strategy.
Scenario analyses
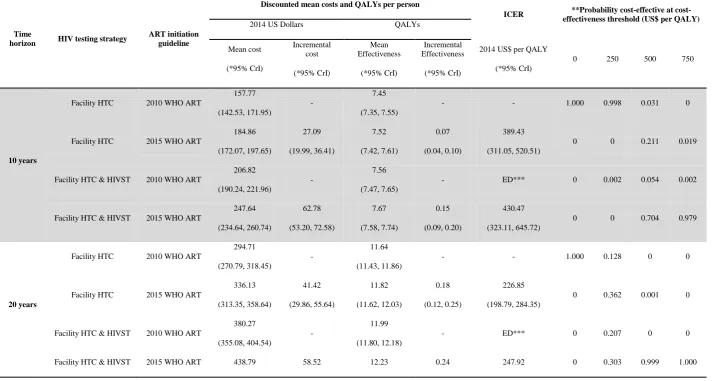
Over both the 10- and 40-year time horizons, the strategy of facility HTC plus HIVST and using 2015 WHO ART guidelines remained optimal at cost-effectiveness thresholds above US$500 per QALY (Table 5).
Deterministic sensitivity analyses
Discussion
In this study, we undertook an economic evaluation of a community-based HIV self-testing service in Blantyre, Malawi, and estimated cost-effectiveness, taking into account recent changes in the guidelines for when individuals should start ART. Overall, we found that providing community-based HIVST and using the 2015 WHO ART guidelines was the optimal strategy at cost-effective thresholds above US$270/QALY. The gross domestic product in Malawi is approximately US$250 per capita. The finding that delivering HIV testing closer to people’s homes is cost-effective is not new [39]; however, to our knowledge, this is the first evaluation of HIVST strategies using robust data from a large cluster randomised trial, combined with primary economic studies.
Adopting the 2015 WHO ART guidelines or implementing HIVST will result in higher
healthcare costs. In Malawi, adopting the 2015 WHO ART guidelines would cost healthcare providers an additional US$41 per capita over the next 20 years, and would equate to a 14% increase in HIV testing and treatment expenditure. Adopting both strategies would cost US$144 per capita over the next 20 years and 49% increase in HIV testing and treatment expenditure, but implementation would have a synergistic effect, resulting in the greatest health gains. Uptake of HIV testing remains sub-optimal in the region [2], with HIV-positive individuals still only accessing HIV treatment services with advanced HIV disease [40]. Implementing HIVST may be necessary to achieve the hoped-for health benefits from universal access to ART, but needs to be balanced against local budgetary constraints and whether investing in other HIV and non-HIV interventions offers better value for money.
We previously estimated the cost per individual tested through HIVST to be comparable to facility-based HTC [7]. The cost of HIVST kits is currently eight-times that of the rapid finger prick test kits used in health facilities. We found the cost of an HIVST episode and ART provision to be important drivers of cost-effectiveness. If the cost of an HIVST episode were lower, achievable if the cost of an HIVST kit fell from current estimates of $4 per kit, and the cost of ART provision lower, through lower ART drug costs, implementing HIVST and
adopting the 2015 WHO ART guidelines would become more affordable for policymakers in the region.
There are several limitations. Firstly, our analysis does not consider the impact of HIV transmission. In comparison to the base-case, the three other strategies examined resulted in a net gain in QALYs, as well as increased numbers on ART. As HIV infections averted depends on ART coverage amongst HIV-positive individuals, considereing HIV transmission is likely to have led to lower ICER estimates; therefore our findings represent conservative estimates. Secondly, we did not consider the impact of individuals failing ART. At the time of the trial, and health economic studies, HIV viral load monitoring was not routinely available in Malawi and only 3% of HIV-positive individuals in the region had switched to second-line ART regimens [29]. However, as all strategies examined result in more HIV-positive
individuals taking ART, the need for HIV viral load monitoring and costlier second-line ART regimens will increase. This is likely to lead to less favorable ICERs than those estimated. Finally, we only considered the impact of HIV associated illnesses that required
hospitalisations, and did not consider other illnesses which are managed in the community or at primary health clinics. Again, as the costlier strategies result in earlier initiation of ART, had we considered these additional health sequelae, the ICER estimates would likely have been lower.
NOTES
Contributors: HM conceived and designed the study, conducted cost and statistical analysis and drafted the manuscript. SP, AC and ELC supported design of study and data collection tools. All authors interpreted the data, prepared report and approved final version.
Acknowledgements: We thank the community members who participated in the study and the patients and staff at Ndirande Health Centre, Chilomoni Health Centre and Queen Elizabeth Central Hospital in Blantyre. We are grateful for all the staff at the Blantyre District Health Office and the HIV Department of the Ministry of Health of Malawi for aiding with the costing work.
Disclaimer: This paper presents independent research and the views expressed are those of the author(s) and not necessarily those of the Wellcome Trust, the NHS, the NIHR or the Department of Health.
Funding: HM was supported by the Wellcome Trust (grant number: WT097973). ELC was supported by the Wellcome Trust (grant number: WT091769). AC is supported by the NIHR CLAHRC West Midlands initiative.
References
1. UNAIDS. Global AIDS update. Available at:
http://www.unaids.org/sites/default/files/media_asset/global-AIDS-update-2016_en.pdf.
2016.2. WHO. Guidelines on HIV self-testing and partner notification: supplement to consolidated guidelines on HIV testing services, 2016.
3. Macpherson P, Lalloo DG, Choko AT, et al. Suboptimal patterns of provider initiated HIV testing and counselling, antiretroviral therapy eligibility assessment and referral in primary health clinic attendees in Blantyre, Malawi*. Trop Med Int Health 2012.
4. Suthar AB, Ford N, Bachanas PJ, et al. Towards universal voluntary HIV testing and counselling: a systematic review and meta-analysis of community-based approaches. PLoS Med 2013; 10(8): e1001496.
5. Choko AT, MacPherson P, Webb EL, et al. Uptake, Accuracy, Safety, and Linkage into Care over Two Years of Promoting Annual Self-Testing for HIV in Blantyre, Malawi: A Community-Based Prospective Study. PLoS Med 2015; 12(9): e1001873.
6. MacPherson P, Lalloo DG, Webb EL, et al. Effect of optional home initiation of HIV care following HIV self-testing on antiretroviral therapy initiation among adults in Malawi: a randomized clinical trial. JAMA 2014; 312(4): 372-9.
7. Maheswaran H, Petrou S, MacPherson P, et al. Cost and quality of life analysis of HIV self-testing and facility-based HIV testing and counselling in Blantyre, Malawi. BMC Med 2016; 14(1): 34.
8. Maheswaran H, Petrou S, MacPherson P, et al. Economic costs and health-related quality of life outcomes of HIV treatment following self- and facility-based HIV testing in a cluster randomised trial. J Acquir Immune Defic Syndr 2017.
9. WHO. Guideline on when to start antiretroviral therapy and on pre-exposure prophylaxis for HIV. Availabel at:
http://apps.who.int/iris/bitstream/10665/186275/1/9789241509565_eng.pd
f?ua=1.
2015.10. MoH. Malawi Ministry of Health Integrated HIV Program Report. Available at:
http://www.hivunitmohmw.org/Main/AntiretroviralTherapy.
2014.11. MacPherson P, Corbett EL, Makombe SD, et al. Determinants and consequences of failure of linkage to antiretroviral therapy at primary care level in Blantyre, Malawi: a prospective cohort study. PLoS One 2012; 7(9): e44794.
13. Hassan AS, Fielding KL, Thuo NM, Nabwera HM, Sanders EJ, Berkley JA. Early loss to follow-up of recently diagnosed HIV-infected adults from routine pre-ART care in a rural district hospital in Kenya: a cohort study. Trop Med Int Health 2012; 17(1): 82-93.
14. Honge BL, Jespersen S, Nordentoft PB, et al. Loss to follow-up occurs at all stages in the diagnostic and follow-up period among HIV-infected patients in Guinea-Bissau: a 7-year retrospective cohort study. BMJ Open 2013; 3(10): e003499.
15. Kranzer K, Zeinecker J, Ginsberg P, et al. Linkage to HIV care and antiretroviral therapy in Cape Town, South Africa. PLoS One 2010; 5(11): e13801.
16. Lessells RJ, Mutevedzi PC, Cooke GS, Newell ML. Retention in HIV care for individuals not yet eligible for antiretroviral therapy: rural KwaZulu-Natal, South Africa. J Acquir Immune Defic Syndr 2011; 56(3): e79-86.
17. Namusobya J, Semitala FC, Amanyire G, et al. High retention in care among HIV-infected patients entering care with CD4 levels >350 cells/muL under routine program conditions in Uganda. Clin Infect Dis 2013; 57(9): 1343-50.
18. Anglaret X, Minga A, Gabillard D, et al. AIDS and non-AIDS morbidity and mortality across the spectrum of CD4 cell counts in HIV-infected adults before starting antiretroviral therapy in Cote d'Ivoire. Clin Infect Dis 2012; 54(5): 714-23.
19. Hoffmann CJ, Schomaker M, Fox MP, et al. CD4 count slope and mortality in HIV-infected patients on antiretroviral therapy: multicohort analysis from South Africa. J Acquir Immune Defic Syndr 2013; 63(1): 34-41.
20. WHO. Global Health Observatory data repository. Available at:
http://apps.who.int/gho/data/?theme=main&vid=60980
21. Barton P, Bryan S, Robinson S. Modelling in the economic evaluation of health care: selecting the appropriate approach. J Health Serv Res Policy 2004; 9(2): 110-8.
22. Tanser F, Barnighausen T, Grapsa E, Zaidi J, Newell ML. High coverage of ART associated with decline in risk of HIV acquisition in rural KwaZulu-Natal, South Africa. Science 2013; 339(6122): 966-71.
23. Williams BG, Korenromp EL, Gouws E, Schmid GP, Auvert B, Dye C. HIV infection, antiretroviral therapy, and CD4+ cell count distributions in African populations. J Infect Dis 2006; 194(10): 1450-8.
25. Martinson NA, Gupte N, Msandiwa R, et al. CD4 and viral load dynamics in antiretroviral-naive HIV-infected adults from Soweto, South Africa: a prospective cohort. PLoS One 2014; 9(5): e96369.
26. May M, Wood R, Myer L, et al. CD4(+) T cell count decreases by ethnicity among untreated patients with HIV infection in South Africa and Switzerland. J Infect Dis 2009; 200(11): 1729-35.
27. Holmes CB, Wood R, Badri M, et al. CD4 decline and incidence of opportunistic infections in Cape Town, South Africa: implications for prophylaxis and treatment. J Acquir Immune Defic Syndr 2006; 42(4): 464-9.
28. Fox MP, Rosen S. Patient retention in antiretroviral therapy programs up to three years on treatment in sub-Saharan Africa, 2007-2009: systematic review. Trop Med Int Health 2010; 15 Suppl 1: 1-15.
29. Haas AD, Keiser O, Balestre E, et al. Monitoring and Switching of First-line Antiretroviral Therapy in sub-Saharan Africa: Collaborative Analysis of Adult Treatment Cohorts. Lancet HIV 2015; 2(7): e271-e8.
30. Maheswaran H, Petrou S, Cohen D, et al. Economic costs and health-related quality of life outcomes of hospitalised patients with high HIV prevalence: A prospective hospital cohort study in Malawi. PLoS One (under review) 2017.
31. Badri M, Maartens G, Mandalia S, et al. Cost-effectiveness of highly active antiretroviral therapy in South Africa. PLoS Med 2006; 3(1): e4.
32. Drummond MF, Sculpher MJ, Torrance GW. Methods for the economic evaluation of health care programmes: Oxford University Press, USA, 2005.
33. Tran BX, Nguyen LH, Ohinmaa A, Maher RM, Nong VM, Latkin CA. Longitudinal and cross sectional assessments of health utility in adults with HIV/AIDS: a
systematic review and meta-analysis. BMC Health Serv Res 2015; 15: 7.
34. Tran BX, Ohinmaa A, Nguyen LT. Quality of life profile and psychometric
properties of the EQ-5D-5L in HIV/AIDS patients. Health Qual Life Outcomes 2012; 10: 132.
35. Dolan P. Modeling valuations for EuroQol health states. Med Care 1997; 35(11): 1095-108.
36. Jelsma J, Hansen K, De Weerdt W, De Cock P, Kind P. How do Zimbabweans value health states? Popul Health Metr 2003; 1(1): 11.
37. Briggs A, Sculpher M, Claxton K. Decision modelling for health economic evaluation: Oxford university press, 2006.
acceptability frontier (CEAF), and the expected value of perfection information (EVPI). Value Health 2008; 11(5): 886-97.
39. Smith JA, Sharma M, Levin C, et al. Cost-effectiveness of community-based strategies to strengthen the continuum of HIV care in rural South Africa: a health economic modelling analysis. Lancet HIV 2015; 2(4): e159-e68.
Figure 1: Overview of microsimulation model developed
ART: Anti-retroviral treatment
Figure 2: Cost-effectiveness acceptability frontier showing optimal strategy at increasing cost-effectiveness threshold values for gain in quality-adjusted life year
ART: Anti-retroviral treatment HTC: HIV testing and counselling HIVST: HIV self-testing QALY: Quality-adjusted life year
2010 WHO ART initiation guidelines: CD4 count <350 cells/mm3 or WHO stage 3 or 4 2015 WHO ART initiation guidelines: start ART irrespective of CD4 count or WHO stage
Figure 3: Tornado diagram showing findings from deterministic sensitivity analysis
UV: Univariate/one-way sensitivity analysis MV: Multivariate sensitivity analysis
ART: Anti-retroviral treatment HTC: HIV testing and counselling
HIVST: HIV self-testing ICER: Incremental cost-effectiveness ratio
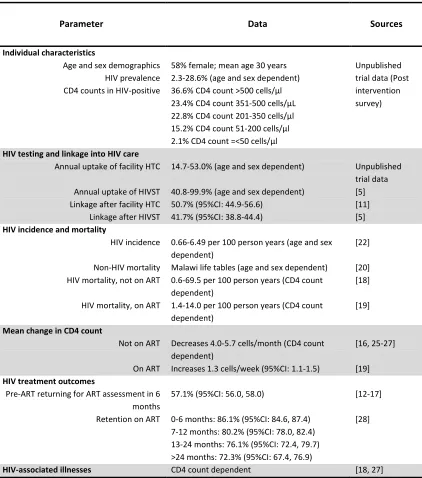
Table 1: Overview of base-case model parameters
Parameter Data Sources
Individual characteristics
Age and sex demographics HIV prevalence CD4 counts in HIV-positive
58% female; mean age 30 years 2.3-28.6% (age and sex dependent) 36.6% CD4 count >500 cells/μl 23.4% CD4 count 351-500 cells/μL 22.8% CD4 count 201-350 cells/μl 15.2% CD4 count 51-200 cells/μl 2.1% CD4 count =<50 cells/μl
Unpublished trial data (Post intervention survey)
HIV testing and linkage into HIV care
Annual uptake of facility HTC
Annual uptake of HIVST Linkage after facility HTC Linkage after HIVST
14.7-53.0% (age and sex dependent)
40.8-99.9% (age and sex dependent) 50.7% (95%CI: 44.9-56.6)
HIV incidence and mortality
HIV incidence
Non-HIV mortality HIV mortality, not on ART
HIV mortality, on ART
0.66-6.49 per 100 person years (age and sex dependent)
Malawi life tables (age and sex dependent) 0.6-69.5 per 100 person years (CD4 count dependent)
1.4-14.0 per 100 person years (CD4 count dependent)
[22]
[20] [18]
[19]
Mean change in CD4 count
Not on ART
On ART
Decreases 4.0-5.7 cells/month (CD4 count dependent)
Increases 1.3 cells/week (95%CI: 1.1-1.5)
[16, 25-27]
[19]
HIV treatment outcomes
Pre-ART returning for ART assessment in 6 months Retention on ART
57.1% (95%CI: 56.0, 58.0)
0-6 months: 86.1% (95%CI: 84.6, 87.4) 7-12 months: 80.2% (95%CI: 78.0, 82.4) 13-24 months: 76.1% (95%CI: 72.4, 79.7) >24 months: 72.3% (95%CI: 67.4, 76.9)
[12-17]
[28]
HIV-associated illnesses CD4 count dependent [18, 27]
Table 2: Health provider and societal costs for model (2014 US)
Cost Parameter
2014 US Dollars Distribution
Health provider costs Societal costs
Base case Low High Base case Low High
Facility-based HTC episode 8.90 7.53 10.57 10.68 9.91 11.45
HIV self-testing episode 8.78 7.78 10.46 8.85 7.97 9.72
Assessment for ART eligibility for all clients 22.27 21.32 23.21 25.46 24.14 26.79
Annual cost of ART for facility HTC clients 168.65 164.69 172.62 181.91 175.38 188.45
Annual cost of ART for facility HIVST clients 164.66 156.41 172.90 179.38 164.29 194.46 Gamma
Cost of hospital admission for severe HIV associated illness
Acute diarrhoea 300.97 134.37 467.56 481.56 190.30 772.82
Chronic diarrhoea 233.06 93.84 372.28 372.28 114.42 407.39
Oesophageal candidiasis 153.08 69.92 236.24 236.24 65.30 292.59
Invasive bacterial diseases 223.45 199.68 247.21 247.21 229.39 291.01
Pulmonary tuberculosis 437.68 339.02 536.33 536.33 441.79 716.81
Extra-pulmonary tuberculosis 494.68 394.83 594.53 594.53 526.86 1014.00
Malaria 199.63 106.55 292.72 292.72 69.06 647.84
Malignancy (KS/Lymphoma) 242.92 195.53 290.31 290.31 244.64 389.41
Pneumocystis Jivorecii pneumonia 325.56 268.15 382.97 382.97 294.62 495.67
Cryptococcal meningitis 846.24 651.05 1041.4
4 1041.44 760.87 1194.62
HTC: HIV testing and counselling ART: Anti-retroviral treatment
Table 3: EQ-5D utility scores for health states (Zimbabwean and UK tariff)
Utility Parameters
EQ-5D Utility scores
Distribution Base
case Low High
HIV negative 1.000 1.000 1.000
Beta HIV-positive not
on ART
CD4 >200 cells/μl 0.878 0.802 0.954 CD4 51 to 200 cells/μl 0.840 0.762 0.917 CD4 count <=50 cells/μl 0.654 0.558 0.749 Increase over first year on ART for facility-HTC clients 0.129 0.107 0.150 Increase over first year on ART for HIVST clients 0.139 0.087 0.192
Hospital admission for severe HIV associated illness
Acute diarrhea 0.367 0.143 0.590 Chronic diarrhoea 0.476 0.316 0.636 Oesophageal candidiasis 0.349 0.170 0.529 Invasive bacterial diseases 0.499 0.457 0.541 Pulmonary tuberculosis 0.429 0.349 0.509 Extra-pulmonary tuberculosis 0.389 0.296 0.481
Malaria 0.567 0.412 0.721
Malignancy (KS/Lymphoma) 0.420 0.320 0.521 Pneumocystis Jivorecii pneumonia 0.559 0.398 0.719 Cryptococcal Meningitis 0.478 0.386 0.569
HTC: HIV testing and counselling ART: Anti-retroviral treatment
Table 4: Cost-effectiveness findings from primary analysis and 20 year time horizon (2014 US Dollars)
Perspective HIV testing strategy ART initiation guideline
Discounted mean costs and QALYs per person
ICER **Probability effective at cost-effectiveness threshold (US$ per QALY) 2014 US Dollars QALYs
Mean cost
Facility HTC 2010 WHO ART
294.71
Facility HTC 2015 WHO ART
336.13
Facility HTC & HIVST 2010 WHO ART
380.27
Facility HTC & HIVST 2015 WHO ART
438.79
Facility HTC 2010 WHO ART
334.70
Facility HTC 2015 WHO ART
377.67
Facility HTC & HIVST 2010 WHO ART
(456.30, 512.96) (84.90, 128.67) (12.06, 12.40) (0.28, 0.53) (203.75, 363.20)
HTC: HIV testing and counselling HIVST: HIV self-testing ART: Anti-retroviral treatment CrI; Credible interval QALYS: Quality-adjusted life years ICER: Incremental cost-effectiveness ratio ED: Extendedly dominated
2010 WHO ART initiation guidelines: CD4 count <350 cells/mm3 or WHO stage 3 or 4 2015 WHO ART initiation guidelines: start ART irrespective of CD4 count or WHO stage
*95% CrI: represents the 2.5th and 97.5th percentile from the distribution of results from all the simulations
**Probability represents the proportion of all simulations where the estimated ICER was below the specified cost-effectiveness threshold. Total may not add up to 1.0 as for some simulations, no single scenario was found most cost-effective at given cost-effectiveness threshold
Table 5: Cost-effectiveness findings from the health provider perspective over different time horizons (2014 US Dollars)
Time
horizon HIV testing strategy
ART initiation guideline
Discounted mean costs and QALYs per person
ICER **Probability effective at cost-effectiveness threshold (US$ per QALY) 2014 US Dollars QALYs
Mean cost
Facility HTC 2010 WHO ART
157.77
Facility HTC 2015 WHO ART
184.86
Facility HTC & HIVST 2010 WHO ART
206.82
Facility HTC & HIVST 2015 WHO ART
247.64
Facility HTC 2010 WHO ART
294.71
Facility HTC 2015 WHO ART
336.13
Facility HTC & HIVST 2010 WHO ART
(416.75, 461.12) (44.32, 76.69) (12.06, 12.40) (0.16, 0.32) (207.60, 312.97)
40 years
Facility HTC 2010 WHO ART
408.07
Facility HTC 2015 WHO ART
461.25
Facility HTC & HIVST 2010 WHO ART
530.83
Facility HTC & HIVST 2015 WHO ART
602.34
HTC: HIV testing and counselling HIVST: HIV self-testing ART: Anti-retroviral treatment CrI: Credible interval QALYS: Quality-adjusted life year ICER: Incremental cost-effectiveness ratio ED: Extendedly dominated
2010 WHO ART initiation guidelines: CD4 count <350 cells/mm3 or WHO stage 3 or 4 2015 WHO ART initiation guidelines: start ART irrespective of CD4 count or WHO stage
*95% CrI: represents the 2.5th and 97.5th percentile from the distribution of results from all the simulations
**Probability represents the proportion of all simulations where the estimated ICER was below the specified cost-effectiveness threshold. *Total may not add up to 1.0 as for some simulations, no single scenario was found most cost-effective at given cost-effectiveness threshold