© 2015, IRJET.NET- All Rights Reserved
Page 870
Speech Emotion Recognition using CART algorithm
Anand C
1, Devendran B
21
Student, Electronics and Communication engineering, Maharaja Institute of Technology, Karnataka, India
2Assistant Professor, Dept. Electronics and Communication Engineering, Maharaja Institute of Technology,
Karnataka, India
---***---Abstract -
In this contribution we introduce
speech emotion recognition by CART algorithm.
Human speech emotion recognition plays very
important role in recent days to improve both
naturalness and efficiency of Human-computer
interaction. In this paper work has been done
using seven emotional categories of four different
male speakers in which human emotion detection
is based on acoustic features like pitch, energy etc,
and spectral feature MFCC. Then SVM and
CART has been used as classifier. This work
consisted of two main sections. First section is
training part and second section is testing part. In
training part we have used SVM to binarize
different voice files of different emotions like
Anger, Disgust, Fear, Happy, Neutral, Sad and
Surprise. In testing part we have used SVM to
classify features of input sample speech. And
CART classifier used again for the same dataset
and performances are compared. SVM gives
recognition rate of 92.02% and CART is of
91.78% recognition rate.
Key Words
:
Feature extraction, MFCC, SVM, CART
algorithm, Performance Parameters.
INTRODUCTION
Emotions are subjective experiences which play an important role in expressing mental and physical states of the humans and it is often associated with verity of feelings. Speech emotion recognition (SER) means to recognize speaker’s emotion by extracting the acoustic and prosody features from their speech samples [4]. Automatic emotion recognition is an increasingly attracting engineers in the field of speech processing and has became major active research topic in the field of human computer interaction (HCI) [3].Humans have natural ability and awareness in recognizing the emotions from the speech, for machines it is difficult task since machines does not have sense to analyze emotions. Machines can detect speaker and speech from speaker identification and speech recognition system. If we
implement machine with emotion recognition system through speech, then machines can also recognize emotions [6]. Emotion recognition has widespread applications in the field of human computer interaction such as interactive movies, storytelling and electronic pets and other applications like detection of mental state of human such as disappointments, frustrations, amusement etc [7].
In the field of speech emotion recognition several researches has been conducted from last two decades and proposed several different systems for recognizing emotions. These different systems are also differs by extracting different features and classifier used for classification [3]. A better feature extracted half success in recognizing emotions. Prosody features like pitch, short time energy etc and spectral features like MFCC, linear prediction cepstral coefficients (LPCC) can be extracted as features for emotion recognition. Several models are proposed earlier such as Hidden markov model (HMM), Gaussian mixture model (GMM), Support vector machine (SVM), Artificial neural network (ANN), K-nearest neighbors (KNN) can be utilized as classifiers in order to recognize the emotions.
DATABASE SELECTION
In speech emotion recognition system selection of proper database is a critical task. The efficiency of speech emotion recognition is highly depends upon the naturalness of the database selected. Different databases are implied by different researches. In this paper work Surrey audio visual expressed emotion (SAVEE) English emotional speech database of four different male speakers with 7 emotion categories like anger, disgust, fear, happy, neutral, sad and surprise are used. These speech files are of .wav format and sampled at 44.1 KHz are used for emotion recognition.
SPEECH EMOTION RECOGNITION SYSTEM
© 2015, IRJET.NET- All Rights Reserved
Page 871
Fig1.Speech emotion recognition systemSpeech emotion recognition system aims to automatically identify the emotion of human beings from speaker’s voice. It is based on the speech signal, extracting the features which contain emotional information from the speaker’s speech, and using appropriate method to recognize the emotion. This system consists of 5 steps, namely 1.Emotional speech input 2.Feature extraction and selection, 3.Training, 4.Classification, 5.Emotion recognition [5].
There are so many prosody and spectral features in voice samples which contains the emotional information. Change in this feature leads to abrupt change in the emotions. With the different emotional state, corresponding changes occurs in pitch, energy, speak rate and spectrum. In this paper a set of 13 potential features are extracted.
Pitch: It is the fundamental frequency of the sound. The relative highness and lowness of tone as perceived by the ear, which depends on the number of vibrations per second produced by the vocal card. Pitch is the main acoustic correlate of tone and intonation.
Standard deviation: Indicates the variation exists from the
mean or expected value. Lower the value of standard deviation indicates that data point tend to be nearer to the mean. Higher the value of standard deviation indicates data points are spread out over large range of values.
Energy intensity: Represents the loudness of the audio signal. It is correlated with the amplitude.
Energy entropy: It represents the abrupt change in the energy level of the audio signal.
Autocorrelation: Cross-correlation of the signal with itself. It is similarity between observations as time lag between them.
Shimmer: A frequent back and forth changes in amplitude
of voice sample. It provides an evaluation of variability of peak to peak amplitude within analyzed speech sample.
Also represents the relative period to period variability of peak to peak amplitude.
Jitter: Jitter is the deviation from true periodicity of a presumed periodic signal. In speech, it is defined as the varying pitch in the voice, which causes a rough sound. It describes varying loudness in voice.
Harmonics to noise ratio: HNR represents the degree of acoustic periodicity, it is also called as Harmonicity object. It is expressed in DB, HNR 0db means there is equal energy in harmonic and noise.
Noise to harmonic ratio: Evaluation of noise present in the
analyzed audio signal. It is average ration of inharmonic component to the harmonic component in the audio signal.
Short time energy: Short time energy provides the
convenient representation that reflects the amplitude variations. It also provides the basis for distinguishing voiced and unvoiced speech.
Zero crossing rates: ZCR is defined as rate of change of sign along the signal, i.e. it represents changes from positive to negative or back in a speech signal. ZCR is high for the unvoiced signals and low for voiced signals.
Spectral flux: Spectral flux measures how quickly power spectrum changes in present frame with respect to previous frame and it measures the changes in the power spectrum.
Spectral centroid: Spectral centroid indicates the center of mass in spectrum of the audio signal. It is the weighted mean frequency. Spectral centroid is good predictor of brightness of sound.
Spectral roll off: spectral roll off is defined as the percentile of power spectrum. Usually N is 85%-95%. This measure is useful in distinguishing voiced speech from unvoiced speech.
MFCC (Mel frequency cepstral coefficient): Mel frequency cepstral coefficient is parametric representation known as voice quality feature, widely used in the area of speech emotion recognition. It provides better rate of recognition in −both speech and emotion recognitions. MFCC is based on the human ear’s hearing, which uses nonlinear frequency unit to simulate the human auditory system. The computation of MFCC features involves steps. Firstly Fast Fourier Transform (FFT) applied to windowed signal in order to convert samples time domain into frequency domain signal. After FFT, the power coefficients are filtered by using triangular band pass filter bank also known as Mel-scale filters. Mel-frequency scale is a linear frequency spacing below 1 KHz and logarithmic above 1 KHz frequency. Mapping of linear frequency to Mel-frequency follows
Mel (f) =1127 log (1+ )
© 2015, IRJET.NET- All Rights Reserved
Page 872
Fig2 Block diagram of MFCC [3]These extracted 13 potential features are analyzed and data base is created in .mat files for 7 emotional categories. MFCC feature is selected in recognizing the emotions in SVM classification, all other features increases the accuracy of the emotion recognition. While in case of CART classification all 13 features are used in order to recognize the emotions [11-17].
IMPLIMENTATION
The system is trained and classified using SVM & CART classifiers. In speech emotion recognition system, selection of classifiers also plays important role in recognition rate of emotions.
Training: In classification, Training set used to learn the model that can classify data samples in to known classes. Testing: In order to assess the model accuracy test the model using unseen test data.
SVM (Support Vector Machine): SVM is a learning method
for pattern recognition problem introduced by V.Vapinik et al. [2]. This is a pair-wise binary classifier, means it cannot classify verity of emotions simultaneously. Main thought behind SVM classifier is transforming the original feature set to a high dimensional feature space by using the kernel function, which leads to get optimum classification in brand new feature space [6].SVM classify data through determining set of support vectors, through minimization of structural risk. Support vectors are members of the set of training inputs that outline a hyper plane in feature space. A good separation is achieved by the hyper plan that has the largest distance to nearest data point of any class, since larger the margin lower the generalization error of the classifier [1&9].
CART (Classification and Regression Tree): CART was
introduced by Leo Brieman et al. in 1984. This decision tree is a binary recursive partitioning procedure. Classification and Regression tree is a classification
method in order to construct decision trees uses historical data. Then in order to classify new data decision trees so obtained are used. Number of classes must be known a prior in order to use CART. CART uses so called learning sample which is a set of historical data with pre-assigned classes for all observations for building trees [18]. Trees are constructed in top-down, recursive, divide-and-conquer manner and are grown to a maximum size without the use of a stopping rule and then pruned back to the root through cost-complexity pruning. It is implemented serially. It is capable of processing both continuous and nominal attributes as both target and predictors [8]. The right-sized tree is identified by evaluating the predictive performance of every tree in pruning sequence. CART offers no internal performance measure of tree based training data. Instead, tree performance is measured on independent test data and tree selection proceeds only after evaluation of test-data [4]. CART mechanism includes automatic class balancing, missing value handling and dynamic feature construction and also allows cast-sensitive learning. If no test data exist and cross validation has not been performed, CART will remain agnostic regarding which tree in the sequence is best [8].
Classification tree is based on binary splitting of attributes. And it uses Gini-Index to select splitting the attributes. Gini-Index is defined as
Gini (t) =
1-Performance parameters
TP Rate: True positive rate is the proportion of examples which were classified as class x, among all examples which truly have class x. i.e. how much part of the class was captured.
FP Rate: False positive rate is the proportion of examples which were classified as x, but belongs to different class, among all examples which are not of class x.
TP Rate and FP Rate are calculated in accordance with mean and variance. For calculating TP and FP, gain is calculated by processing all the rows of uploaded file.
RESULTS
© 2015, IRJET.NET- All Rights Reserved
Page 873
Table -1: TP and FP Rate of two classifiers usingpercentile split method
Table -2: Correctly classified and incorrectly classified of two classifies using percentile split method
PERCENT AGE SPLIT (Training
sets Rest are testing sets)
CORRECTLY CLASSIFIED
INCORRECTLY CLASSIFIED
SVM CLASSIFI ER
CART CLASSIFI ER
SVM CLASSIFI ER
CART CLASSIFI ER
10 66.32% 49.7% 33.68% 50.3%
20 67.50% 52.1% 32.5% 47.9%
30 68.92% 52.85% 31.8% 47.15%
40 70.12% 61.78% 29.88% 38.22%
50 75.12% 66.78% 24.88% 33.22%
60 78.91% 74.28% 21.09% 25.72%
70 82.14% 76.78% 17.86% 23.22%
80 91.70% 85.71% 8.30% 14.29%
90 92.02% 91.78% 7.2% 8.22%
Chart -1: TP Rate v/s Percentile split
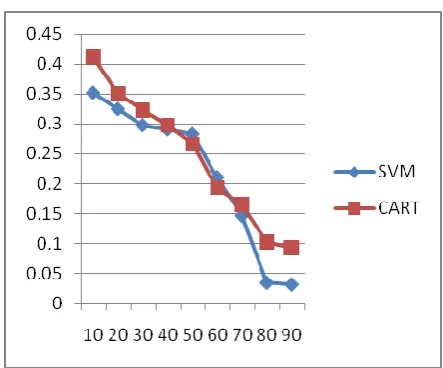
Chart-2: FP Rate v/s Percentile split
The graph in fig1 shows increasing TP rate and decreasing FP rate for both the algorithms with increasing training set, which indicates that with increasing the training set percentile the system performance increases
CONLUSION
In this paper we have implemented the emotion recognition by means of SVM and CART. SVM classifier is binary decision algorithm and classification is dependent only on the single MFFC feature. CART classifier is binary recursive decision algorithm and classification is dependent on all 13 extracted features. And results of these two algorithms are compared. The SVM gives the recognition rate of 92.01%. With lower percentile of the training set CART gives lower performance in recognizing emotion when compared to SVM. As increasing the training set percentile CART also gives the rate nearer to the SVM with recognition rate of 91.78%. CART algorithm creates more groups into inner clusters of the file stored so that the searching becomes easy and CART puts strong emphasis in searching into the inner clusters.
REFERENCES
[1] Aastha joshi. “Speech Emotion Recognition Using Combined Features of HMM & SVM Algorithm”. Volume 3, Issue 8, August 2013. International journal of advanced research in computer science and software engineering, research paper.
[2] A.Punitha, M. Kalaiselvi Geetha. “Texture based emotion recognition from facial expressions using Support Vector Machine”. International journal of computer applications. Volume 80-no 5, October 2013.
[3] Akshay S. Uthane. Dr. N .S. Nalbalwar. “Emotion recognition through speech using Gaussian mixture model and Hidden Markov Model”. Volume 3. Issue4, April 2013. Percentage
split (Training
set rest testing set)
TP RATE FP RATE
SVM CART SVM CART
10 0.663 0.497 0.352 0.412
20 0.675 0.521 0.325 0.350
30 0.689 0.528 0.298 0.323
40 0.701 0.617 0.291 0.298
50 0.752 0.667 0.283 0.266
60 0.789 0.742 0.211 0.193
70 0.821 0.767 0.147 0.165
80 0.910 0.857 0.035 0.102
© 2015, IRJET.NET- All Rights Reserved
Page 874
ISSN: 2277 128X International journal of advancedresearch in computer science and software Engineering.
[4] Ankur Sapra, Nikil Panwar, Sohan Panwar. “Emotion recognition from speech. International journal of Emerging technology and advanced Engineering”. ISSN 2250-24589, ISO 9001:2008 certified journal, volume 3, Issue 2, February 2013.
[5] Preeti Suri, Bhupinder Singh. “Enhanced HMM speech emotion recognition using SVM and Neural classifier”. International journal of computer application(0975-887) Volume 87-No.12, February 2014.
[6] Ashish B. Ingale, D S Chaudhari. “Speech emotion recognition”. International journal of soft computing and Engineering (IJSCE). ISSN:2231-2307,Volume-2, Issue 1, March 2102.
[7] Dipti D. Joshi, Prof. M. B. Zalte. “Speech emotion recognition: A Review”. IOSR journal of Electronics and communication Engineering (IOSR-JECE) ISSN:2278-2834, ISBN:2278-8735. Volume-4, Issue-4. February 2013.
[8] XindongWU, Vipin Kumar, J. Ross Quinlan, Joydeep
Ghosh, Qiang Yang, Hiroshi Motoda, Geoffrey J. McLachlan, Angus Ng, Bing Liu, Philip S. Yu, Zhi-Hua Zhou, Zhou Michael Steinbanch, David J. Hand, Dan Steinberg. “Top 10 Algorithm in data mining”. Received: July 2007/ Revised: 28 September 2007/ accepted: 8 October 2007 Publish online: 4 December 2007.
[9]Lingli Yu, Kaijun Zhou, Yishao Huang. “A Comparative Study on Support Vector Machines Classifiers for Emotional Speech Recognition”. Immune Computation (IC) Volume2, Number1, March 2014.
[10]Daniel Neiberg, Kjell Elenius and Kornel Laskowski. “Emotion Recognition in spontaneous speech using GMMs”. INTERSPEECH 2006-ICSLP.
[11]S. Demircan and H. Kahramanl. “ Feature Extraction from Speech Data for Emotion Recognition”. Journal of advances in Computer Networks. Volume-2, No1, March 2014.
[12]Mohammad Masoud Javidi and Ebrahim Fazlizadeh Roshan. “Speech Emotion Recognition by Using Combinations of C5.0, Neural Network(NN) and Support Vector Machine(SVM) Classification Methods”. Journal of mathematics and computer science 6,2013.
[13]Bjom Schuller, Gerhard Rigoll and Manfred Lang. “Hidden Markov-based Speech Emotion Recognition”. ICASSP 2003 IEEE.
[14]Qi-rong Mao and Yong-zhao Zhan. “A Novel Hierarchical Speech Emotion Recognition Method based
on Improved DDAGSVM”. ComSIS. Volume-7.No1, Special Issue, February 2010.
[15]Lawrence R. Rabiner, Michael J. Cheng, Aaron E. Rosenberg and Carol A. McGonegal. “A Comparative Performance Study of Several Pitch Detection Algorithm”. IEEE Transaction on acoustic speech and signal processing . Volume ASSP-24.No 5. October 1976.
[16]Sassan Ahmadi and Andreas S. Spanias. “Cepstrum-based Pitch detection Using a New Statistical V/UV Classification Algorithm”. IEEE Transaction on speech and audio processing. Volume-7.No3,May 1999.
[17]Iker Luengo, Ibon Sarataxaga, Eva Navas, Inmaculada Hernaez, John Sanchez, Inaki Sainz. “Evaluation of Pitch Detection Algorithms under Real Conditions”. IEEE 2007 International Conference on Acoustic Speech and Signal Processing (ICASSP 2007).
[18]http:/www.CART-Wikipedia, the free encyclopedia.hmt access on 2015.
BIOGRAPHIES
Anand C received Degree in Electronics and communication Engineering form visvesvaraya Technological University, Belgaum, Karnataka in 2011.and he is currently pursuing the M.tech degree (Signal processing)at Maharaja institute of technology, Mysore.