© 2015, IRJET.NET- All Rights Reserved
Page 1377
Congestion Management by Generator Rescheduling and FACTS
Devices using Multi Objective Genetic Algorithm
S.Sivakumar
1, D.Devaraj
21
EEE Department, Kings College of Engineering,
Punalkulam, Thanjavur, India.
2
Professor, EEE Department, Kalasalingam University,
Krishnankoil, Virudhunagar (Dt.), India
---
Abstract:
Congestion management is one of the key issues in Deregulated power system as the customers would like to purchase the electricity from the cheapest available sources. The Independent Power Producers (IPP) would like to derive more benefit out of their investments, engages with contracts that leads to overloading of the transmission elements of the power system. An Independent System Operator (ISO) coordinates the trades and make sure that the interconnected power system operates in a secure state at a minimum cost by meeting the all the load requirements and losses. In this work Congestion is mitigated by Generator Rescheduling and implementation of FACTS devices. Minimization of rescheduling costs of the generator and minimization of the cost of deploying FACTS devices are taken as the objectives of the given multi-objective optimization problem. Multi Objective Genetic Algorithm is used to solve this problem by implementing the series FACTS device namely TCSC. The proposed algorithm is tested on IEEE 30 bus system.Keywords: Congestion management, Generator rescheduling, MOGA, Multi objective optimization, Pareto optimality.
1.
I
NTRODUCTIONThe electric utilities around the world have undergone changes in the way they are operated during the last three decades. As happened to many other industries, participation of the private entities in power sector are intended to bring - huge in flow of funding, newer technologies, enriched customer support services etc.. Unbundling of the vertically integrated power system also brings few challenges. The intensive usage of the transmission resources are the real bottlenecks of the deregulated power system. Most of the time power system is operated near to its rated capacity as both buyers and sellers in the market are trying to gain economically by full utilization of the existing resources. Congestion in transmission lines is bound to happen due to the lack of coordination between the generation and transmission utilities. Congestion is also created in the eventuality of generation outages, sudden and huge variation in load demands, and failure of branches or equipment. In a vertically integrated system, congestion is treated in terms of steady state security and the basic objective was to
control the generators’ output so that system remains secured at the lowest cost as seen by the mutually agreeing electric utilities. Whereas in a deregulated environment, congestion has become a term, in conjunction with power system security and competition. The Independent System Operator (ISO) is responsible for mitigating the congestion in the deregulated power industry without compromising the system security and with minimum cost.
Many approaches have been reported in the literature for congestion management. Optimal Power Flow (OPF) is arguably the most significant technique for congestion management with existing transmission and operational constraints [1]. Market model based congestion management methods are proposed in [2]. Detailed analysis of different congestion management techniques used in different electricity markets and a general congestion relieving algorithm is reported in [3]. Generator sensitivity factor based optimum generation rescheduling and/or load shedding schemes to relieve congestion of transmission lines are reported in [4]. A method of overload alleviation by real power generation rescheduling based on the concept of Relative Electrical Distance (RED) has been presented in [5]. Multi objective optimization algorithms using various evolutionary methods are discussed in [6, 7]. A congestion clusters based method has been proposed that groups the system users having similar effects on the transmission constraints of interest [8]. The locational marginal prices based approach for eliminating congestion has been proposed in [9]. There are two ways of mitigating the congestion and they are, i) cost free and ii) non-cost free. Literature works are found to be employing any one of these two types. As FACTS devices are playing a major role in eliminating congestion, in this work along with the application of FACTS devices, generation rescheduling is also being done to mitigate congestion. Both the cost free and non-cost free techniques are employed here.
© 2015, IRJET.NET- All Rights Reserved
Page 1378
branches. The suitable location for the FACTS devices has been determined by an index called Line Overload Sensitivity Index (LOSI) [10]. MOGA is used to alleviate congestion by minimizing the cost of generation rescheduling and the cost of implementing the FACTS devices. A strength Pareto evolutionary algorithm has been used for the optimal choice and allocation of FACTS controllers to relieve congestion in [11].
In multiple objective problems, the objectives are generally conflicting, preventing simultaneous optimization of all objectives. Optimizing one objective often results in unacceptable results with respect to the other objectives. Therefore, a perfect multi-objective solution that simultaneously optimizes each objective function is almost impossible. Two general approaches are employed to solve the multi objective problem, one is to combine the individual objective functions into a single composite function by utility theory, weighted sum method etc.., but the problem lies in the correct selection of the weights or utility functions to characterize the decision maker’s preferences. Small perturbations in the weights can lead to a very different solution. The second approach is to determine all of the trade-off solutions (Pareto Optimal set) available. A reasonable solution to a multi objective problem is to investigate a set of solutions, each of which satisfies the objectives at an acceptable level without being dominated by any other solution.
The work is carried out on IEEE 30 bus system. This paper is organized as follows: Section 2 briefly presents the Generation sensitivity factor, Section 3 details the FACTS device Section 4 describes about the congestion management problem formulation, Section 5 details the Multi- Objective Genetic Algorithm, Section 6 presents the proposed methodology for MOGA implementation, Section 7 details the simulation results and Section 7 describes about the conclusion.
2. SENSITIVITY ANALYSIS
2.1. Line Overload Severity Index
The severity of the system loading under normal and contingency cases can be described by the Line Overload Severity Index (LOSI). The LOSIl for a branch “l” is
calculated as the sum of the normalized power flow through branch “l” to all the considered contingencies ‘C’, expressed as:
LOSIl =
n N
C l
C l
c
S
S
21 max
(1)
Where
S
lC= MVA flow in line during contingency ‘C’ The LOSI is calculated to identify the location of the FACTS devices.2.2. Generation Sensitivity Factor
While rescheduling the generators for mitigating congestion, the impact on congested line power flow by all
generators is not uniform and some of the generators will have feeble effect on relieving the congestion of a particular line, whereas some generators may affect the congestion to a greater extend. A generator sensitivity factor is calculated to identify the generators which influence more on the congested line. The generators in the system under consideration have different sensitivities to the power flow on the congested line [12]. Generator sensitivity for line k
can be written as
Gg = (2)
Where, ∆Pij is the change in real power flow on the
congested line k connected between i and j and ∆PGg is the
change in real power generated by generator g.
3.
FACTS
DEVICES
FOR
CONGESTION
MANAGEMENT
FACTS devices based on power electronics technology are used to control the active power, reactive power flow on transmission systems based on the key control variables such as line impedance, phase angle and voltage. Series FACTS devices are used to improve the loadability of the branches, to reduce congestion and thereby better utilization of the existing grid infrastructure by minimizing the gap between the stability and thermal levels. The issues associated with the usage of FACTS devices are appropriate sizing, optimal location, setting, cost and modelling of the devices. For static application like congestion management FACTS can be modelled as Power Injection Model.
Static VAR Compensator (SVC) is an important first generation FACTS device, which is already widely in use. It is a shunt reactive compensation controller consisting of combination of fixed capacitor or Thyristor switched capacitor in conjunction with Thyristor-controlled reactor (FC-TCR). SVC has been in use for the past three decades. Thyristor Controlled Series Compensator (TCSC) is a second generation FACTS controller, which modifies the line reactance by connecting a variable reactance in series with the line. Variation in reactance is obtained by using fixed capacitor – thyristor controlled reactor combination with mechanically switched capacitor sections in series.
During steady state operation TCSC can be considered as an additional reactance -jxc. Fig. 1 shows the model of a
branch with one TCSC, which is connected between bus-i
and bus-j.
© 2015, IRJET.NET- All Rights Reserved
Page 1379
In order to identify the optimal placement of TCSC under varying system loading LOSI index defined in (3) is calculated at an increased load of 10% from the base values and at a decreased load of 10% from the base values as LOSIIL and LOSIDL. The Base case LOSI is also calculated as
LOSIBL. The location of the TCSC to be placed is decided by
taking the average of the three LOSI.
LOSIl =
rank and proceeding downward with as many branches as the number of available TCSC.4. PROBLEM FORMULATION
The objectives of congestion management are to minimize the cost due to rescheduling of generators and the cost of utilizing TCSC devices. The fuel cost will be at minimum for a certain generator output combination – depending on the cost coefficients of the fuel cost equation and the generators’ output to meet all the loads and losses. The congestion cost depends on the amount of generation change and the fixed and variable cost of the FACTS devices. Sensitivity factors are calculated for the selection of the generators which have more impact on the congested line. Generators having higher GSF are considered for the the generators contribution to reduce the congestion is considerably less due to their network location. Hence only the sensitive generators will be allowed to vary their production. The desirable point of operation is arrived from the OPF solution. Any overload in the transmission will be handled by rescheduling only the selected generators output. In this work, one of the objectives is to reduce such rescheduling cost. The rescheduling cost is determined by:
Min
participating generators that are willing to adjust the output, Cg is the incremental and decremental price bids
submitted by the generator and ∆Pg is the real power
adjustment done by the generator ‘g’. The generators output should not make any violation of i) the line flow constraints ii) real and reactive power limits of the generators and iii) desired voltage limits at the buses.
4.2. FACTS cost
candidate FACTS device i, respectively. di =1 if the location ‘i’ is selected for FACTS device expansion or else di = 0. Ω is a set of all candidate sites and cIt, is the size of the
additional VAR of the device i. The additional VAR of the selected FACTS devices is restricted to a maximum limit cItmax for physical considerations. The constraints for cItcan be expressed as of generators, ∆PG is the change in generation for relieving,
Qg is the reactive power produced by the generators and
their values are 0.95 and 1.05 p.u. respectively.
5. MULTI OBJECTIVE GENETIC ALGORITHM
5.1. Multi Objective Optimization Problem
© 2015, IRJET.NET- All Rights Reserved
Page 1380
optimality is computationally infeasible. Therefore, a practical approach to multi-objective optimization is to investigate a set of solutions (the best known Pareto set) that represent the Pareto optimal set as much as possible. A multi-objective optimization approach should achieve the following three conflicting goals:
1. The best-known Pareto front should be as close possible as to the true Pareto front and it should be a subset of the Pareto optimal set.
2. Solutions in the best-known Pareto set should be uniformly distributed and diverse over the Pareto front 3. In addition, the best-known Pareto front should capture the whole spectrum of the Pareto front.
This paper presents common approaches to attain these three conflicting goals while solving a multi-objective optimization problem.
5.2. Genetic Algorithm
Genetic algorithms (GA) are a population based search algorithms based on the mechanics of natural evolution. GA maintains a population of individuals that represent the candidate solutions to the given problem. To measure the fitness of the individual population, it is evaluated from the objective function. GA combines solution evaluation with stochastic genetic operators namely, selection, crossover and mutation to obtain near optimal solutions. Being a population based approach; GA is well suited to solve multi-objective optimization problems. MOGA differs from the standard GA in the way fitness is assigned to each solution in the population. The rest of the algorithm is the same as that of a classical GA. In MOGA, first each solution is checked for its domination in the population. For this, two solutions are compared on the basis of whether one dominates the other solution or not. The concept of domination is explained below. Assume that, there are M objective functions. In order to cover minimization or maximization of objective functions, the operator < between the solutions i and j is used to denote that the of solutions ηithat dominate solution ‘i’ is assigned:
ri= 1+ηi (13)
In this way, non-dominated solutions are assigned a rank equal to 1, since no solution would dominate a non-dominated solution in the population. Once the ranking is done, a raw fitness is assigned to each solution based on its rank. To perform this, first the ranks are sorted in ascending order of magnitude. Then, a raw fitness is assigned to each solution by using a mapping function. Thereafter, solutions of each rank are considered at a time
and their raw fitnesses are averaged. This average fitness is called the assigned fitness to each solution of the rank. This process emphasizes non-dominated solutions in the population. In order to maintain diversity among non-dominated solutions, niching among solutions of each rank is introduced. The niche count is calculated using the objective function value as a distance metric according to
maximum distance between any two solutions before they can be considered to be in the same niche and dijis the normalized distance between any two solutions i and j in a rank. The normalized distance dijis calculated using
function takes a value in [0, 1], depending on the values of dij and σshare. The shared fitness value is calculated by
dividing the assigned fitness of a solution by its niche count. Although all solutions of any particular rank have the identical fitness, the shared fitness value of a solution residing in a less crowded region has a better shared fitness. This produces a large selection pressure for poorly represented solutions in any rank. Dividing the assigned fitness value by the niche count reduces the fitness of each solution. In order to keep the average fitness of the
© 2015, IRJET.NET- All Rights Reserved
Page 1381
' j
f
=j j
nc
f
µ(r) = Number of solutions in rank ri.
This procedure is continued until all ranks are processed. Thereafter, selection, crossover and mutation operators are applied to create a new population. With each individual represented as a string of integers and floating point numbers, the selection process remains the same as the classical GA, but the cross over and mutation operators are applied variable by variable. Here, tournament selection and uniform mutation are used for genetic operation. In this work, MOGA is used to solve for the two objective functions namely minimization of rescheduling cost and the FACTS installation cost for IEEE 30 bus system.
6. GA IMPLEMENTATION
The following steps are to be addressed while implementing the GA to solve congestion management problem:
• Solution representation • Fitness evaluation and • Genetic operators
6.1. Solution representation
The parameter encoding is the first step in the implementation of GA for any problem. Each member of the genetic population represents a probable solution. The elements of this member consist of all the decision variables in the system. The decision variables in the congestion management problem are i) the generator’s active power output Pgi ii) the reactance value of the TCSC
to be deployed. The solution variables are the floating point numbers with floating point representation. In this approach the efficiency of the GA is increased as there is no need for conversion to binary numbers and the memory required to store the population is also reduced.
6.2. Evaluation function
GA searches for the optimal solution by maximizing the given fitness function and therefore evaluation function which provides a measure of the quality if the problem solution must be provided. In this congestion management problem the two objectives considered are minimizing the fuel cost and minimizing the congestion cost. The active power generation Pgi (except the generator at slack bus),
generator terminal bus voltages Vgi, reactive powers of the
generators are self restricted by the optimization algorithm. The limits on all these parameters are satisfied by adding a penalty function with the objective function. Any violation on the slack bus generator active power limit, reactive power generation limit violation, line flow limit violation and load bus voltage limits, will attract penalty values. They will be calculated as the square of the difference between
parameters and their bounding values multiplied by the penalty factors. The penalty values are added to each of the objective function to get new objective functions.
6.3. Genetic operators
The MOGA uses all the genetic operators of classical GA. The main difference between a conventional GAs and a MOGA is the assignment of fitness. After the fitness has been assigned to the individuals, selection can be performed and the other genetic operations will follow.
1). Selection: The strategy behind the selection of parents plays an important role in the GA. The fitter individuals are to be selected more often to reproduce. There are number of selection methods proposed in the literature. Roulette wheel selection (fitness proportionate selection), ranking and tournament selection are to name a few. In this work roulette wheel selection is employed
2) Crossover: Crossover is an important operator of the GA. It is a structured, yet stochastic process of exchanging information between the parent strings. The probability of crossover happening between the strings is kept high, typically between 0.6 and 0.95 as it improves the exploration over new regions of the search space. In this work the decision variables are real numbers and so Blend crossover (BLX-α) [10] is applied.
3) Mutation: Mutation operator is used to inject new genetic material into the population. Mutation introduces a sort of artificial diversification in the population to avoid premature convergence to local optima. It increases the probability of searching new region by the population. In this work uniform mutation is applied.
7. SIMULATION RESULTS AND DISCUSSION
The proposed multi-objective genetic algorithm approach has been applied to solve the congestion management problem in IEEE 30 bus test system. The data pertaining to the generator, transmission line and generator cost coefficients are taken from [14]. MATPOWER package has been used to solve power flow problems [15]. The LOSI has been calculated and identified, three locations for possible FACTS deployment. The three identified branches are 2-5, 9-10, and 28-27. The most severe line in IEEE 30 – bus system, 1-2 is made to out to create congestion in the system. MOGA has been developed using MATLAB 7.9 and has been run on Core i3 Pentium processor having 2.20 GHz clock. The optimal GA parameters are:
© 2015, IRJET.NET- All Rights Reserved
Page 1382
MOGA has been coded to in such a way that, the solution parameters are multiplied by a penalty coefficient for any violation in the voltage limits, real and reactive power limits of the generators and the line loading. The use of penalty function ensures that, the solution doesn’t violate any of the above limits. Three cases have been considered in this work, as follows:
A. Case (i): Congestion relieved by rescheduling all generators and employing FACTS devices
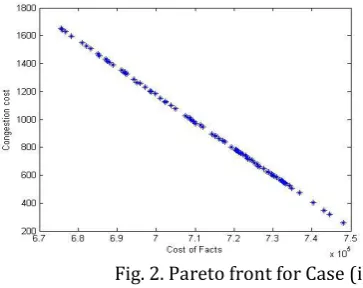
Three TCSC devices have been added to the branches having highest LOSI. All the six generators have been rescheduled to eliminate the congestion. The reactance value of the TCSCs and the rescheduled power output of the generator are the control variables to minimize the cost of rescheduling and to minimize the FACTS cost. For calculating the FACTS cost, µv is taken as 10 and µfis taken as 2. The details of the rescheduled values of the generators and the reactances of the TCSCs are listed in Table 1. The Pareto front of the solution space is in Fig.2.
B. Case (ii). Congestion relieved by rescheduling sensitive generators and FACTS devices.
The generator sensitivity factor has been calculated to identify the sensitive generators which affect the congested line. The generators at bus numbers 5, 11, and 13 are selected for rescheduling to eliminate the congestion. Three numbers of TCSC are connected at branches 2-5, 9-10, and 28-27. The details of the rescheduled values of the generators and the reactances of the TCSCs are listed in Table 2.
Fig. 2. Pareto front for Case (i)
The Pareto front for the solution space is in Fig.3.
TABLE 1
Generator rescheduling and TCSC details Case (i)
S. No
Extreme Points
Pg1 Pg2 Pg5 Pg8 Pg11 Pg13 XC5 XC14 XC36 Congestion
cost
TCSC cost
1 Left 173.897 74.075 49.1219 21.5207 11.5831 14.7712 -0.027 0.0161 -0.059 1926.9 5678. 5 2 Right 176.017 50.297 20.8526 23.3241 13.6725 12.1143 -0.007 -0.008 -0.098 187.7020 6530.
6
TABLE 2
Sensitive Generators’ rescheduled output and TCSC values – Case (ii)
S.No Extreme Points
Pg5 Pg11 Pg13 XC5 XC14 XC36 Congestion
cost
TCSC cost
1 Left 21.5077 23.6177 39.6920 -0.0596 -0.0320 0.0086 1647.1 6.7576e+5
2 Right 21.4698 16.9188 12.8537 -0.0381 -0.0221 0.0361 260.0978 7.4799e+5
© 2015, IRJET.NET- All Rights Reserved
Page 1383
Fig. 3. Pareto front for Case (ii)
C. Case (iii). Congestion relieved by all generators, load shedding and FACTS devices
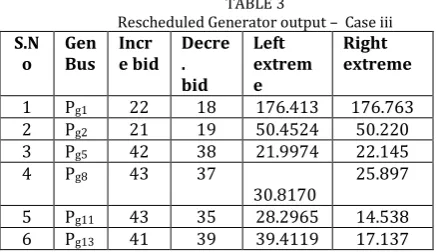
In deregulated power system there are loads which are willing to contribute for the congestion elimination against certain economic considerations. They offer their decrement bid for load shedding quantities. In such cases the congestion elimination can be done by rescheduling, load shedding and also by employing FACTS devices. The details of the rescheduled values of the generators are listed in Table 3, the revised load bus power is presented in Table 4 and the reactances of the TCSCs are listed in Table 5. The cost details of this case are presented in Table 6.
TABLE 3
Rescheduled Generator output – Case iii
S.N o
Gen Bus
Incr e bid
Decre . bid
Left extrem e
Right extreme
1 Pg1 22 18 176.413 176.763
2 Pg2 21 19 50.4524 50.220
3 Pg5 42 38 21.9974 22.145
4 Pg8 43 37
30.8170
25.897 5 Pg11 43 35 28.2965 14.538
6 Pg13 41 39 39.4119 17.137
It is found that, the use of FACTS devices reduces the congestion cost by many folds. At possible cases load curtailment can also be used to eliminate the congestion. The Figures show the Pareto front which gives all the non-dominated solutions. The Left extreme point gives the minimum FACTS cost and the maximum cost of rescheduling.
TABLE 4
Curtailed load values – Case (iii)
S.No Load Locatio n
Decre. bid
Left extreme
Right extrem e
1 Pd3 45 2.5902 2.5608
2 Pd4 47 7.5938 7.6102
3 Pd5 49 94.5292 94.3865
4 Pd7 48 22.8163 22.8369
5 Pd8 49 30.1833 29.9822
6 Pd12 51 11.4739 11.4599
7 Pd15 45 8.6338 8.6514
8 Pd16 40 3.5458 3.5458
9 Pd19 51 9.4376 9.4376
10 Pd23 39 3.3224 3.3224
11 Pd24 48 9.1742 9.1742
12 Pd30 46 11.0702 11.0702
The rescheduling cost is expressed in $ and the FACTS costs are expressed in $/MVAR. The right extreme point gives the maximum FACTS cost and the minimum rescheduling costs. In this work the investment cost of the FACTS devices are included and if FACTS devices are already present then the cost will be decreased further.
TABLE 5 TCSC values for Case (iii)
S.No TCSC Location
Left extreme
Right extreme
1 XC5 -0.1100 -0.1016
2 XC14 -0.0527 -0.0372
3 XC36 -0.1059 -0.1574
TABLE 6 Cost details for Case (iii)
S.No Types of costs
Left Extreme
Right extreme
1 FACTS cost 6.6846e+5 7.5661e+5 2 Congestion
cost
2.2477e+3 540.3218
8. CONCLUSION
© 2015, IRJET.NET- All Rights Reserved
Page 1384
REFERENCES
[1] Richard D Christie, “Transmission Management in the Deregulated Environment,” Proceedings of the IEEE, Vol.88, No.2, February 2000.
[2] R.S.Fang and A.K.David, “Optimal dispatch under transmission contracts,” IEEE Trans. Power Systems. Vol.14, no.2, pp. 732-737, May 1999.
[3] E.Bompard , P. Correia, G. Gross, and M. Amelin, “Congestion management schemes: A comparative analysis under a unified framework,” IEEE Transactions on Power Systems, vol.18. Issue 1, pp.346-352, 2003.
[4] B.K.Talukdar, A.K. Sinha, S.Mukhopadhyay, and A.Bose. “A computationally simple method for cost efficient generation rescheduling and load shedding for congestion management,” Int. J. Elect. Power Energy Systems, vol.27, no 5-6, pp379-388, June/July 2005. [5] G. Yesuratnam and D. Thukaram, “Congestion
management in open access based on relative electrical distances using voltage stability criteria,” Electric Power Systems Research, vol.77, pp. 1608-1618, 2007
[6] J.Hazra and A.K.Sinha, “Congestion management using multi objective particle swarm optimization,” IEEE Transaction on Power Systems, vol. 22, no. 4, pp. 1726 - 1734, 2007.
[7] M.M.Raghuwanshi and O.G.Wakde, “Survey on multi-objective evolutionary and real coded genetic algorithms,” Complex International, vol. 11, p.150, 2008 [8] A.Kumar, S.C.Srivatsava and S.N.Singh, “A zonal
congestion management approach using ac transmission
congestion distribution factors,” Electric Power System Research, vol.72, pp.85-93, 2004.
[9] M.Joorabian, M.Saniei, and H.Sepahvand, “Locating and parameters setting of TCSC for congestion management in deregulated electricity market”, 6th IEEE conference
on Industrial Electronics and applications”, pp 2185-2190, 2011
[10] R.Narmatha Banu and D.Devaraj, “Multi-Objective GA with Fuzzy decision making for security enhancement in power system.” Applied soft computing, pp 2756 – 2764, 2012.
[11] S.Surender reddy, M.Sialaja Kumari and M.Sydulu, “Congestion management in deregulated power system by optimal choice and allocation of FACTS controllers using multi objective genetic algorithm’, Journal of Electrical Engineering & Technology, vol.4., pp 467-475, 2009
[12] S.Dutta and S.P.Singh, “Optimal rescheduling of generators for congestion management based on PSO,” IEEE Transactions on Power Systems, vol. 23, no 4, pp 1560- 1569, 2008.
[13] El-Said El-sayed El-Araby, Naoto Yorino, Hiroshi Sasaki, “A two level hybrid GA/SLP for FACTS allocation problem considering voltage stability”, Electrical Power & Energy Systems, pp 327-335, 2003.
[14] O.Alsac, B.Scott, “Optimal load flow with steady state security,” IEEE Transactions on power systems PAS- 93(3) (1974) 745-751.
[15] R. D. Zimmerman, C. E. Murillo-Sanchez, and R. J. Thomas, “Matpower: Steady- State Operations, Planning and Analysis Tools for Power Systems Research and Education," Power Systems, IEEE Transactions on, vol. 26, no. 1, pp. 12, 19, Feb. 2011.