Copyright 0 1983 by the Genetics Society of America
POPULATION STRUCTURE AND Q U A N T I T A T I V E
CHARACTERS
ALAN R. ROGERS’ AND HENRY C. HARPENDING
Department of Anthropology, University of New Mexico, Albuquerque, New Mexico 87131
Manuscript received March 3, 1983 Revised copy accepted July 8, 1983
ABSTRACT
A migration matrix model is used to investigate the behavior of neutral polygenic characters in subdivided populations. It is shown that gametic dise- quilibrium has a large effect on the variance among groups but none at all on its expectation. The variance of among-group variance is substantial and does not depend on the number of loci contributing to variance in the character. It is j u s t as large for polygenic characters as for single loci with the same additive variance. This implies that one polygenic character contains exactly as much information about population relationships as one single-locus marker. The theory is compared with observed differentiation of dermatoglyphic and anthropometric characters among Bougainville islanders.
N studies of population structure it is common practice to compare variation
I
of quantitative characters with that of genetic markers. Such comparisons are potentially interesting for several reasons. They may, for example, shed light on the factors maintaining variation in quantitative traits. HIERNAUX(1977) argued that, since the concordance between patterns of variation in stature and in (presumably) neutral gene frequencies is low in equatorial Africa, something other than drift must be affecting variation in stature. Several other authors have suggested using models of neutral differentiation to test the hypothesis that observed variation is due to drift (LANDE 19’76; CHAKRABORTY
and NEI 1982; K. MORGAN and M. HOLMES, unpublished data). In practice, the value of this method has been limited by our meager understanding of the dynamics of quantitative variation. There has been no basis for deciding when departures from the predictions of a neutral model are large enough to war- rant its rejection. We need to know not only the variance expected under a neutral model but also the standard error of this expectation.
Other studies have tried to infer patterns of mate exchange and local pop- ulation history from patterns of variation in metric characters. FROEHLICH and
GILES (1981) argue that, since quantitative characters are affected by many loci, they are somehow buffered against random forces such as drift and should give a better picture of pcjpulation history than can be obtained from a handful of genetic markers (see also BIRDSELL 1950; RELETHFORD and LEES 1982).
’
Present address: Department of Anthropology, SUNY-Albany, Albany, New York 12222.986 A. R. ROGERS AND H . C. HARPENDING
This implies that drift and migration have more predictable effects on the variation of polygenic characters than on that of single loci. The truth of this assertion is not at all obvious. As before, the unresolved issue is the standard error of the variance predicted under a neutral model.
In this paper we wish to investigate both the expectation and standard error of variance of group means about the population mean. Our model assumes additive gene effects and two alleles per locus. We will apply results from the migration matrix model of a structured population to study the effects of migration and drift on neutral characters. We show that gametic disequili- brium, which has been neglected in earlier theory, has a substantial effect on the variance among groups, but that WRIGHT’S (1 95 1 ) formula continues to hold in expectation. We derive a formula for the variance of the variance, show that it does not depend on the number of loci contributing to genetic variance and compare the mathematical theory to data on anthropometric characters and dermatoglyphics in Bougainville Island populations.
GAMETIC DISEQUILIBRIUM AND QUANTITATIVE CHARACTERS
We are primarily interested in the dynamics of local variation over relatively short periods of time. Recent investigations have shown that gametic disequi- librium has a large effect on the short-run behavior of variation within groups
(BULMER 1980), and we wish to investigate its effect on variation among groups. To simplify the analysis, we use a model of additive effects and two alleles per locus. Complications arising from multiple alleles are ignored in order to deal with those arising from gametic disequilibrium.
Let a] denote the average effect of a gene substitution (FISHER 1958) at locus j . We refer to the allele whose average effect is largest as the “plus” allele and denote its frequency in the ith group by
p ,
(= 1-
qI,).
T h e differ- ence between the mean group ofi
and the population mean isk
Y? =
E
2 4 %
-
P I )]=I
where
k
is the number of loci, andPI
is frequency of the “plus” allele in the population as a whole.This can be written economically in matrix notation. Let
y T = (4’1 4‘2 4’3
.
. .
y g )(1)
ar = (a1 a2 a3
. .
ak), U] = 2a,(p,q,)’/2POPULATION STRUCTURE 987
frequencies from population mean gene frequencies. This yields a familiar formula (FALCONER 1981,
p.
116).aTa =
2
I]
2aj2pJqJ = 20:.U : is the additive genetic variance expected under panmixia with the same gene frequencies.
Using these definitions, the equation for deviations of group means from the population mean can be rewritten as y = Za. T h e variance of the y,,
weighted by relative group sizes, is j
U,’ = yTwy
= aT[ZTwz]a (3)
=
aTSaW is a diagonal matrix whose j t h diagonal entry is wj = nj/N, the relative size of the j t h group. S is a k by k matrix whose 9 t h entry is the normalized covariance of the ith and j t h loci.
T h e diagonal entries of S are
which is simply WRIGHT’S (1951) Fst for the j t h locus. Var(p,) denotes the sample variance of
p ,
about the population mean. F,, is sometimes defined differently, in terms of variance about a theoretical expectation, and this am- biguity has led to a good deal of confusion. We will use a different symbol,Ro, when the former definition is intended. T h e estimate of Ro generally used is an average of the diagonal entries of S . T h e off-diagonal terms in S measure the between-groups component of gametic disequilibrium (NEI and LI 1973). If we assume gametic equilibrium and also that the diagonal elements of S are all equal, then S = RoI (where I is the identity matrix) and (3) reduces to
U,’ = 2o:Ro (4)
This equation was first derived by WRIGHT (1943, 1951), and equivalent for- mulas have been obtained for different models by LANDE (1976, 1979) and
CHAKRABORTY and NEI (1982). But there is little reason to assume that finite subdivided populations will be in gametic equilibrium. Disequilibrium is gen- erated by a variety of forces including drift and migration, and its effect on variance within groups can be quike large (BULMER 1980). However, it can be shown that
(4)
holds in expectation in spite of gametic disequilibrium (see APPENDIX). Gametic disequilibrium has no effect on the expectation of variance among groups. Its effect is to produce variation about this expectation.988 A. R. ROGERS AND H. C. HARPENDING
eigenvectors of S scaled so that the norm of the ith vector is equal to the square root of its eigenvalue,
+!.
Then a; = aTXXTa and aTX = (a'x, aTxz aTx3. . .
a'xk). Let 81 represent the angle subtended by the vectors a and xl.T h e cosine of 8, is defined by
With these definitions the variance of group means can be written as
k
c,' =
2ag
1
+iCOS%i i= 1In the sections to follow ( 5 ) is used to investigate the variance of c,'.
( 5 )
SOME RESULTS FROM SINGLE-LOCUS THEORY
Equation ( 5 ) expresses among-group variance in terms of the eigenvalues and eigenvectors of the matrix
s
= [W'/'Z]'[W'/'Z] (6)+i =
Mi
(7)
T h e nonzero eigenvalues of S, + i , are equal to
where
PI
is an eigenvalue of the related matrixHere, z., represents the ith column of Z. T h e matrix
R,
has been studied by HARPENDING and WARD (1982) and A. R. ROGERS (unpublished results). It is an average of k terms, each associated with a single locus, and each of these terms has the same expectation. Hence, the expectation of the average is the same as that of a single term. This section will summarize some properties ofR,,
derived from single-locus models. We will then use these properties to investigate the dual matrix S.Our analysis is based on a migration matrix model of population structure (BODMER and CAVALLI-SFORZA 1968; SMITH 1969). We assume that drift oc- curs at reproduction and is followed by migration. Migration patterns are characterized by a discrete transition matrix, M. The zjth entry of M is the proportion of individuals in group
j
(after migration) who originated in groupPOPULATION STRUCTURE 989
among groups is sufficient to keep group gene frequencies fairly similar. This assumption is reasonable since we are modeling small scale phenomena but would be inappropriate to an investigation of variation among races.
In addition to migration among groups, a fraction s of the residents of each group are immigrants from a “continent” with unchanging gene frequency T . This linear systematic pressure prevents fixation and could also model mutation or weak selection. Without it, the process would have no equilibria short of fixation. Our treatment of migration is deterministic, an approximation that is likely to be useful only if the covariances among groups converge rapidly (in expectation). Although the distribution of gene frequencies converges only slowly (CROW and KIMURA 1970), covariances about the population mean con- verge rapidly; often within five o r ten generations for migration patterns char- acteristic of human populations (HARPENDING and WARD 1982; J. WOOD, un- published results, A. R. ROGERS, unpublished results).
These assumptions are appropriate to our interest in the dynamics of vari- ation among small groups over relatively short periods of time. Gene frequen- cies in small groups change rapidly relative to those of the larger surrounding population. Hence, it is reasonable to take the gene frequencies in the larger surrounding population as constant when studying short-run behavior in small groups. This is the motivation for o u r “continent” with unchanging gene fre- quencies.
Our assumptions guarantee that M can be diagonalized, and we can write its diagonal form as
M = UAVT, U-’ = VT
U and V T contain (respectively) the right and left eigenvectors of M. They are orthogonal matrices only if group sizes are equal. A is diagonal; its diagonal entries are the eigenvalues of M.
With these assumptions it can be shown that R, converges in expectation to an equilibrium of the form
E(R,) = [W’/2V]B[W’/2V]T (9)
Here B is diagonal, and our assumptions imply that W’’2V is an orthogonal matrix. Hence, (9) is the spectral decomposition of E(R,) at equilibrium.
T h e equilibrium value of B depends on when in the life cycle gene frequen- cies are measured. T h e sum of the eigenvalues is equal to E(&) and measures the differentiation of groups. Since drift occurs at reproduction and tends to increase differentiation, E(Ro) of newborns is greater than that of their parents. Mobility among groups tends to reduce differentiation, so E&} is lower for the same cohort after migration than before. At equilibrium these effects are in balance so that, for a given age class, E(Ro) is unchanged from generation to generation. But it still varies within generations.
A. R. ROGERS (unpublished results) derives expressions for B both before and after migration, which we denote by B(‘) and B‘“). (The superscripts refer to “children” and “adults”). At equilibrium, the diagonal entries of B(‘) and B‘“)
990 A. R. ROGERS AND H. C. HARPENDING
where A, is an eigenvalue of (1
-
s)M, andi
indexes the As in descending order. T h e largest eigenvalue of (1-
s)M is X1 = (1 - s), and the corresponding entries of B(') and B(") are zero.T h e trace of Rzt, is equal to Ro which, as discussed, is equivalent to one of
the two definitions of WRIGHT'S Fst. Since much of the theoretical literature on population structure is concerned with (the other) F,,
(6
MARUYAMA 1977), we will touch briefly on the distinction between these statistics. Both measure loss of heterozygosity relative to some randomly mating reference population. With Ro the gene frequency of the reference population is that of the current generation, whereas, with the other F,,, the reference population has fixed gene frequency equal to E(p ) .
Ro is, in effect, scaled by the overall heterozy- gosity of the current generation. It is sensitive only to the effects of subdivision and does not track the loss of heterozygosity due to finite population size. Roconverges quickly and is useful in studying the short-run behavior of variance about the population mean. T h e other F,, would be important in modeling the long-run effects of drift and mutation on overall heterozygosity.
THE MEAN AND VARIANCE OF THE VARIANCE
In the APPENDIX it is shown that, if the number of loci K is large, the difference between R,,, and its expectation will be small. This result follows from the fact that the correlations between the effects of different loci are zero in expectation. It implies neither gametic equilibrium nor stochastic in- dependence of the loci. We now assume that the number of loci is large, so R,,, will be close to its expectation and will change little from generation to generation. Gene frequencies, on the other hand, continue to change since drift still occurs each generation and systematic pressure prevents fixation. This guarantees that the dual matrix, S, will not converge to an equilibrium.
S
and RzL, are both functions of Z, and the relationship between these mat- rices is neatly expressed by the singular value decomposition (FORSYTHE, MAL- COLM and MOLER 1977). Because of (9) the singular value decomposition ofW1/2Z is W1/2Z = [W1/2V][B1/2k1/2 ][Q']. T h e matrices in brackets contain the right singular vectors, the singular values and the left singular vectors, respec- tively. Q' is g
-
1 by K and contains the right eigenvectors of S associated with nonzero eigenvalues. Z can be written as(1 1)
Z = VBl/ZQTk1/2
POPULATION STRUCTURE 991
eigenvectors of a symmetric matrix, S , they must remain orthogonal. T h e only changes that can occur are rigid rotations and reflections of the axes (TAT-
SUOKA 1971). T h e eigenvalues of S are proportional to those of R, and, thus,
are constant at equilibrium. Thus, the effect of drift on S is to produce random rigid rotations (and reflections) of its eigenvectors each generation. This is like a random walk on the surface of a k-dimensional sphere, and, regardless of initial conditions, all orientations of the eigenvectors will eventually become equally probable.
In the APPENDIX this indeterminacy of the orientation of the eigenvectors of S is used to derive formulas for the expectation and variance of the variance among groups in a metric character. When the number of loci, K , is large the variance of the variance is
This formula was obtained by taking a limit as the number of loci
k
goes to infinity. We now wish to argue, however, that it holds regardless of the number of loci contributing to variance in the quantitative character. Our analysis has proceeded from equation (3), which expresses variance among groups as a quadratic form involving a(k
by 1) vector a and a(k
byk)
matrix S . We have assumed thatk
is very large but have made no assumptions concerning the elements of a. Our results should hold for any choice of a. T h e number of loci contributing to variance in the quantitative character is not (necessarily)k,
but rather the number of nonzero entries in a. If a contains only one nonzero entry, for example, we are dealing with a one-locus model. Thus, equations (1 2) applies to any neutral quantitative character with an additive genetic basis, regardless of the number of foci contributing to its variance.This claim sounds outrageous, and we will attempt to justify it by using a different argument to show that (12) holds for single loci. For a single locus,
(3) is equivalent to
(4)
and the variance of variance among groups (conditional on U ; ) isVar(u,2) = 4 a ; f ~ a r j R o ) .
ROGERS (1982, p. 36) shows that the variance of a single-locus estimate of Ro is approximately
g
1=2 Var(Ro}
=
2
1
Pl'.
Substituting this equation into the one above reproduces equation (1 2). Thus, the variance of the variance does not depend on the number of loci involved.
T h e standard error of (12) is
SE = 8'''U:l
P
1
I
P I
=(C
P Y ' .
(13)
992 A. R. ROGERS AND H . C. HARPENDING
Equation (13) can be rewritten as
Thus, the coefficient of variation of e-:, i.e., the ratio of the standard error to the expectation, is
I
P
I
C.V. =
-
Ro
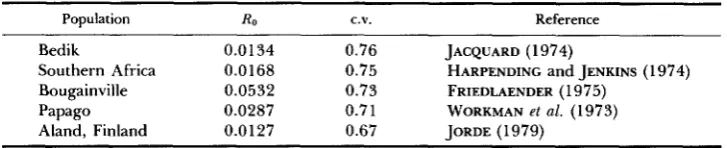
T h e coefficient of variation was evaluated for several human populations using biochemical data from the literature (see Table 1). It is remarkably (and un- expectedly) consistent. T h e standard error of e,' is approximately three-fourths its expectation in these populations.
DISCUSSION
T h e variance of variance among groups does not depend on the number of loci involved, and this result has important implications for efforts to use quantitative characters in assessing population relationships (RELETHFORD and
LEES 1982). It contradicts the claim (FROEHLICH and GILES 1981) that poly- genic characters provide a more accurate picture of demographic relationships among groups than do single-locus markers. This claim would be justified only if the variance of the variance among groups were smaller for polygenic char- acters than for single loci, and we have shown that this is not the case. The variance of the variance is the same for polygenic characters as for single loci, implying that one polygenic character contains exactly as much information about population relationships as one single-locus marker. If environmental effects are considered, quantitative characters are probably less informative about population relationships than single loci.
T h e large standard error of the variance among groups bodes ill for attempts to use neutral models in statistical inference. Since the standard error is nearly as large as the expectation, systematic forces can be detected only if their effects are large relative to that of drift. This does not mean that the neutral model is useless for detecting systematic forces but rather that its utility is restricted to the study of forces with large effect.
Equation (13) identifies the order of magnitude of the variation of e; about its expectation under the neutral model. By how much must cf deviate from its expectation before we can reject the hypothesis that group differentiation is the result of drift? This question cannot be answered with much precision since we know so little about the distribution of cp. Chebyshev's inequality
POPULATION STRUCTURE 993
TABLE 1
Coeflrient of variation of variance in group means
Population RO C.V. Reference
~ _____ _ _ _ _ _ _ _ _ _ _ _ _
Bedik 0.0134 0.76 JACQUARD (1 974)
Southern Africa 0.0168 0.75 HARPENDINC and JENKINS (1974) Bougainville 0.0532 0.73 FRIEDLAENDER (1975)
Papago 0.0287 0.7 1 WORKMAN et al. (1973)
Aland, Finland 0.0127 0.67 JORDE (1979)
significant. Deviations of three to four standard errors are suggestive, if not convincing, evidence that factors other than migration and drift are affecting group differentiation.
Using the results of the preceding section, we can estimate the mean and standard error of the variance among groups in a neutral quantitative char- acter. These estimates can then be used to test the hypothesis that observed variation is due to the effect of an additive polygenic character. This provides a means of assessing the role of drift in producing variation in subdivided populations.
T o predict a.: we must first estimate a; and Ro. a i is related to the additive variance within groups in the subdivided population by a: = (1
-
Ro)&(WRIGHT 1951), so equation (4) can be written as
a,' can be estimated using the standard procedures of quantitative genetics.
Ro can be estimated from biochemical data, but the marker loci that are used are unlikely to have any direct relationship to the quantitative character. However, it can be shown that, with the assumptions employed here, the expectation of RO is the same for all neutral polymorphic loci (A. R. ROGERS, unpublished results). (This doesn't hold for loci that are very near fixation, but such loci contribute little to variance and need not be used in estimating
Ro.) Since (4) holds only in expectation, we need to estimate the expectation of Ro , and any set of neutral loci will provide an estimate. Thus, given a set of neutral genetic markers, (1 5 ) expresses the expected variance among groups in terms of observable quantities.
But how does one find a set of neutral loci? It is impossible to demonstrate that a set of loci are neutral, and one can do no more than eliminate loci of obvious relevance to selection. Yet, there is little reason to think that selection is responsible for much of the local variation seen in small-scale studies, and it seems unlikely that this procedure will lead us far astray.
994 A. R. ROGERS AND H . C. HARPENDING
of additive genetic covariances, and C, the expectation of
cb,
then (15) can be written for multivariate characters asEquation ( 1 6) provides an prediction of the between-groups covariance ma- trix which must be compared with the observed matrix. A variety of proce- dures is available for comparing observed with expected matrices. Since the expectation of Ch is proportional to C,, LANDE (1979) suggests that the hy- pothesis of drift can be tested by evaluating the proportionality of
cb
and C,.But this test must be employed cautiously in light of the large standard error of CT:. Differentiation may easily be twice the expectation in some dimensions
and
almost
nil in others, severely distorting the configuration of cb. However,some relationship should remain between the configurations of Cb and Cn, and this procedure may prove useful if the standard error is taken into account.
A different procedure is employed here. It is possible to isolate a set of dimensions that are uncorrelated with respect to both
CO
and Cb and to com- pare observed with expected variance in each dimension. This procedure com- pares the dilation ofcb
with respect to C, along a set of uncorrelated axes and ignores the covariance structure of both matrices.In the multivariate case the vector y is replaced by a (g by t ) matrix Y, whose ijth entry is the value of character j in group
i.
For any (t by 1) vector, a, the product Y . a defines a quantitative character with expected among-group var- iance a'C,a and observed variance a'Cba. We wish to choose a set of vectors,a, which define uncorrelated variables, and use the ratios
to compare actual and predicted variance. If the eigenvectors of the product
C;'Cb are chosen as the a,, it can be shown (TATSUOKA 1971) that ( 1 ) the a;
are uncorrelated with respect to both
cb
and C,,(2)
the associated eigenvalues are the ratios of observed to expected variance, (3) the leading eigenvector maximizes this ratio and (4) the last eigenvector minimizes it. Thus, the eigen- vectors of CF'Cb provide a natural basis for multivariate comparison of ob- served and expected differentiation.What can be expected of the ratios of observed to expected variance under the neutral hypothesis? Since each is a ratio of an observation to its expectation, its expectation is 1 , and its standard error is the same as the coefficient of variation, given in (14). As Table 1 indicates this is often about 3/4. Most of these ratios should stay within the range from zero to three. Although their distribution is unknown, it must be asymmetric since the minimum is zero and the maximum may be many times the expectation. Most should be less than one.
DIFFERENTIATION OF METRIC CHARACTERS IN BOUGAINVILLE
POPULATION STRUCTURE 995
extremely endogamous. According to FRIEDLAENDER (1975) it is unusual for the birthplaces of mates to be more than five miles apart. T h e diversity of the Bougainville population is remarkable. On an island approximately 1 30 miles long by 40 miles wide there are no fewer than 19 languages, and the variation of gene frequencies and quantitative characters is comparable. FRIEDLENDER (1 975) has documented this diversity for dermatoglyphic, anthropometric and biochemical characters.
T h e biochemical sample includes about 2000 individuals-everyone more than 3 years old in the villages studied. T h e dermatoglyphic and anthropo- metric samples are about one-fourth as large and are more restricted in terms of the ages of individuals sampled. T h e anthropometric data refer only to adults and dermatoglyphics to individuals more than 10 years of age. These differences in the age structures of the samples affect the the amount of neutral differentiation to be expected of the various kinds of data. T h e expected variance among groups is proportional to Ro. This statistic may be considerably larger if children are sampled than if only adults are sampled. A. R. ROGERS (unpublished results) shows that, an equilibrium, Ro for children is related to the corresponding statistic for adults by
where n is the average group size and
g
is the number of groups. T h e differ- entiation of children can easily be twice that of adults. WORKMAN et al. (1973)found that, among the Papago, RO is approximately half again as large if individuals are assigned to village of origin rather than to village of residence. T h e differences in the samples from Bougainville should tend to make bio- chemical characters appears most differentiated and anthropometric characters least differentiated. It is interesting that, in FRIEDLAENDER’S data, this order is reversed.
Ro was estimated from FRIEDLAENDER’S published biochemical data. But it was not possible to estimate an additive genetic covariance matrix for Bou- gainville with published data. We will make do with the within-group pheno- typic covariance matrix. This amounts to assuming that the characters studied are completely heritable. It probably introduces little error for dermatoglyphic characters, since they are highly heritable, but it undoubtedly overestimates the variance d u e to drift in anthropometric characters. This will make pre- dicted variance among groups too large. Thus, variance in excess of the mod- el’s prediction may be significant, but no significance can be attached to char- acters that vary too little.
996 A. R. ROGERS AND H. C. HARPENDING
T h e eigenvalues of CT'Cb for ten dermatoglyphic variables are: 1.48 14, 1.0034, 0.5147, 0.4275, 0.3834, 0.2393, 0.2252, 0.1195, 0.0731 and 0.0288. T h e expectation of these ratios is 1, and the standard error is 0.73 as indicated in Table 1. All of them are within one standard error of their expectation under the neutral hypothesis, and their distribution is very asymmetric as expected. Patterns of dermatoglyphic differentiation in Bougainville are well within the range of effects that drift is expected to produce.
The same analysis was performed on the 13 anthropometric variables for which data are available in FRIEDLAENDER'S monograph, again using only the data on males. T h e within-group covariance matrix was nearly singular, con- taining four eigenvalues close to zero. Since ratios of very small numbers are notoriously unstable, these dimensions were excluded from the analysis. For the remaining nine dimensions the ratios of observed to expected variance are: 5.8367, 1.9369, 1.4350, 0.8490, 0.7463, 0.2292, 0.2222, 0.1746 and 0.0820. It is clear that anthropometric characters are more differentiated relative to the expectation of the neutral model than are dermatoglyphic characters. T h e leading eigenvalue is more than six standard errors greater than its expecta- tion. Moreover, these ratios are certainly underestimates. If the heritability of an eigenvector is 0.5, for example, the corresponding eigenvalue should be doubled. These results are even more impressive since children are included in the biochemical sample but not in the anthropometric sample. This differ- ence in sample age structure should tend to inflate our prediction of variance among groups. If we could estimate the effects of these factors, the ratios of observed to expected variance might be several times as large as those tabu- lated. These results are difficult to reconcile with the hypothesis that this differentiation is due to drift alone. It seems likely that some factor, such as geographically varying selection, environmental heterogeneity affecting growth and development or a nonadditive genetic basis for morphological characters, has contributed to variation of anthropometric characters on Bougainville.
CONCLUSIONS
We have attempted to describe the consequences for a set of quantitative characters of the gametic disequilibrium induced by population subdivision and restricted dispersal. For characters with an additive genetic basis at covariance equilibrium, the expected variance among group means is 2Roa; in agreement with WRIGHT'S formula for a single locus. A formula for the variance of this quantity was derived, and for patterns of subdivision characteristic of human populations the standard deviation is approximately three-fourths as large as the mean. The covariance matrix among trait means over groups is shown to have eigenvalues fixed by the population structure but vectors which are in- determinate, undergoing random rigid rotations every generation.
POPULATION STRUCTURE 997
much information about population relationships as one single-locus marker. Our result contradicts the claim (FROEHLICH and GILES 1981) that polygenic characters will reflect relationships among populations more accurately than will single loci. It also implies that departures from the neutral model will be difficult to detect statistically. T h e effects of factors other than drift must be large to be significant.
We examined among-groups dispersion from a series of groups on Bougain-
ville island. Biochemical markers and dermatoglyphics showed excellent agree-
ment, whereas morphological traits showed more dispersion than a model of neutrality and complete heritability predicts. Our predictions are biased be- cause of the approximations employed. Within-group phenotypic variance is used as a proxy for additive genetic variance, and children are included in the sample for genetic markers but not in the anthropometric sample. But both factors make our predictions larger than they should be, so it is all the more impressive that anthropometric variation is much greater than predicted. Our analysis provides convincing evidence that some factor other than drift is con- tributing to variation of morphological traits in Bougainville islanders.
We wish to thank L. WANDSNEIDER, L. SATTENSPIEL, M. SLATKIN, J. FELSENSTEIN, P. SMOUSE, J. WOOD, E. DEVOR, L. JORDE, R. CHAKRABORTY, J. SPUHLER, C. QUALLS and C. MOLER for their comments and suggestions. Matrix computations were performed by MATLAB, a matrix language under development at the Department of Computer and Information Science, University of New Mexico.
LITERATURE CITED
BIRDSELL, J., 1950 Some implications of the genetical concept of race in terms of spatial analysis.
BODMER, W. F. and L. L. CAVALLI-SFORZA, 1968 A migration matrix model for the study of Cold Spring Harbor Symp. Quant. Biol. 15: 259-314.
random genetic drift. Genetics 5 9 565-592.
BULMER, A. M., 1980
CHAKRABORTY, R. and M. NEI, 1982
The Matheinatical Theory of Quantitative Genetics. Clarendon Press, Oxford.
Genetic differentiation of quantitative characters between populations or species. I. Mutation and random genetic drift. Genet. Res. 3 9 303-314.
COURANT, R., 1936
CROW, J. F. and M. KIMURA, 1970 New York.
DOOB, J. L., 1953
FALCONER, D. S., 1981
FELLER, W., 1957
Dzferential and Integral Calculus, Vol. 2. John Wiley and Sons, New York.
An Introduction to Population Genetics Theory. Harper and Row,
Stochastic Processes. John Wiley and Sons, New York.
Introduction to Quantitative Genetics, Ed. 2. Longman, New York.
An Introduction to Probability Theory and its Applications, Vol. 1. John Wiley and Sons, New York.
FISHER, R. A., 1958
FORSYTHE, G. E., M. A. MALCOLM and C. B. MOLER, 1977
The Genetical Theory of Natural Selection, Ed. 2. Dover, New York.
Computer Methods for Mathematical Computations. Prentice-Hall, Englewood Cliffs, New Jersey.
FRIEDLAENDER, J. S. 1975 Patterns of Human Variation: The Demography, Genetics, and Phenetics of Bougainville Islanders. Harvard University Press, Cambridge, Massachusetts.
998 A . R . ROGERS AND H . C. HARPENDING
HARPENDING, H. C. and T. JENKINS, 1974 !Kung population structure. pp. 137-161. In: Genetic Distance, Edited by J. F. CROW and C. DENNISTON. Plenum Press, New York.
HARPENDING, H. C. and R. WARD, 1982 Chemical systematics and human populations. pp. 213- 256. In: Biochetnicnl Asperts of Evolutiotzor~~ Biology, Edited by M. NITECKI. University of Chicago Press, Chicago.
HIERNAUX, J., 1977 Long-term biological effects of human migration from the African savanna to the equatorial forest: a case study of human adaptation to a hot and wet climate. pp. 187- 21 8. In: Populntioii Structurc crnd Huinotz Variation, Edited by G. A. HARRISON. Cambridge University Press, Cambridge.
JACQUARD, A., 1974 JORDE, L. B., 1979
LANDE, R., 1976
Thc Getietir Structurp of Populatioizs. Springer-Verlag, New York.
T h e genetic structure of the Aland Islands, Finland. Ph.D. Dissertation,
Natural selection and random genetic drift in phenotypic evolution. Evolution
LANDE, R., 1979 Quantitative genetic analysis of multivariate evolution, applied to brain:body
MARUYAMA, T . , 1977 Stochastic Probletns in Population Genetics. Springer-Verlag, New York.
NEI, M. and W-H. LI, 1973
RELETHFORD, J. H . and F. C. LEES, 1982
ROGERS, A. R., 1982
SMITH, C. A. B., 1969
TATSUOKA, M., 1971
University of New Mexico, Albuquerque, New Mexico.
30: 314-334.
size allometry. Evolution 331: 402-416.
Linkage disequilibrium in subdivided populations. Genetics 75: 213-
T h e use of quantitative traits in the study of human
Variation of neutral characters in subdivided populations. Ph.D. Disserta-
Local fluctuations in gene frequencies. Ann. Hum. Genet. 32: 251-260.
Multizlariote Analjsis: Techniques f o r Educational and Psychological Rescorch.
WADE, M. J., 1978 A critical review of the models of group selection. Q. Rev. Biol. 53: 101-
WORKMAN, P. L., H. HARPENDING, J. M. LALOUEL, C. LYNCH, J. D. NISWANDER and R. SINGLETON, Population studies on southwestern Indian tribes. pp. 166-194. In: Genetic Structure of
T h e roles of mutation, inbreeding, crossbreeding and selection in evolution.
An analysis of local variability of flower color in Linnnthus parryae. Genetics
T h e genetical structure of populations. Ann Eugen. 15: 323-354.
Evolution crnd the G ~ ~ e t i c s of Populations, Vol. 4, Variability within and among
Corresponding editor: M. NEI 219.
population structure. Yrbk. Phys. Anthropol. 25: 11 3-132.
tion, University of New Mexico, Albuquerque, New Mexico.
John Wiley and Sons, New York.
114.
1973
Populntiovs, Edited by N. E. MORTON. University Press of Hawaii, Honolulu, Hawaii.
Proc. 6th Int. Congr. Genet. 1: 356-366. WRIGHT, S., 1932
WRIGHT, S., 1943
WRIGHT, S., 1951
WRIGHT, S., 1978
28: 139-156.
Natural Populations. University of Chicago Press, Chicago.
APPENDIX The expectatton of variance in group inems
POPULATION STRUCTURE 999
The ZJ th (offdiagonal) entry of S is the normalized covariance of the frequencies of the "plus" alleles at the zth and j t h loci. Since = 1
-
q r k ,@,y'ifi~k)i'2sv = (wipv
-
f i , ) ( p t k-
fid)These summations are the covariances of the "plus" allele at the j t h locus and each of the two alleles at locus k. These two alleles are distinguished by their effect on character value. But, since we are discussing neutral characters, the covariances are products of drift and migration alone, and their expectations do not depend on the alleles' effects on character value. Hence, the expec- tations of the two covariances are equal, and this implies that both are zero. Thus, E ( S , ) = 0, provided that z = j and pIjI # 0. This establishes that, in expectation, S is a diagnonal matrix with diagonal entries equal to E(&). Hence, E(u:J is given by WRIGHT'S formula, equation (4).
Gametic disequilibrium has no effect on the expectation of variance among groups.
The law of large numbers aind Ru,
expectation. For multiple loci the 11th entry of R., is
This section establishes that, if the number of loci, k, is large, the matrix R, will be close to its
l k k /=I
Rul,v =
-
W : / ~ W ; / ~ Z , / Z , / (18)Thus, R,, is an average of k terms, each referring to a single locus, and the expectation of each is given by equation (9). The law of large numbers guarantees that, if k is large, K,,,, will be close to its expectation, provided that (1) the terms in the summation in (18) are mutually uncorrelated in expectation and ( 2 )
as k ---f m (DWB 1953). We showed that that zB and zrk are uncorrelated in expectation for 1 # k,
and the same argument can be used to establish condition (1). T o establish condition ( 2 ) define
R(1) e Z/Z:
This IS an unweighted R matrix for locus 1. Its expectation is denoted by
R = E(R(l))
As before, 7.1 is a column vector of normalized gene frequencies for locus 1 , and E{R(l)) is the same for all loci. The variances in (19) are
Var{r,/z,/l = E(&:/) - R%
Rogers (1982, p. 53) has shown that
E(z%:/~ R,, RjI
+
2RtSubstituting these results back into (19), w e have ~w,(Rt,Rjj
+
R ; ) ---fk
1000 A. R. ROGERS AND H . C. HARPENDING
Thr m r m u p of vorzmrp ? i i grou) meatis
T w o formulas have been presented for the variance among groups in a quantitative character. Equation (4), which ignores gametic disequilibrium, was shown to hold in expectation. In this section we use equation (5) t o investigate the standard error of variance among groups.
T h e expectation of ( 5 ) is
k
E{U?,2) = 2020
c
#,Elcos28,1 (20)I= 1
And since the orientation of the eigenvectors is completely indeterminate,
E(cos28,) = E(cos28,1
for all and 1. T h e orthogonality of the x,'s implies that the sum of cos2& is 1. Thus,
k k
E cos28, = E(cos28,) = 1
Since the expectations inside the sum a r e all equal,
1
k E{cos28,) =
-
for all i.
Substituting back into (20) gives
This shows that WRIGHT'S formula (4) holds in expectation in spite of gametic disequilibrium among groups, confirming o u r earlier conclusion.
T h e variance of up is
/ k k
T h e indeterminacy of the eigenvectors simplifies this expression a great deal. It guarantees that
Var(cos'0,) = Var(cos28,l =: u2
for all z and j, and
cov{co~2e,, COS~S,) =
for all I # j. Since the sum of the cos 8,'s squared is 1,
= 0 = ku2
+
k(k-
1)c2
S o c = -
1 - k '
In the following section it is known that the variance of cos'6, is
2(k - 1)
u2 = ___
k2(k
+
2 )POPULATION STRUCTURE 1001
This is impossible to interpret since the magnitudes of the +’s and k are unknown. The expression can be simplified using the fact that the nonzero eigenvalues of %, p, are related to those of S
+z = P,.k by
Substituting leads to the asymptotic formula
The asymptotic formula is the upper bound of (22). When the number of loci, k, is greater than about 20 it is a good approximation.
The viorgifml distribution of 8,
8, represents the angle subtended by the ith eigenvector of S and an arbitrary vector, a. The marginal distributions of these variables are needed in deriving the variance of (5). Since the orientation of the eigenvectors of S is completely undetermined, there is symmetry to the rela- tionships between a and the various eigenvectors: a is no more or less likely to be colinear with the first eigenvector than with any of the others. In fact, the marginal distributions of the 8, are identical. We can find all the marginal distributions by finding just one.
Since the eigenvectors are orthogonal,
b
cos28i = 1, and
i- I
The probability density of 81 is obtained by integrating over the densities of all points ( 8 2 , 89, e4,
.
. .
, 8,) which satisfy (24). Notice that (24) defines a k-
1 dimensional sphere with radius lsinB I 1. The points that satisfy (24) are the surface of the sphere. Since the probability densities of all points are equal, the integral over the densities of these points is proportional to the surface area of the sphere. Let g(k
-
1, I sin 81 I) represent the surface area of a k-
1 dimensional sphere withradius
I
sin BI 1. Then the marginal density of 81 isk - 1, ! s i f t 81 I)
f(el) = 4
g(k - 1, sin el)doI
The area of a k
-
1 dimensional sphere is proportional to the (k-
2)th power of its radius (COURANT 1936). The constant of proportionality cancels in this expression, leavingT o evaluate the integral set k
-
2 = n. Thenr ,I!
-.-
if n is even2”-’(n - 1 /2)!’
n!
2 + l (n/2)!2
sin”8d8 =
if n is odd
s‘“
Using Stirling’s formula this reduces to
if n is even
($
1002 A. R. ROGERS AND H. C. HARPENDING
T h e second expression approaches the first as n + 00 and is roughly equivalent when
than about 10. For large k the marginal density of 0, is is greater
T h e variance of cos%, is
U' = E{cos"@]
-
( 1 / k) *T h e expectation is
l h e integral is, for large k ,
I /2
Thus,
~ { c o s ~ e ] =
-
3 k(k+
2 )and the variance of cos'% is
- 2 ( k