A DISCREPANCY BETWEEN GENETIC AND PHYSICAL LENGTHS ON THE CHROMOSOME OF BACTERIOPHAGE LAMBDA1
ELKE JORDAN2 AND MATTHEW MESELSON
Biological Laboratories, Haruard Uniuersity, Cambridge, Massachusetts
Received August 18, 1964
A
genetic map is a n arrangement of genes in which the distance between any pair of genes is proportional to the average number of exchanges between them. Such a map will correspond to the actual distribution of genes on a chromo- some only if the probability of exchange and recovery of recombinants is uniform along the chromosome. It was the purpose of the present investigation to detect any extensive departure from uniformity in the probability of exchange or recovery along the chromosome of bacteriophage A.It has been shown that recombination in bacteriophage h occurs by breakage and joining of the double-stranded DNA molecule which composes the phage chromosome (MESELSON and WEIGLE 1961 ; KELLENBERGER, ZICHICHI and WEIGLE 1961 ; IHLER and MESELSON 1963; MESELSON 1964). Unexpected features
of the results of MESELSON and WEIGLE (1961) led to this research. It was noticed that the distribution of parental DNA among progeny phages of certain genotypes was not as expected from random breakage of the chromosome during recombi- nation. The results reported here elaborate and help to clarify those observations. Crosses were carried out between heavy phages, labeled with C13N15, and light phages. One of the parents was marked at or near one end of the chromosome. The density distribution of the phages with the marker originally in the light parent was then observed in a CsCl density gradient. The results suggest that the production of phages recombinant in a certain region of the chromosome is greatly depressed. In addition, the left end of the h chromosome has been identi- fied as close to the marker sus11, the farthest known marker on that side of the genetic map. This, in conjunction with the identification of the right end of the chromosome near mi (MESELSON and WEIGLE 1961), means that essentially the whole h chromosome is included in the known genetic map.
MATERIALS A N D METHODS
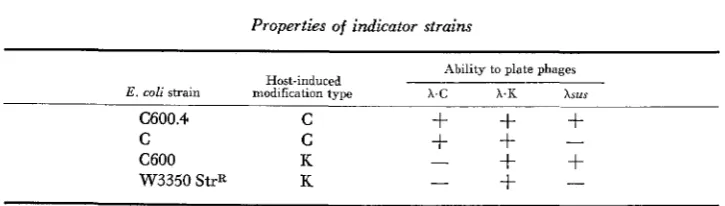
Escherichia coli strains. Strain C600 (APPLEYARD 1954) was used for the preparation of all phage stocks. Strain C (BERTANI and WEIGLE 1953) was employed as host for crosses involving host-induced modification; for other crosses strain C600 or W3110 (E. LEDERBERG) was used. As indicator strains, in addition to C600 and C, strain W3350 StrR (obtained from A. CAMPBELL) and C600.4, a host-modification mutant derived from C600, were used. The ability of various
This investigation was supported by Public Health Service Postdoctoral Fellowship No. 5-F2-CA-10,105 and by funds from the National Science Foundation.
I' Present address: Institut f u r Genetik, Universitlt zu Koln, Koln-Lindenthal, West Germany.
78 E. J O R D A N A N D M. M E S E L S O N
TABLE 1
Properties of indicator strains
Ability to plate phages Host-induced
E. coli strain modification type x c X K xsus
+
C600.4 C
+
+
C C
+
+
+
+
C600 K
-
+
W3350 StrR K -
-
-
phages to plate on these strains is shown in Table 1. Following ARBER and DUSSOIX (1962), A able to plate on K or C is designated as LK, A able to plate only on C as A C . The plating effi- ciency of 1.C on K strains varies between 10-3 and 10-4.
Bacteriophage strains. Phage A is the “wild type” of KAISER (1957). The suppressor-sensitive (sus) strains are described by CAMPBELL (1961). We have also used the minute plaque marker
mi (KAISER 1955) and the clear plaque marker cZ6 (MESELSON 1964). All these phages have
buoyant density 1.508 g cm-3 in pure CsCl solution at 20°C, pH 7.4.
Preparation of phage stocks. Stocks of light phages were prepared by scraping plates (ADAMS 1959). Heavy phages were prepared as described by MESELSON and WEIGLE (1961): A, Asus,,,
Asus,,, Asus,,, by induction of C600 lysogenic for the rcspective phages, Asus, by infection of C600. After the addition of 0.01 percent gelatin to stabilize the phages, the lysates were dialyzed against suspension medium (WEIGLE, MESELSON and PAIGEN 1959). The density homogeneity of the stocks was checked in a CsCl density gradient. The plating efficiency of the hsus stocks on W3350 StrR ranged between 6 x 10⁻⁴ and 4 x 10⁻⁶.
Density-gradient centrifugation. The technique described by MESELSON and WEIGLE (1961 )
was employed. Centrifugation was at 23,000 rev/min for 20 to 24 hours at 20°C.
Crosses. An overnight culture of strain C600 or strain C was grown to a concentration of 2 x l o 9 cells/ml, centrifuged, and resuspended in 0.01 M MgSO,. Of these cells, 2 x 10⁸ were
infected with a multiplicity of 3 to 5 of each parent phage. After filtration to remove unadsorbed phages, the cells were resuspended in tryptone broth at 5 x 10’ cells/ml and grown for 100 m:n, a t which time they were lysed with chloroform. The lysate was freed of bacterial debris by centrifugation and mixed with a saturated solution of CsCl (American Pstash and Chemical Corporation) to give an index of refraction $ 5 = 1.3805.
D
R E S U L T S A N D D I S C U S S I O N
PHYSICAL A N D GENETIC L E N G T H S I N h 79
10'
io5
io4
io3
IOZ
I I I
D r o p Number
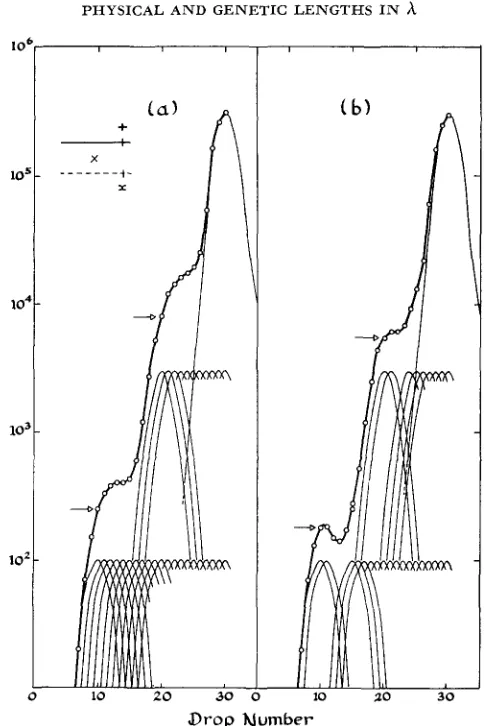
FIGURE 1.-Illustration of the expected density distribution of phages carrying the marker z
which was originally present in the light parent of a cross between light and heavy phages. For details see text. The arrows indicate the points chosen for measuring the position of shoulders for Table 2. They are the points directly over the peak of the first distribution of recombinants contributing to the shoulder. (a) Curve expected if breakage is equally likely at any point. (b) Curve showing the effect of greatly lowered or zero probability of recombination in a region near z, including 14 percent of the chromosome.
light chromosomes. Figure l a shows the distribution of phages carrying the marker x from the light parent if recombination is equally probable at each of the selected 20 points on the chromosome. Figure I b shows the effect on the shape of this distribution if recombination is much less probable or absent in one region of the chromosome. Notice that the chromosome can be surveyed only about one third of the way in from the marked end due to limited resolution in the density gradient.
80
susll m6
E. JORDAN A N D M. MESELSON
FIGURE 2.-A map of 1 showing the markers under consideration.
to those expected for a uniform probability of recombination. A cross with the marker susl1, the leftmost known marker on the map, is illustrated in Figure 3. The distribution of SUS+ phages extends almost as far as the peak of conserved,
heavy phages, indicating that susll is within a few percent of the end of the chro- mosome. There is no evidence for departure from uniform recombination, that is the curve corresponds fairly well to that shown in Figure l a . I n several subse- quent crosses, host-induced modification (see LURIA 1962) was exploited to sup- ress the appearance of the peak of light phages. It was hoped this would improve the resolution of the shoulders, especially the second shoulder which is barely distinguishable in Figure 3. ARBER and DUSSOIX (1962) have shown that the host- specificity of phage h is a property of its DNA but is not hereditary, being a func- tion solely of the host in which the phage DNA is synthesized. We have employed the K-C system of host-induced modification. E.
coli
strain C accepts phages pre- viously grown in either strain K or C, but K accepts only phages haiing at least one strand of DNA synthesized in K. We therefore carried out several crosses in strain C with phages prepared on strain K. By plating on strain K, the peak of light phages is strongly suppressed. Unfortunately, the use of host-induced modi- fication seems to improve the resolution of the shoulders only slightly, if at all. Figure 4 illustrates the result of a cross involving the marker m, and using host-induced modification. The distribution of hm, shows that m, is close to the end of the chromosome, though not so close as susl1. Again, there is no evidencefor nonuniform exchange at this end of the chromosome.
Crosses with markers near the right end of the h chromosome yielded radically different results. Figure 5 shows a cross involving
mi,
the marker nearest to this end. No host-induced modification is involved in the cross. The distribution ofmi
recombinants has an initial peak followed by a dip instead of the expected level shoulder. A similar dip occurs in the combined distribution of all mi types from the cross h cmi
x C13N15 and in the combined distribution of all mi+types from the cross h x h c mi C13N15 described by MESELSON and WEIGLE ( 1961 )
.
In order to define more precisely the chromosomal location of the discrepancy observed in Figure 5, crosses were performed with markers proximal to
mi.
Figure 6 shows a cross involving both
mi
and susa1, a marker which is close tomi
on the genetic map. Two distributions of recombinants are depicted in the figure: one for those phages that have picked upmi
and one for those that have picked up susa4+. Both curves show the peak and dip already observed in Figure 5.81
PHYSICAL A N D GENETIC LENGTHS I N h
"o.
$ 1
;
6e .I 2
!j
Q
; i
; z
E
K Z; p
x:Q )C
5
q
k
g
G 2 4
:
, B O $ 2;
q z '
! 4 % '
w
"a0
s
h $2
E +
2 E '2 d
b .2
W C - '
;%
W 3 . w
E '*G
3 E m
k + M -
R A
73.
$ 1
a
s e
s s
e
.s
2 Y
)rt . 5
.s
q
F a
z'
8:
n A m
i
Lo
x z9 2 2
53.,
:
ijq
c%
0
0,
T z ;
p"
30
0 .I n
Y)
e
W k
2 . 2 I
~ $ 1
3 h i -
2 $ + 2 0 k M,"
10 IO' IOf
E W t I- w a a I a IO! lo4 lo3
I
d
I I I I I DROP NUMBER 10 20 30 40 50 60 110 10 10' 10 10' 1c
PHYSICAL A N D GENETIC LENGTHS I N h 83
2 .kj
d m
9 i d
5 . 2
,
c z
E 2 I
$ 1 2
.- tl
@ Z
, : ; 4
2
E " *
E
. + b +2
2 5 s
r j x , (L x g -
2
, > E ;
Qg 3 H
I: " 0
" S I % E I
G 7 - C I
2 . 5 I
7
20
ad % * y s +
5
a.2
2 $ 4
k GI?
:G
"3. .- M
/
T ga, ' ^
I c ,g j
I
. 3 E l .
Y 2 g
d
.s
g
? $ 2 8
5
% 2
z
4 %) Q X Z .
' 2
: p
4
3 5 %
-
0 z 2 1
+-Eo
2
: $ I
2 G
yi ..c
W Z
Y h
m +
L 8 "
d - a I
2 . 5 1
c 2 0
w s
a ag*
3 " 2
2
E,-
84 E. J O R D A N A N D M. MESELSON
and dip are still present, but in a cross with sus3, shown in Figure 8, there is no longer any evidence of a dip. The marker mi is included in the cross shown in Figure 8 for comparison. These crosses were all performed with and without host-induced modification with essentially the same results.
Comparison of the curves in Figures 5-8 with the genetic map shown in Figure 2 will reveal that crosses with all markers to the right of sus3 give anomalous results, while crosses with sus.( itself do not. The anomalous behaviour here ob- served therefore begins between susi3 and sus3.
TWO hypotheses could be proposed to explain the shape of the anomalous curves. The peak may be produced by an excess of recombinants in the region beginning between susB and susi3 and extending possibly to the end of the chromosome. Alternatively, there may be a deficiency of recombinants between sus3 and sus73,
resulting in the dip. This possibility is illustrated in Figure lb. A deficiency of recombinants could be produced either by a low probability of exchange or by a lowered recovery of infectious phages.
The possibility of a lowered recovery of infectious phages in the dip region was explored further. It is possible that phages in this region of the gradient are non- infectious. Suppose that genetic recombination produces a damage, say an inter- rupted strand, in the region where breakage and joining occurs and that the damaged chromosomes are often matured without undergoing repair. If the damage is located in a vital early cistron such phages may be noninfectious. However, they might be revived and thereby detected by complementation with helper phages able to supply the vital function. Experiments to test this possibility were carried out using as helper phages hi434, h with a sus mutation in a distant part of the chromosome, or a late defective h. All these experiments were entirely negative. The possibility that there are defective phages in the dip region is thus made unlikely, although not ruled out.
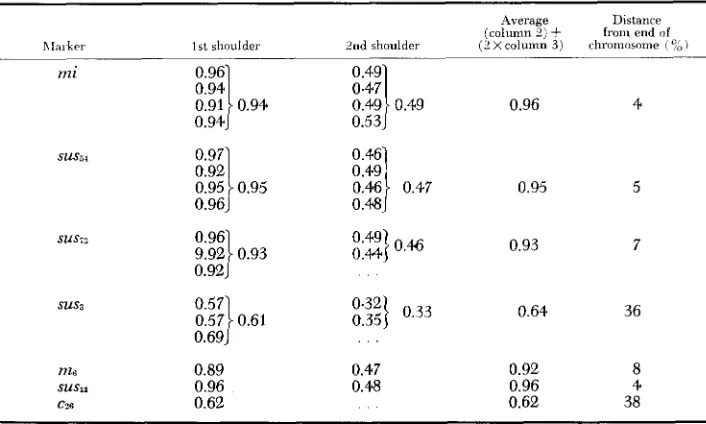
We have been able to obtain additional evidence for a region with anomalous recombination which suggests that the anomaly results from a deficiency of phages recombinant between sus3 and sus73. It is possible to construct a rough physical map of the chromosome of using the data of Figures 3-8 and similar experi- ments, by measuring the position of the shoulders in the density distributions of recombinants. The legend to Figure 1 explains how the points used in making the measurements were chosen. In Table 2 are given the results of such measure- ments. The second column gives the distance from the first shoulder to the peak of light phages as a fraction of the distance between light and heavy peaks. The third column gives the same fraction for the second shoulder. In the fourth and fifth columns these fractions are converted to distances on a physical map. Table 3 shows various physical map distances in comparison with the corresponding genetic map distances obtained by AMATI and MESELSON (1965).
P H Y S I C A L A N D GENETIC LENGTHS I N 85
TABLE 2
Calculation of physical map distances
nIalhpl 1st shoulder
mi
SUS54
sus;:.
sus3
;::!I
0.91 0.94 0.94j
0.96)
0.96 9.991 0.93
0.92)
0.57 0.571 0.61 0.69)
0.89 0.96 0.62
Average (column 2)
+
(2 X column 3) 2nd shoulder0.96
0.53
0.49
0.461
0.46} 0.47 0.481
0.46
0.47 0.48 . . .
0.95
0.93
0.64
0.92 0.96 0.62
Distanre from end of cl~romosame ( ?(, >
4
36
8
4
38
For details see t e i t
this interval is much greater than any other, including that for the very long interval susI1-mi. We therefore conclude that the production of phages recombi- nant in the interval sus3-sus7:j is greatly depressed.
S U M M A R Y
Crosses have been performed between isotopically heavy and light phages. The distribution of heavy DNA among phages with markers picked up from the light parent was determined in a density gradient. By this means a rough physical map
TABLE 3
Comparison of physical and genetic lengths Genetic length
-
Corrected for
Observed interference ' Ratio
( % recom- (centi- Physical length (physical length/
Interval bination) morgans) ( % of chromosome) genetic length)
( 1 ) sus5r-mi 0.5 1.2 1 0.8
(2) SUSiQ -susr,, 1 .0 3.0
e
0.7( 3 ) sus3 - susn 1.4 4.7 29 6.0
(4) c-sus3 1.1 3.4
e
0.6(5) m6-ssusll 1.6 5.6 4 0.7
(6) susll - mi 70, 92 1.3
86 E . JORDAN A N D M. MESELSON
has been constructed. The left end of h has been identified as near the marker
susl1. The right end of the chromosome had previously been identified as near mi.
The production of phages recombinant in a certain region of the X chromosome appears to be greatly depressed.
LITERATURE CITED
Bacteriophages. Interscience, New York. ADAMS, M., 1959
AMATI, P., and M. MESELSON, 1965 ics (In press).
APPLEYARD, R. K., 1954
strain derived from Escherichia coli, Genetics 39: 440-452. ARBER, W., and D. DUSSOIX, 1962
Biol. 5 : 1 8 4 9 .
BERTANI, G., and J. WEIGLE, 1953
6 5 : 113-121. CAMPBELL, A. C., 1961
IHLER, G., and M. MESELSON, 1963
KELLENBERGER, G., M. L. ZICHICHI, and J. WEIGLE, 1961
KAISER, A. D., 1957
Localized negative interference in bacteriophage A. Genet-
Segregation of new lysogenic types during growth of a double lysogenic
Host specificity of DNA produced by Escherichia coli. J. Mol.
Host controlled variation in bacterial viruses. J. Bacteriol.
Sensitive mutants of bacteriophage A. Virology 14: 22-32.
Genetic recombination in bacteriophage A by breakage and joining of DNA molecules. Virology 21 : 7-10.
Exchange of DNA in the recombina- tion of bacteriophage A. Proc. Natl. Acad. Sci. U.S. 47: 869-878.
Mutations in a temperate Bacteriophage affecting its ability to lysogenize
Escherichia coli. Virology 3 : 42-61.
-
1955 A genetic study of the temperate coli- phage A. Virology 1 : 424443.Genetics of bacteriophage. Ann. Rev. Microbiol. 116: 205-240. LURIA, S. E., 1962
MESELSON, M., 1964
MESELSON, M., and J. WEIGLE, 1961
WEIGLE, J., M. MESELSON, and K. PAIGEN, 1959
On the mechanism of genetic recombination between DNA molecules.
Chromosome breakage accompanying genetic recornbina-
Density alteration associated with transducing J. Mol. Biol. 9: 734-745.
tion in bacteriophage. Proc. Natl. Acad. Sci. U.S. 47: 857-868.