STATISTICAL ANALYSIS O F THE BASE COMPOSITION OF’ GENES USING DATA ON
THE
AMINO ACID COMPOSITION O F PROTEINS*TOMOKO ORTA A N D MOT00 KIMURA
Nrrtional Institute of Genetics, Mishima, Japan Received October 9, 1969
importance of DNA base composition per genome for the consideration of T:%.don and phylogeny was clearly shown by the work of SUEOKA (1961)
who made an extensive compilation of the mean G-C (guanine and cytosine) content among diverse groups of organisms ranging from bacteria to vertebrates.
SUEOKA (1962) and FREESE (1962) also proposed an evolutionary theory to ac- count for the nature of the variation and heterogeneity of G-C content based on a statistical consideration of conversion between A-T (or T-A) and G-C (or C-G) pairs in a species.
From the standpoint of population genetics, molecular evolution consists of a series of base substitutions in the population, and there is growing evidence sug- gesting that this is mainly carried out by random fixation of selectively neutral mutants (KIMURA 1968,1969; KING and JUKES 1969; CROW 1969).
For further understanding of the mechanism of evolution at the molecular level, it is desirable to know the frequency distribution of the base composition among the genes (cistrons).
In the present paper, we intend to analyze this distribution using data on amino acid composition of proteins derived from vertebrates.
It will be seen that this type of analysis poses many interesting problems not only in genetics and evolution but also in biometry.
STATISTICAL M E T H O D
In this section, we will describe a method of estimating the base composition of RNA which corresponds to a protein molecule, using published data on the amino acid composition. The standard RNA code table was used (see Table 1 ) . Because of the degeneracy of the code, and especially because of the synonymy in the third position, a complete estimation is possible only for the first and second positions of the codon.
Let us designate the frequencies (in absolute numbers) of 20 kinds of amino acids in a molecule, by their three bracketed letters, such as [Ala], [Cys] and [Pro]
,
respectively, denoting frequencies of alanine, cysteine and proline. Also, [Asn] and [Gln] denote the numbers of asparagine and glutamine, respectively. Let N be the total number of amino acids i n a molecule. Also, let us denote by * Contribution No. 746 from the National Institute of Genetics, Mishima, Shizuoka-ken, Japan. Aided in part by a Grant-in-Aid from the Ministry of Education, Japan.388 T O M O K O O H T A A N D MOT00 K I M U R A
TABLE 1
The standard R N A code dictionary “Term.” denotes chain-terminating codons
U
C
A
G
U
C A GPhe S e r T Y r CYS
Phe S e r TYr CYS
Leu Ser Term. Term.
Leu S e r Term. T r P
Leu P r o His A r g
Leu P r o His A r g
Leu P r o G l n A r g
Leu P r o G l n A r g
I l e T h r A s n Ser I l e T h r A s n Ser I l e T h r LYS A r g
M e t T h r LYS A r g
V a l A l a ASP G l Y
V a l A l a ASP GlY
V a l A l a Glu GlY
B A S E C O M P O S I T I O N O F G E N E S 389
U1, A l , C1 and G1 the frequencies of uracil, adenine, cytosine and guanine at the first position of the codon in the RNA molecule,
and
by
U2,
A2,
C2and
G2,those at the second position.
Then, frequencies U2,
A2
and G2f
C2 in the second position can be estimated without error as follows:U2 =- 1 ([Phe]+[Leu]+[Ile]+[Met]+[Val]) N
1
N
A2 =- ([Tyr]+[His]+[Gln]+[Glu]+[Asp]+[Asn]+[Lysl) G2
4-
C2=
-!-
( [Ser]+
[Pro]+
[Thr] +[Ala]+
[Cysli-
CTrp1-I-
N
[Argl+CGlyI)
I n order to separate G2 from C2, an indirect method of estimation is required because serine having 6 synonymous codons contributes to both
G2
and C2. Simi- larly, nucleotide frequencies in the first position have to be estimated indirectly, since leucine contributes both to U1 and C1, and, arginine contributes to both C1 and A l . The method of separation is as follows. I n the case of serine, it cor- responds to two groups of codons, one having UC and 'the other having AG in their first two positions. Accordingly, [Ser] can be divided into 2 parts, [Ser], and [Ser12, and we assume that [Ser], is proportional to U1 X C2, and [SerlZ isproportional to
1/2
(A1 X G2). Namely, in this separation, we assume that fre- quencies in the first and second positions are statistically independent. Thusx
[Ser] 2u1x
c2
[sw11=(2U1
x
C2)+
(A1x
G2) [Ser], = [ S e ] - [Ser],Similarly,
[Leu], = [Leu]
-
[Leu], 2c1= 2c1 + Al-
x
[Argl [ k g l = rArg1 - [ArglWith these separations all the other nucleotide frequencies can be estimated as follows :
1 N
1
N
A1 =
-
{ [Ile]+
[Met]+
[Thr]+
[Asn]+
[Lysl+
CSerlz+ [Argla} U1 =-
{ [Phel-t [Leu] [Ser] ,f [Tyr]+
[ Cys] 4-[Trp]
}1 N
1
N
Cl =
-
{ [Leu12+[Pro]+
[His] +[Gln]+[Arg] G 1 = 1- A1-
U1 -ClC2 =
-
{ [ Ser]4-
[Pro]+
[ Thr]+
[Ala] } G 2 = 1 -A2-U2--C2390 TOMOKO O H T A A N D M O T 0 0 K I M U R A TABLE 2
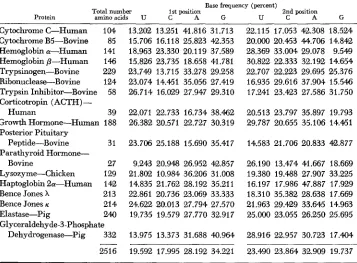
Estimated base frequencies (%) in the first and second positions of the R N A codons
Base frequency (percent)
Total number 1st position 2nd position
Protein aminoacids U C A G U C A G
Cytochrome C-Human 104 13.202 13.251 41.816 31.713 22.115 17.053 42.308 18.524 Cytochrome B5-Bovine 85 15.706 16.118 25.823 42.353 20.000 20.453 M.706 14.842 Hemoglobin a-Human 141 18.963 23.330 20.119 37.589 28.369 33.004 29.078 9.549 Hemoglobin p-Human 146 15.826 23.735 18.658 41.781 30.822 22.333 32.192 14.654 Trypsinogen-Bovine 229 23.749 13.715 33.278 29.258 22.707 22.223 29.695 25.376 Ribonuclease-Bovine 124 23.074 14.451 35.056 27.419 16.935 29.616 37.904 15.546 Trypsin Inhibitor-Bovine 58 26.714 16.029 27.947 29.310 17.241 23.423 27.586 31.750 Corticotropin (ACTH)
-
Human 39 22.071 22.733 16.734 38.462 20.513 23.797 35.897 19.793 Growth Homone-Human 188 26.382 20.571 22.727 30.319 29,787 20.655 35.106 14.451 Posterior Pituitary
Peptide-Bovine 31 23.706 25.188 15.690 35.417 14.583 21.706 20.833 42.877 Parathyroid Hormone-
Bovine 27 9.243 20.948 26.952 42.857 26.190 13.474 41.667 18.669 Ly sozy me-Chicken 129 21.802 10.984 36.206 31.008 19.380 19.488 27.907 33.225 Haptoglobin 2a-Human 142 14.835 21.762 28.192 35.211 16.197 17.986 47.887 17.929 Bence Jones X 213 22.861 20.736 23.069 33.333 18.310 35.382 28.638 17.669 Bence Jones K 214 24.622 20.013 27,794 27.570 21.963 29.429 33.645 14.963 Elastase-Pig 240 19.735 19.579 27.770 32.917 25.000 23.055 26.250 25.695
Glyceraldehyde-3-Phosphate
Dehydrogenase-Pig 332 13.975 13.373 31.688 40.964 28.916 22.957 30.723 17.404
2516
-
19.592 17.995 28.192 34.221 23.490 23.864 32.909 19.737I n applying formula (2) for separating [SerIl from [Ser], and so forth, we take arbitrary starting values, AI,, Ul,, Cl,, Gl,, C2, and G2,, for Ithe correspond- ing frequencies A l , U1, etc. Here, AI,
+
U1,+
C1,+
GI, = 1 and C2,+
G2, =1 -
A2
-
U2. Using these initial values for base frequencies, the first estimates for [Ser] [Ser]. . .
etc. are obtained using formula (2). Then the first estimates for base frequencies, AI, U1,. . .
G2, are obtained by formula ( 3 ) . Next, using these estimates, the second cycle of the same procedure gives the second set of estimates. With the help of theIBM
360 computer, the process is repeated many times until the maximum of the differences in the absolute values of the consecu- tive estimates of 6 frequencies is less than 0.00001.ANALYSIS A N D DISCUSSION
Seventeen vertebrate proteins were chosen from data compiled by DAYHOFF
and ECK (1969). T o avoid repetition, closely related proteins were not included. For example, once human hemoglobin a-chain was chosen, other vertebrate hemoglobin a-chains were not included in the analysis. Table 2 shows the re- sullts of the analysis. From this analysis, it turned out that+ mean G-C content at the first position of the codon
(pl)
is 52.22% and that at the second positionBASE COMPOSITION OF GENES 391
1
h
3 0 3 5
4045
5 0 5 5 6 0 6 5
70 75
8 0 8 5
90
G-C Content
(PA)
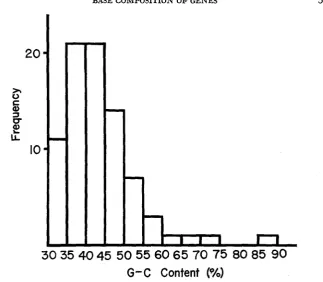
FIGURE 1.-Frequency distribution of G-C content 'among vertebrate genes with respect to the second position of codons.
with respect to the second position of codons. In constructing the histogram, data listed by SMITH (1966) were also included, in addition to those given by DAY-
HOFF and ECK (1969). Also, the variances of G-C content in the first and second
positions are, respectively, s2p, = 0.00552 and s2p, = 0.00495. Note that their ex-
peated values, as calculated by
p
(1-
p)
/R
in which&
is the harmonic mean of N, turned out to be 0.0024. According to CHARGAFF (1 955),
the mean G-C content of vertebrate DNA is about 42% (sce also SUEOKA 1962). It is interesting thatPI
is considerably higher than this, although Ijz is very close to it. The present analysis also reveals an interesting fact that frequencies of A and U, and, also those of G and C are not generally equal. This should mean that the base composi- tion of an informational strand and that of its complementary strand are not generally equal. I n fact, Table 2 shows that adenine content is almost always higher than uracil content. Ax2
test for the hypothesisA2
= U2, using 17 pro- teins in Table 2, shows that deviation from it is highly significant. This conclusion must be especially valid for the second position of the codon, because, as shown in formulas ( l ) , A2 and U2 can be estimated without error, and furthermore, as seen from Table 2, A2>
U2 was observed in all the vertebrate proteins analyzed in this paper. The tendency of A>
U
may also be inferred for the third position by comparing U -I- C us. A f G, as tested by the ratio {[His] 4- [Asn]4-
[&PI
} :392 TOMOKO OHTA AND MOT00 KIMURA
level of messenger RNA, the informational strand in vertebrate DNA must contain more thymine than adenine. If the base composition is heldat equilibrium by a balance between mutations of 4 bases in 12 directions, their mutation rates must be different. FITCH (1967) found a nonrandom character to base replace- ment by analyzing human hemoglobin mutants and also evolutionary amino acid substitutions in cytochrome c in various organisms. He found excess of guanine -+ adenine direction. This seems to agree with our result at the second position.
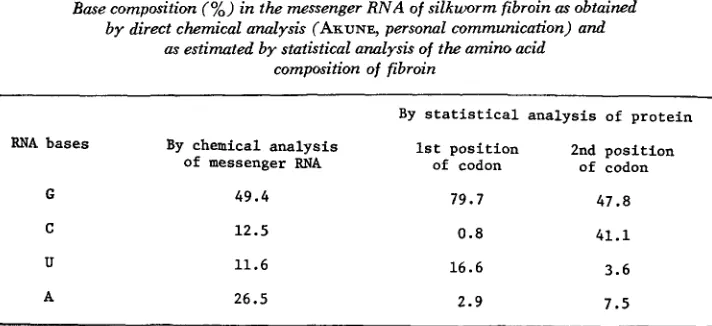
A difference of base composition between 2 complementary strands can also be seen clearly from Table 3, which is the result of analysis of silkworm (Bombyx
mori) fibroin using data of SHIMIZU, FUKUDA and KIRIMURA (1957). They listed the amino acid composition of silkworm fibroin in weight percentage. This was converted to molar percentage and then analyzed by our statistical method. This protein has the characteristic that it consists mainly of alanine and glycine, so that its guanine content is very high. The base compositions in the first and the second positions of the codon are also quite different for this protein. The first column of Table 3 shows the base composition obtained by chemical analysis of the corresponding messenger RNA (data from
S.
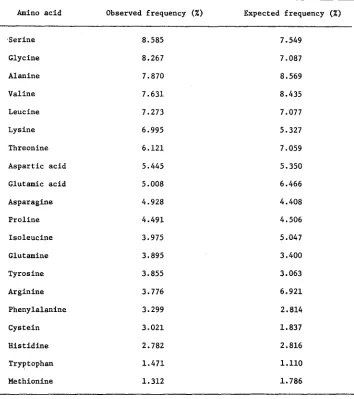
AKUNE by personal communi- cation). The difference between the result obtained by chemical analysis and those obtained by statistical analysis is probably due to the base composition at the third position, provided that the result of chemical analysis is accurate.Finally we tried to reconstruct the amino acid composition in the same 17 enzymes as before, using the estimated base composition and assuming random combination of bases. The expected frequencies were calculated by multiplying base composition at the first position by that of the second position. For example, frequency of alanine is calculated by GI x C2. When the synonymous codons are separated also at the third position, the ratio ( U f C) us. (A -I- G) at that position was multiplied. The amino acid frequencies thus obtained were corrected to make 100% in total, since there are three terminating codons, UAA, UAG
and UGA.
TABLE 3
Base composition (%) in the messenger R N A of silkworm fibroin as obtained by direct chemical anulysis (ARUNE, personal communication) and
as estimated by statistical analysis of the amino acid composition of fibroin
-
By statistical analysis of protein
By chemical analysis 1st position 2nd position
of messenger RNA of codon of codon
RNA bases
49.4 79.7 47.8
G
C
U
12.5
11.6
0 . 8 41.1
16.6 3.6
26.5 2.9 7.5
393 BASE C O M P O S I T I O N O F G E N E S
TABLE 4
Amino acid composition of 17 proteins listed in Table 2
The expected frequencies were calculated assuming random combination of bases in the codon.
Amino a c i d Observed frequency (%) Expected frequency ( X )
.Serine 8.585 7.549
Glycine 8.267 7.087
Alanine 7.870 8.569
Valine 7.631 8.435
Leucine 7.273 7.077
Lysine 6.995 5.327
Threonine 6.121 7.059
Aspartic acid 5.445 5.350
Glutamic acid 5.008 6.466
Asparagine
P r o l i n e
4.928
4.491
4.408
4.506
Isoleucine 3.975 5.047
Glutamine
Tyrosine
3.895
3.855
3.400
3.063
Arginine 3.776 6.921
Phenylalanine 3.299 2.814
Cystein 3.021 1.837
H i s t i d i n e 2.782 2.816
Tryptophan 1.471 1.110
Methionine 1.312 1.786
394 TOMOKO OHTA A N D MOT00 KIMURA
At any rate, the good overall agreement between the observed and expected amino acid composition of proteins suggegts, as pointed out by KING and JUKES
(1969) and also by CROW (1969) and KIMURA (1969)
,
a random nature of amino acid substiltution in protein evolution, since, if it had occurred exclusively by natural selection of rare advantageous mutations, the frequency of a particular amino acid would not depend on whether it has many synonymous codons or only one. Actually, nonrandomness was pointed out already by many investigators. This should not mean that amino acid substitution in evolution is completely at random and that natural selection is not important.Our data also indicate that the base arrangement is not wholly at random. The variances of G-C content between genes at the first and the second position of codons as estimated in the present paper are significantly larger than their ex- pected values, indicating some nonrandomness in the occurrence of purines and pyrimidines. A similar tendency was noticed by KIMURA (1961 ) for data obtained by SUEOKA (1959, 1961) on the variance of G-C content among DNA molecules within an organism. For example, in calf thymus DNA, the observed variance is some 36 times as large as that expected from complete randomness. The har- monic mean of the number of nucleotide pairs per molecule is about I O 4 in this case. The ratio between obsemed and expected variances becomes less when the molecules are split into pieces of about one-tenth in size by ultrasonic vibration. KIMURA (1961) tried to explain such results by assuming the existence of re- peating sequences. But it now appears more probable that such discrepancy is due to intrinsic differences in mean G-C content between genes caused by natural selection acting on gene function.
SUEOKA'S work also shows that the variance is larger in higher than in lower organisms. The famous work of
JOSSE,
KAISER and KORNBERG (1961) on nearest neighbor analysis clearly shows nonrandom arrangement between adjacent base sequences in various organisms. SMITH (1969) recently evaluated the informa- tion density of DNA for several organisms and obtained a higher density for higher organisms.Considering all these facts, we should conclude that although the majority of the base substitutions are selectively neutral or nearly neutral in the evolution of the species, natural selection is essential to bring out order in genetic constitution
(see also KIMURA 1969).
SUMMARY
BASE C O M P O S I T I O N O F G E N E S 395
brate genome. The average G-C content turned out to be about
52%
for the first position and 43% for the second position of codons. Their variances are #higher than expected. Et was also noticed that adenine content is almost always higher than uracil content, indicating different base composition between two comple- mentary strands of vertebrate DNA. The problem of randomness in base arrange- ment in relation to molecular evolution by random drift and selection was dis- cussed.L I T E R A T U R E C I T E D
CHARGAFF, E., 1955
CROW, J. F., 1969
DAYHOFF, M. 0. and R. V. ECK, 1969
FITCH, W. M., 1967
FREESE, E., 1962
JOSE, J., A. D. KAISER land A. KORNBERG, 1961
Isolation and composition of deoxypentose nucleic acids and of the cor- responding nucleoproteins. pp. 307-372. In: The Nucleic Acids I . Academic Press, New York. Molecular genetics and population genetics. Proc. 12th Intern. Congr. Ge- netics 3 : 105-113.
Atlas of Protein Sequence and Structure. National Bio- medicql Researoh Foundation, Silver Spring, Maryland.
Evidence suggesting a nonrandom character 'to nucleotide replacements in naturally occurring mutations. J. Mol. Biol. 26 : 499-508.
On the evolution of the base composition of DINA. J. Theoret. Biol. 3: 82-101. Enzymatic synthesis of deoxyribonucleic acid. VIII. Frequencies of nearest neighbor base sequences in deoxyribonucleic acid. J. Biol. Chem.
236: 864-875.
KIMURA, M., 1961 Natural selection as the process of accumulating genetic information in adaptive evolution. Genet. Res. 2: 127-140. -
,
1968 Evolutionary rate at the molecu- lar level. Nature 217: 624-626. -, 1969 The rate of molecular evolution considered from the standpoint of population genetics. Proc. Natl. Acad. Sci. U.S. 63: 1181-1188. KING, J. L. and T. H. JUKES, 1969 Non-Darwinian evolution: Random fixation of selectivelyneutral mutations. Science 164: 788-798.
SHIMIZU, M., N. FUKUDA and J. KIRIMURA, 1957 Silk proteins. pp. 317-377. In: Protein Chem- istry 5 . (in Japanese) Kyoritsu Shuppan, Tokyo.
SMITH, M. H., 1966 SMITH, T. F., 1969
SUEOKA, N., 1959
The amino acid composition of proteins. J. Theoret. Biol. 13: 261-282. The genetic code, information density, and evolution. Mathematical Bio-
A statistical analysis of deoxyribonucleic acid in density gradient centrifn- gation. Proc. Natl. Acad. Sci. U.S. 45: 148C-1490. - , 1961 Variation and heterogen- eity of base composition of deoxyribonucleic acids: A compilation of old and new data. J. Mol. Biol. 3: 31-40. On the genetic basis of variation and heterogeneity of DNA base composition. Proc. Natl. Acad. Sci. US. 4.8: 582-592.
sciences 4 : 179-1 87.