TABLE OF CONTENTS:
Vol. 42, No. 5,
September 1989
ARTICLES
Plant/ Animal Interaction
354
361
366
368
372
376
Effects of goat browsing on gambel oak communities in northern Utah by
Robert A. Riggs and Philip J. Urness
Observations on white&Bed deer and habitat response to livestock graz-
ing in south Texas
by Will E. Cohen, D. Lynn Drawe, Fred C. Bryant, and
Lisa C. Bradley
Toxicologicai investigations on Toano, Wasatch, and stinking miik-
vetchez
by M. Cobum Williams
The effed
of cattle grazing on the growth and miserotoxin content of
Columbia milkvetch
by Dee A. Quinton, Walter Majak, and John W. Hall
Effects of short-duration grazing on winter annuals in the Texas Rolling
Plains by Jeffrey R. Weigel, Guy R. McPherson, and Carlton M. Britton
Cues cattle use to avoid stepping on crested wheatgrass tussocks by David
F. Balph, Martha
H. Balph, and John C. Malechek
Soils/ Hydrology
378
Infiltration and runoff water quality response to silvicultural and grazing
treatments on a longleaf pine forest by James C. Wood, Wilbert
H.
Blackbum, Henry A. Pearson, and Thomas K. Hunter
382
Infiltration and sediment production as affected by soil surface conditions
in a shrubland of Patagonia, Argentina
by Cisar M. Rostagno
386
Matric potential of clay loam soils on arid rangelands in southern New
Mexico
by Carlton H. Herbel and Robert P. Gibbens
Measurement
393
Growth patterns of yearling steers determined from daily live weights by
Pat 0. Currie, Jerry D. Volesky, Don C. Adams, and Bradford W. Knapp
396
An improved harness for securing fecal collection bags to grazing cattle by
D.R. Tolleson and L.L. Erlinger
Improvement
400
Winter forb control for increased grass yield on sandy rangeland by Bill E.
Dahl, Jeffrey C. Mosley, Paul F. Cotter, and Roy L. Dickerson, Jr.
404 Root-feeding insects of
Senecio riddellii
in eastern New Mexico and
northwestern Texas
by Robert W. Sites and Sherman A. Phillips, Jr.
407
Control of huisache and honey mesquite with a carpeted roller herbicide
Published bimonthly-January, March, May, July, September, November Copyright 1989 by the Society for Range Management
INDIVIDUALSUBSCRIPTION is by membership in the Society for Range Management.
LIBRARY or other INSTITUTIONAL SUBSCRIP- TIONS on a calendar year basis are $56.00 for the United States postpaid and $66.00 for other coun- tries, postpaid. Payment from outside the United States should be remitted in US dollars by interna- tional money order or draft on a New York bank. BUSlNESSCORRESPONDENCE,concerningsub- scriptions. advertising, reprints, back issues, and related matters, should be addressed to the Manag- ing Editor, 1839 York Street, Denver, Colorado 80206.
EDITORIALCORRESPONDENCE. concerning manu- scriptsorothereditorial matters,should beaddressed to the Editor, 1839 York Street, Denver, Colorado 80206.
INSTRUCTIONS FOR AUTHORS appear on the inside back cover of most issues. A Style Manual is also available from the Society for Range Manage- mentat theaboveaddress@$2.00forsinglecopies; $1.25 each for 2 or more.
THE JOURNAL OF RANGE MANAGEMENT (ISSN 0922-409X) is published six times yearly for $56.00 per year by the Society for Range Management, 1839 York Street, Denver, Colorado 80206. SECOND CLASS POSTAGE paid at Denver, Colorado. POSTMASTER: Ittim ontln journal with address change-RETURN POSTAGE GUARANTEED-to Society for Range Management, 1839 York Street, Denver, Colorado 80296.
412 Effect of fertilization date and litter removal on grassland forage produc-
tion
by Brian M. Wikeem, Reg F. Newman, and A.L. van
Ryswyk
415 Correlation of steer average daily gain with diet quality and forage phe-
nology in an improved annual grassland
by Charles A. Raguse, James G.
Morris, and Virginia N. Landry
General Interest
420 Viewpoint: Do your digits betray you or does rounding raise your reputa-
tion?
by J.L. Wheeler, L.H. Prasetyo, and H.I. Davies
421
SMART: a Simple Model to Assess Range Technology
by Richard H.
Hart
425 Justification
for grazing intensity experiments: economic analysis
by
David I. Bransby
Animal Physiology
431
Mineral dynamics in beef cattle diets from a southern mixed-grass prairie
by
W.E. Pinchak, L.W. Greene, and R.K. Heitschmidt
TECHNICAL NOTES
434 A pocket computer program for collecting forage selection frequency data
in the field
by Richard P. Cincotta
BOOK REVIEWS
437
Planning for Drought Toward a Reduction of Society Vulnerability.
Edited by Donald A. Wilhite and William E. Easterling with Deborah
A.
Wood; Las
Gramineas de Mexico, tomo ZZ.
by Alan A. Beetle, D. Man-
rique Forceck, V. Jaramillo L., M.P. Guerrero Sanchez, J. Alejandro
Miranda Sanchez, Irama Nunez Tancredi, Aurora Chimal Hernandez.
Managing Editor PETER V. JACKSON Ill
1839 York Street Denver, Colorado 80206 Edltor
PATRICIA G. SMITH
Society for Range Management 1839 York Street
Denver, Colorado 59206 (303) 355-7070 Book Rovtew Edltor GRANT A. HARRIS
Forestry and Range Management Washington State University Pullman, Washington 991644410
ASSOCIATE EDITORS DON C. ADAMS
USDA ARS
Livestock 81 Range Research Rt 1. Box3
Miles City, Montana 59301 WILL BLACKBURN
N.W. Watershed Res. Center 270 South Orchard Boise, Idaho 53705 CARLTON BRITTON
Range 8 Wildlife Mgmt Texas Tech University Lubbock, Texas 79409 TIMOTHY E. FULBRIGHT
College of Agriculture Texas A&l
POB 156. Sta. 1 Kingsville, Texas 78363
RICHARD H. HART USDA-ARS 8408 Hildreth Rd. Cheyenne, Wyoming 82009 RODNEY HEITSCHMIDT
Box 1658
Vernon, Texas 76384 PETE W. JACOBY, JR.
P.O. Box 1658 Vernon, Texas 76354 HOWARD MORTON
2Mx) E. Allen Road Tucson, Arizona 55719
BRUCE ROUNDY 325 Biological Sciences East Building, Univ. Arizona Tucson, Arizona 55721 DAVID M. SWIFT
Natural Resources Ecology Colorado State University Ft. Collins, Colorado 50523 PAUL TUELLER
Range Wildlife 5 Forestry UNR loo0 Valley Road Rena, Nevada 89512 STEVE WHISENANT
Texas ABM Univesity Dept. of Range Science
Effects of goat browsing on gambel oak communities in
northern Utah
_ROBERT A. RIGGS AND PHILIP J. URNESS
AbShCt
RcpIicated populations of 5 shrub species were monitored over a fyear period to assess community responses to intensive browsing by Spanish-type goats. Response variables included stem density, stem-size distribution skewness, stem diameter-stem production relations, and sprout abundance and weight. No species exhibited a density change. Sire distribution skewness increased only in browsed oak (Quercu.vgmnbe#iNutt.) populations. Sprout weights also increased in browsed oak populations, but declined in com- parably browsed serviceberry (Amelmtchier &flol& Nutt.) popu- lations. Tbe only other significant sprouting response was an increase in sprout numbers in browsed snowberry (Sym-
phoricatpos oreophifus Gray) populations. Relationships between
basal stem diameter and stem production of 4 species were altered by goat use. The slopes of these relations were consistently lower in browsed populations of oak and serviceberry than in adjacent control populations, indicating that browsing reduced productiv- ity, especially of large stems. Conversely, slopes of rabbitbrush
(Chrysothumnus vMd#.forus lanceolotur (Hook.) Nutt.) relations
increased in goat-browsed pastures relative to those of control populations; rabbitbrusb was avoided by goats. Similarly, big sagebrush (Art& aidmtoio wyomiugenr& Nutt.) was avoided and its stem production responded positively in communities sub- jected to goat browsing. Important cumulative effects of goat browsing included deciincs in productivity of serviceberry and oak, and an increase in that of sagebrush.
Key Words: browsing responses, stem density, size distribution skewness, sprouting response, stem-size-production relations
Control of Gambel oak on rangelands has been a long-standing interest of range managers. Improvements in cattle carrying capa- city, livestock dispersal and handling, and soil moisture retention have been attributed to oak control (Marquiss 1972, Tew 1969). Not surprisingly, most research on this topic has been motivated by a desire to enhance livestock production via increases in herbace- ous production that typically accompany oak control. Yet big game wintering on oakbrush ranges may benefit as well because oak control typically retards successional advance and increases browse availability (Kufeld 1977, 1983).
Gambel oak is deciduous and its apparent winter-time nutritive value is low compared to that of associated shrubs (Welch et al. 1983), especially nondeciduous species such as sagebrush (Kufeld et al. 1981). Yet Gambel oak is less susceptible to traditional shrub control techniques (i.e., fire, herbicides, mechanical control) than associated species (Kufeld 1983). Thus while traditional ShNb- control methods can improve browse availability, they may also lower the nutritive value of the browse base by shifting species
At the time of this research, Riggs was research assistant and Umess was associate professor, Range Science Department, Utah State University, Logan 84322. Riggs is currently wildlife biologist, Boise Cascade Corporation, Timber and and Wood Products Group, Northeast Oregon Region, P.O. Box 610, LaGrande, Ore. 97850.
Research was funded by the Utah Division of Wildlife Resources (Federal aid project W-105-R) and the Utah Agricultural Experiment Station; it is published as Journal Paper 3527, Utah Agricultural Experiment Station, Utah State University, Logan 84322.
We thank D. Sisson and D. Turner, Department of Applied Statistics, Utah State University, for assistance with expenmental design and analysis. We also thank F. Provenza and B. Dick for critical reviews of the manuscript.
Manuscript accepted 9 March 1989.
354 JOURNAL OF RANGE MANAGEMENT 42(5), September 1999
composition toward oak. Consequently, identification of man- agement strategies capable of selective oak reduction is desirable. Selective control might also enhance herbaceous species, thereby serving both wildlife and livestock interests.
Controlled browsing by domestic goats may be a viable man- agement alternative. Angora and milk-type goats have been used to control Gambel oak sprouts following mechanical treatment (Davis et al. 1975). More recently, Spanish goats have been shown to have greater potential for shrub control than either sheep or Angora goats (Warren et al. 1984), and to have dietary habits suited to selective control of Gambel oak under certain manage- ment constraints (Riggs et al. 1988). However, data concerning the effects of goats on entire oakbrush communities is lacking, despite the obvious implications that it might have for management of livestock and game range alike. In this paper we report the effects of summer-time goat use on a typical oakbrush winter range com- munity in northern Utah.
Study Area
The study site is near the town of Henefer, at the interface between Wasatch chaparral and sagebrush-grass zones (Cronquist et al. 1972). Average annual precipitation and temperature are 350 mm and 7.1° C, respectively. The experiment was conducted in a typical low-elevation oakbrush community, occurring on a deep, loamy alluvial deposit. Elevation was 1,860 m. Slope was 13% and azimuth was 295“ N. Oak stems ranged in height from a few centimeters to slightly over 2 m and the relative abundance of tall stems graded slightly from one end of the site to the other.
Methods Treatment and Response Variables
Responses to goat browsing were investigated in 6 experimental oakbrush communities that were created by subdividing a natu- rally occurring parent community into smaller units. The parent community was first divided into three, 0.4ha blocks, and each block was then subdivided into two, 0.2-ha pastures. One pasture in each block was subsequently stocked during the growing season with Spanish-type goat wethers while the other was maintained as a control pasture. Responses of each shrub species and of the herbaceous strata were then monitored annually in each of the 6 experimental units.
Stocked pastures each received, 1,340 goat-days per hectare in 1984, and 1,840 goat-days in 1985; they were rested in 1986. The treatment pastures were stocked with goats in a series of high- intensity, short-duration periods designed to maximize defoliation of Gambel oak. Additional information regarding the study site, stocking strategy, and dietary habits of the goats has been pub- lished elsewhere (Riggs et al. 1988).
The first response variable was the density of live, rooted shrub stems. Density was estimated for each shrub species during late June of each year. Stems were counted in 10 permanent 5-m* macroplots (Oldemeyer and Regelin 1980) in each pasture, and the data were compared by analysis of variance (ANOVA).
stems. The standardized skewness coefficient (gl) was used to gauge shifts in these distributions. Size was calibrated each year, in terms of the cross-sectional basal diameter (mm), on 200 randomly selected stems in each population (Cole 1963). A standardized skewness coefficient was then calculated for each sample distribu- tion, and the collection of coefficients was compared across treat- ments and years by ANOVA.
The third response variable was the relationship betwtin stem size and stem production (i.e., size-specific production); this was estimated annually for non-sprouts in each experimental popula- tion using a size-stratified, random sample of 50 rooted stems. Size was calibrated in terms of cross-sectional basal diameter (mm). Stem productivity (g/stem) was calculated as the product of each stem’s leader count and average leader weight ([stem production] q
[mean twig weight] X [twig count]). Leader weights were predicted for a systematic subsample of leaders on each sample stem using twig-diameter-weight regressions. Parameters of the relationship (i.e., slope and intercept) were analyzed in sequence for treatment effects by an analysis of covariance in which the concomitant variable was basal diameter and the dependent variable was stem production. An intercept analysis was conducted only in the absence of significant slope differences, Both variables (basal diameter, production) were log-transformed to linearize the rela- tionships for analysis.
Equations predicting size-specific stem production (Pr) were generated for experimental populations according to results of the covariate analysis. Separate equations were generated according to treatment if the covariance analysis detected differences in either slope or intercept; pasture samples were pooled to generate a common equation in the absence of any differences. Equations were generated using the log model: ln(Pr) = in(w) + bl[ln(D)]; where Pr was production per stem (g/stem), D was basal stem diameter (mm), In was the natural log function, and w and bl were intercept and slope coefficients, respectively. For the sake of brev- ity, the antilog form of the equation, Pr q b9(D)b’, with the coeffi-
cient of determination (rz), is used in this paper.
In lieu of a covariate analysis, conditional tests for production homogeneity among populations were conducted for 4 of the 5 species (serviceberry, sagebrush, rabbitbrush, and snowberry) in 1984. Differences were not expected to occur during the first year, and an abbreviated analysis was considered adequate for detecting any initial differences that may have existed among the experimen-
Table 1. Inltial botanical composltlon of experimental pastures, 19841.
tal populations. The methodology involved sampling the produc- tivity of a predominant size class of stems in each population (rather than the entire size range) and subjecting the data to a blocked ANOVA for treatment effects; production homogeneity among populations was assumed in the absence of a significant test. None of these tests yielded significant results, and initial homogeneity was assumed among the various populations of these species. Gambel oak, on the other hand, was subjected to covariate analysis in all 3 years because it was the community dominant and target of the treatment.
Sprouting responses (frequency and weight of sprouts in the production samples) were treated separately. Rooted sprouts were excluded from the covariate production analysis because their size-production relations were expected to differ from those of nonsprouts (Rumble 1987). Rooted sprouts are composed only of current annual growth (CAG) while non-sprouts of equal diameter are composed of both CAG and old growth, thus separate analyses are required.
Utilization estimates were obtained at the same time as the production estimates. Twig utilization was defined as the percen- tage of CAG removed and/ or killed by browsing. Utilized weights were predicted with the same regressions used to predict twig weights.
Herbaceous composition was estimated by ocular appraisal of basal area coverage, in 2 permanent 5dm* microplots nested in each macroplot. In addition, two l-m* circular plots were nested in each macroplot and clipped to obtain production estimates in August, 1986.
Finally, we constructed a cumulative-effects model using data for all the various response variables. Output was productivity by species (kg/ ha), generated using point estimates for density, size distributions, stem size-production relations, and sprout responses derived in the foregoing analyses. Productivity was calculated for each species, under each treatment, by: (1) weighting the density estimates by the proportion of stems in various size classes; (2) weighting the resulting histograms by the size-specific productivity predicted for stems at the midpoint of each size, after adjusting for the proportions of sprouts and non-sprouts in each class; and (3) summing these sizeclass values.
Experimental Design
A 2-factor, complete block design was used to analyze the data. Main effects were blocks, goat use (without respect to density) and
Plant taxa
Control pastures Stocked pastures
Block #1 Block #2 Block #3 Block # 1 Block #2 Block #3 Mean f S.E.f
Shrubs
Amelanchier abtifoia Artemisia tridentata Berberis repens
Chrysotha&us viscidifrows Purshia tridentata
Quercus gambelii Rosa sp.
Symphoticarpos oreophilus Graminoids
Poa pratensis other-’ Forbs*
2.7 2.4 0.0 1.8 4.3 1.0 2.0 f 0.6
3.5 10.6 2.0 5.2 0.8 1.4 4.9 f 1.5
0.2 3.4 0.0 1.3 5.2 5.0 2.5 f 1.0
23.3 18.6 32.1 17.9 13.0 12.4 19.7 f 3.1
2.5 1.5 0.0 0.8 1.9 1.3 f 0.4
36.7 23.3
2:
18.9 28.5 26.0 26.9 f 2.4
0.0 0:o 0.0 0.0 1.2 0.2 f 0.2
4.6 306:; 19.9 25.5 17.7 10.8 19.2 f 4.6
8.8 1.7 16.4 16.0 12.1 11.5 12.1 f 1.5
0.9 2.5 0.2 0.9 0.8 1.1 1.1 f 0.3
0.8 0.1 0.4 1.0 0.9 0.3 0.6 f 0.2
‘Shrub data arc average, rooted-stem density per Em* macroplot; s and forb data are average basal area covcmge (9%) per IOdm* microplot. *Differences between controls and stocked pastures were not M .gnFs Icant (~60.05). Nomenclature follows Cronquist et al. (1972). -
‘Other graminoids were Agropyron smithii, Agropyron spicatum, Bromus tectorum, Carex geyeri, Sttpo columbiana, Stipo comata, and Pea fendkriana. None of the= accountid for 21% covera& &any p&me.
‘Thirty-one forb species were recorded, but none averaged as much as 1% coverage. Species which composed as much as 1% coverage in at least one microplot included Achilko millefolium, Antennarta microphylk, Aster integrtyolius, Collinsiaparviflora, Comonaia umbellata. Erigeronpumilus. Gilia aggregata, Heltanthella unifora, and Lathyrus p~UClpOWS.
years. Blocks were a random effect; both goat use and years were fixed. The year effect was a repeated measure. This design was used for ANOVA for stem density, stem-size distributions and sprout responses. Covariate ANOVA of size-specific stem productivity simply involved adding stem diameter to the design, as the con- commitant. RUMMAGE software was used to analyze the data (Bryce 1980).
Block-randomization was used to distribute goats because we suspected that utilization might differ among pastures. We based this suspicion on the height gradient observed among oak stems; if goats were unable to reach the tallest stems, utilization of oak would vary along the height gradient. The pastures had to be randomized prior to any browsing and we elected to use the block design, rather than a completely randomized design, in order to account for a potentially height-related utilization differential. However, we observed during the browsing periods that goats defoliated all stems without regard to height; this resulted from their ability to assume a bipedal stance while feeding, which allowed them to “ride down” even the tallest stems. Therefore, the height gradient became biologically unimportant, and we view our initial block-randomization as unnecessarily restrictive (i.e., a completely randomized design would have been appropriate). We have adhered to the block-randomized design for this analysis, but caution the reader that it is likely conservative. Consequently, we have also reported some results that were visually obvious to us, but only marginally significant in the context of the block- randomized analysis.
RMlltS Utilization Levels
Sagebrush, rabbitbrush, and snowberry were consumed little by goats (Riggs et al. 1988). Sagebrush utilization was only 2.4% (SE = 0.8) for both twig and leaf material, with no differences between years. Utilization of rabbitbrush was 2.7% (SE = 0.8) and 3.4%(SE q 0.9) for twigs and leaves, respectively, and no difference occurred between years. Utilization of snowberry twigs and leaves, however, varied between years (X0.03). Twig utilization increased from 0.8% (SE q 0.8) in 1984 to 39.8% (SE = 0.1) in 1985; likewise, leaf utilization increased from 1.4% (SE = 1 .O) to 52.8% (SE q 0.2). The greater use of snowberry in 1985 apparently resulted from the greater number of animal-days applied to the stocked pastures that year.
Conversely, both serviceberry and Gambel oak were avidly con- sumed. Serviceberry browse was not abundant in the pastures and its utilization was high, despite a low occurrence in the diet (Riggs et al. 1988); utilization averaged 48.6% (SE = 3.4) and 53.3% (SE = 3.3) of twigs and leaves, respectively, with no significant difference between years (m.10). Utilization of oak fractions was lower (KO.05) in 1984 than 1985. Twig utilization was 20.0% (SE = 0.3) in 1984and 56.2% (SE ~0.3) in 1985; leafutilization was43.3%(SE q 8.1) and 64.3% (SE = 3.6) in 1984 and 1985, respectively. Composition Responses
Pasture composition did not differ in 1984 at the outset of the experiment (Table 1). ,No changes (PIO. 10) were detected in the subsequent 2 years, either in the density of shrub stems or in the basal area coverage of herbaceous species.
Dynamics of Stem-Size Distributions
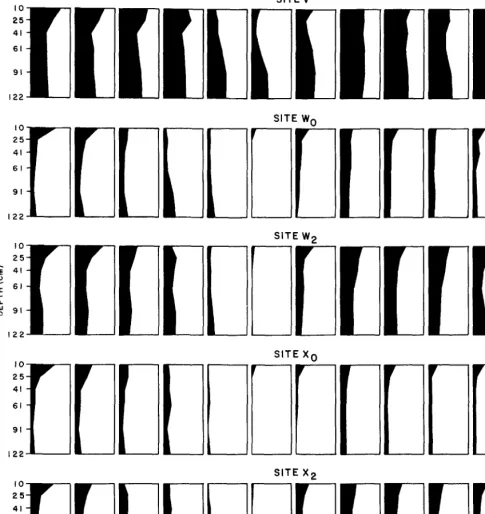
Minimum and maximum stem diameters were stable through- out the study in all populations, and skewness of size distributions shifted in only the browsed oak populations (KO.08, Fig. 1). All oak distributions were positively skewed in 1984, indicating an initial abundance of small stems relative to large ones. Skewness of all the browsed populations increased as the experiment pro- gressed while that of the control populations remained constant;
356
c
G=J 15.000 z B10,000 -
iii 5,cxx~
1
”
I
I5,OOOn
vie!!!!!
10,000 I
0
15,000 - &!!!e&dnilbwa
10.000 -
5.OcQ -
O-
60708090icoBASAL STEM DIAMETER (mm)
Fig. 1. Pooledsampledistributions of stem size in 1984 ond 1986. Only the size distribution of ook was affected by goats.
the treatment effect became significant in the third year (Fig. 2). This progressive skewing, at constant density, indicated that the relative abundance of smaller stems had increased in the popula- tion, and implied that both mortality of old stems and increased sprouting were involved. Both factors were visually obvious.
Sprout Responses
Browsing did not affect the sprouting rate of serviceberry popu- lations. Sprouts composed 74% (SE = 5.6) of the rooted service- berry stems less than 4 mm in diameter. This percentage did not differ among populations at any time during the 3-year period. However, sprout weights did differ between treatments (KO.09). Sprout dry-weights averaged 0.58 g among control populations versus 0.21 g among browsed populations (LSD.10 q 0.25).
Rabbitbrush sprouting was apparently unaffected. Rabbitbrush sprout diameters did not reach 2 mm and sprouts comprised about 66.7% (SE = 9.6) of all the rooted stems that were smaller than this diameter, regardless of treatment or year. Rabbitbrush sprouts
1964 1965 1 OS6
YEAR
Fig. 2.. Changes in the standardized skewness coeffientfor sample basal- diameter distributions of rooted oak stems, 1984-86. The vertical bar corresponds to the LSD.10 between controls (solid line) and stocked pastures (&shed line) observed in 1986.
averaged 0.35 g (SE = 0.10).
The increased skewness of stem-size distributions seen in the browsed oak populations was partially due to increased sprouting. Oak sprouts did not exceed 10 mm in diameter, and the proportion of sprouts occurring in subsamples of stems under 10 mm diameter varied significantly (x0.03) by treatment and year. Sprout numbers increased in the stocked pastures but did not change in the controls (Fig. 3). Sprouts comprised 10.7% and 10.0% of all oak stems less than 10 mm diameter in 1984 and 1985, respectively. In 1986, sprouts comprised 90.0% of the browsed-population sam-
1965
YEAR
1066
4
Fig. 3. Changes in the percentage of live, rooted, oak stems under IO mm basal diameter that were sprouts, 1984-86. The vertical bar corresponds to the LSD- between controls (solid line) and stockedpastures (dashed line) observed in 1986.
ples, but only 6.7% of the control samples. Browsing did not affect sprout weight in either 1984 or 1985 (2 = 1.26 g SE = 0.59), but a weight difference was observed in 1986 when sprouts averaged 2.90 g and 1.15 g in browsed and control populations, respectively (LSD.10 = 0.81).
Snowberry did not exhibit a sprouting response. Basal diameter of snowberry sprouts seldom reach 4 mm (P = 0.03), and browsing did not alter the frequency of sprouts under this size. However, the proportion of sprouts in the subsamples did vary between years with regard to treatment (x0.05). This proportion increased, in both browsed and control populations, from 31.7% in 1985 to 58.3% in 1986 (LSD.05 = 25.9). Dry weight of snowberry sprouts was unaffected by either browsing or year; dry weights consistently averaged 0.52 g (SE = 0.06).
Covariate Production Responses to Nonsprouts
A highly signiticant (KO.0001) relationship was observed between basal diameter and productivity of rooted serviceberry stems. Browsing had a significant effect on the slope of the rela- tionship (KO.03). Neither the main effect of year nor the treat- ment X year interaction was significant (p>o.35), indicating that the magnitude of the effect did not change between 1985 and 1986. Slope of the relation for control stems (Pr = 0.22(D)‘“7, rr = 0.70, n = 181) was more than twice that for browsed stems (Pr = 0.28(D)OB, rr = 0.32, n = 157) in both 1985 and 1986, indicating that the productivity of non-sprouts was reduced by browsing, especially that of larger stems. The relationship for browsed stems was weaker than that for controls.
Sagebrush also exhibited a highly significant (ZKO.0001) rela- tionship between basal diameter and productivity, and slope hete- rogeneity was detected between treatments in an analysis of vegeta- tive production (K0.13); as in the serviceberry analysis, neither the year effect nor the treatment X year interaction was significant. The slope of the relationship for control stems (Pr =0.09(D)‘“, rr = 0.87, n = 291) was lower than that for stems in stocked pastures (Pr = 0.13(D)‘.‘*, r2 = 0.87, n = 292); strength of the relationship was the same in both treatments. The difference in vigor of plants was clearly visible in the pastures. We concluded that avoidance of sagebrush by goats conferred a competitive advantage to this species, and magnitude of the production response increased with plant size.
We also estimated production of reproductive leaders (RPr) by sagebrush plants, but only in 1986. The size-production relation was highly significant (K0.0001), but weak (RPr =0.33(D)“.ss, rr = 0.33, n = 292). No heterogeneity of slope or intercept was detected (E30.40). Therefore, any reproductive response that may have occurred did not appear to extend beyond the presence of goats in the pastures.
Rabbitbrush populations also exhibited a highly significant stem diameter-production relationship (KO.0001). There was no slope heterogeneity between treatments without respect to years (130.35). However, there was significant heterogeneity between years without respect to treatment (KO.03); slope of the relation- ship declined significantly from 1985 to 1986 (Table 2). In addition, a treatment X year interaction was indicated (KO. 14). No slope differential was detected between treatments in 1985; in 1986, the control relationship had a lower slope than did the treatment relationship (Table 2). We concluded that a size-specific decline in stem productivity had occurred in both treatments, but the decline was less precipitous in the stocked pastures where goats had avoided this species during the previous 2 years. The difference was visually obvious in 1986.
Oak also exhibited a significant over-all relationship between stem diameter and stem production (KO.0001). Slope heteroge- neity was detected between treatments without respect to years (KO. IO), and among years without respect to treatment (KO.02).
Table 2. Comparisons
of
stem dismeter-production regression, P = Table 3. Comparisons of stem diameter-production regression, P = bP(D)bl, far rabbitbrush, 1985-86. M(D)bl, far Gambd oab, 1984-86.Adjusted
Trkzt”le”t Year bo bl rz ”
Treatment Comparisons (without respect to year)1
CO”U”k Both 0.83 0.92 0.46 256
Stocked Both 0.74 1.05 0.46 259
Year Comparisons (without respect to treatme”t)l
Both ,985 0.62 1.1sa 0.6, 264
Both ,986 0.94 0.82 b 0.36 25,
Treatment x Year Comparisons~
Controls ,985 0.65 ,.,5a 0.65 132
Stocked ,985 0.57 1.23 a 0.54 132
CO”trOls ,986 1.0, 0.7, b 0.3, 124
stocked ,986 0.88 0.92 c 0.42 127
‘Difkre”cc bS,WSS” s,opss is not signiIicant.
~““li!e btterE denote a difference between slops @Ql.o*,. 3”“li!e lC”Crr denote differences among s,oas (psc,,4).
TP%.t”le”t
Adjusted
w b, r2 ”
Treatment Comparisons (without respect to year)’
CO”tr”,S all 0.25 ,.64a
Browsed a,, 1.32 0.64 b
Year Comparisons (without respect t” trcatment)~
Both 1984 0.40 1.41 a
Both ,985 0.40 1.17 b
Bath ,986 0.34 ,.40a
Treatment X Year Comparisons~
Controls ,984 0.37 1.46
Controls ,985 0.21 1.57
Controls 1986 0.22 1.85
Browsed ,984 0.43 1.36
Browsed ,985 0.93 0.68
Browsed 1986 0.69 0.76
0.78 424 0.22 375
0.77 272 0.40 283 0.33 244
0.75 134
0.80 148
0.88 142
0.81 138
0.2, 135
0.21 102
The treatment effect was obvious (Fie. 41. However, it was not _ ,I a”a,yas.
visually apparent until 1985, sum_ ezestinz that tl he interaction was a oak stems with only 1 season of browsing, even at the heavy
real phenomenon despite the low st&stical significance. We felt stocking level we employed. In either case, timing of the browsing
effect may be a trivial point from a practical perspective if one
that the low significance might well have resulted from the conser-
vative experimental design (which was unnecessarily restrictive).
Consequently, Table 3 displays the regression coefficients at the
interaction level, as well as at the level of the main effects. Compar-
ison of the regression coefficients at the level of the main effects
indicates that the browsing effect was consistent throughout the
study, and that slopes dropped in 1985 (regardless of treatment),
and then rebounded in 1986 (regardless of treatment). In contrast,
comparison ofthe regression coefficients at the level of the interac-
tion suggests that there was not a great disparity of regression
coefficients between treatments until after 1984. The statistical
analysis forces one to conclude that the tint interpretation is the
appropriate one. However, failure to detect the interaction simply
may have resulted from the conservative, block-randomized analy-
sis’. Therefore, we caution against any expectation of depressing
considers that imposing goat browsing for only one year seems
unlikely in most operational settings. The important point is that
repeated browsing will certainly reduce oak vigor.
Snowberrystemsalso exhibited a highlysigniticantrelationship
between basaldiameterand production (KO.OOOl), but neither of
its parameters was affected by treatment, year, or their interaction
(K0.35). Consequently, thedatawere pooled over treatmentsand
years to generate a single regression (Pr = 0.50(D)‘22, r2 = 0.54, n =
504). We concluded that productivity of non-sprouts was not
affected to a significant extent by the browsing treatment or by
differences in growing conditions between years.
Cumulative Effects on Shrubs
Reduced productivity of mature serviceberry stems, coupled
with reduced sprout vigor, lowered productivity of browsed serv-
iceberry populations. Productivity of model control population
was 26 kg/ha versus 4 kg/ha for a browsed population (Fig. 5).
In the case of Gambel oak, all variables responded to the intense
browsing, and the net effect was a severe (78%) reduction in pro-
ductivity of populations (Fig. 5). Model output for control popula-
tionswas754kg/ha, withonly0.4%ofthisproduced bysprouts. In
sharp contmst, browsed populations produced only 166 kg/ha,
and 61% of this was sprouts. This comparison was calculated using
the main-effect differences in Table 3, rather than the interaction-
level differences; it may be conservative.
Sagebrush was the only shrub to show a strong positive
response. Neither its density nor its size distribution was changed
by goats, but the increase in stem production moved population
productivity markedly upward. Model output for combined vege-
tative and reproductive production was 236 kg/ha under control
conditions, versus 494 kg/ha with goats (Fig. 5). The difference
between treatments was obvious.
Productivity of rabbitbrush and snowberry populations was not
markedly affected. Rabbitbrush productivity was 132 kg/ha in
1984. Neitherthecontrolnorthe treatmentvaluesdiffered much in
1986 (106 kg/ha and 128 kg/ha, respectively). Model production
for snowberry was 134 kg/ha in both treatments.
Herbaceous Production
Clippingdata suggested that understory production increased in
the stocked pastures, relative to the controls. However, statistical
llo-
&efcagxnbelii
90. A
ID 20 3D 40 50 60 70 80 90 IDD BASAL STEM DIAMETER (mm)
Fig. 5. Net effect of goots on productivity of shrub populations (kg/ho), 1986. Cuwesplotproductivity of varioussize cla.ssesforcontroIpopuio- tions (solid lines) versus populations in goot-stocked postures (broken lines). Areas undemeoth curves reflect productivity of modelpopulations.
evidence was weak. In 1986, graminoid production averaged 420 kg/ ha (SE = 45) across control pastures, compared to 660 kg/ ha (SE = 43) across stocked pastures, but the difference was not significant (PC0.6). Likewise, forb production was only 90 kg/ ha (SE = 8) across the controls versus 110 kg/ ha (SE = 8) across stocked pastures @X.8). The pooled estimate for graminoids and forbs was 510 kg/ ha (SE = 49) and 780 kg/ha (SE = 48) in controls and stocked pastures, respectively, with, no significant difference. Herbage density varies spatially in oakbrush because distribu- tion of the various shrub species is clumped. Lack of statistical significance likely resulted from randomly locating the plots and the small number of plots (n = 20 per pasture). The treatment effect was significant when grass and forb data were pooled across pas- tures (i.e., n = 60 plots per treatment without respect to block replication), and the means compared on the basis of the pooled variance (LSD0.m = 5 1). An increase in herbaceous production is expected following uniform shrub control in oakbrush communi- ties (Marquiss 1972, Moinat 1956, Price 1938). Likewise, a positive herbaceous response should be expected following a partial shrub reduction, but its spatial variability should be greater than that following a uniform shrub removal. We concluded that herbage production had increased in the goat-browsed pastures. Increased sampling may have detected the treatment effect, but the sampling level required may have been prohibitive without prior stratifica- tion of plots according to shrub composition.
Discussion
Both serviceberry and Gambcl oak were reduced by browsing in
JOURNAL OF RANGE MANAGEMENT 42(5), September 1989
this experiment, and by utilization levels that were not as extreme as those required to harm these species in earlier clipping studies (Young and Payne 1948, Shepherd 1971). The apparently lower resilience to goat browsing might be attributed to a timing differ- ence between ungulate browsing and artificial clipping. Clipping is generally imposed between mid-summer and early fall, after plants have been afforded some opportunity to store nutrients. In con- trast, we initiated goat browsing in late spring and repeated it during the course of the growing season (Riggs et al. 1988); thus the opportunity to store nutrients may have been reduced, and resil- ience reduced accordingly (Engle et al. 1983). Stem damage also resulted from animals gnawing on bark below the point of current annual growth, and this probably lowered stem vigor as well.
Positive or neutral responses observed for sagebrush, green rabbitbrush, and snowberry contrasted sharply with the largely negative responses which Kufeld (1983) reported for these species following chaining, spraying or burning. However, minor compo- nents of the community that are palatable (e.g., serviceberry) may be negatively impacted. Results in other areas will be affected by stocking strategy, species composition, and relative palatability of community components.
Long-term effects are yet to be assessed, and rate of return to prebrowsed conditions will be of particular interest. The short- term results presented here suggest increased herbaceous produc- tion for other livestock, and goat-induced changes in the browse base may well be beneficial to big game wintering on such com- munities. Sagebrush is higher in crude protein and dry matter digestibility, and lower in indigestible fiber, than associated decid- uous species in winter (Kufeld et al. 1981, Welch 1983, Welch et al. 1983). Thus such treatment may benefit wintering ungulates, assuming that they would adjust their dietary behavior (botanical composition, dry matter intake) so as to take advantage of increased sagebrush availability.
Several response variables were monitored in this experiment, but these were not equally sensitive to goats. Stem density was insensitive in this study despite a rather intense sampling scheme. Similarly, skewness of stem-size distributions did not respond except in the case of oak, which was severely browsed. Stem diameter-production relationships were more sensitive than either density or size-distribution of populations in thii experiment. Whether this holds in studies concerned with more moderate treatments and/or long-term successional dynamics remains to be seen.
Predictive power of the stem diameter-production relations, as reflected by rr values, varied among species and may be expected to vary with treatment severity as well. The relationship was strong for species that had fairly wide ranges of basal stem diameter and stem production (e.g., sagebrush, serviceberry, and oak). In con- trast, rabbitbrush and snowberry populations exhibited limited ranges for these variables, and weaker regression relationships. Little difference in precision was observed between control popula- tions and those that were only moderately stressed or enhanced (e.g., rabbitbrush, snowberry, and sagebrush), but precision declined markedly if stem damage was severe (e.g., serviceberry and oak). High short-term variance may not persist over the long term, and it may not be expected to appear at all in long-term studies concerned with more subtle browsing treatments.
We employed the standardized skewness coefficient to detect size-distribution changes in this study, but it may not be an appropriate response variable in other situations. In this study, experimental populations were demarcated via subdivision of a single parent community. Neither minimum nor maximum stem sizes varied among pastures initially, and no changes in these parameters were detected during the course of the experiment. Therefore, the range and location of size distributions were con-
stant, and only changes in shape of the distributions were a con- cern. Skewness is a shape statistic, but it is insensitive to differences in scale or location among distributions. Location differences, in particular, are apt to occur in field experiments that employ exper- imental designs based on site characteristics or stand history. For example, a shrub population on a ridge might have a very different stem-size range than another population in an adjacent swale. Likewise, shrub stands of different ages might be expected to have different size ranges. Also, locational shift may be more apt to develop in long-term experiments than in short-term studies like this one. Where locational shift does occur, the coefficient of variation, or the gini coefficient, may be more appropriate response variables than skewness (J3endel et al. 1989).
Literature Cited
Anderson, V.L. 1970. Restriction errors for linear models (an aid to develop models for designed experiments). Biometrics 26:255-268. Bendel, R.B., S.S. Higgins, J.E. Teberg, and D.A. Pyke. 1989. Comparison
of skewness coefficient, coefficient of variation, and gini coefficient as measures of inequality. Gecologia (Berlin). In Press.
Bryce, G.R. 1980. Data analysis in Rummage II. Dep. Stat., Brigham Young Univ., Provo, Utah.
Cole, G. 1963. Range survey guide. Grand Teton Natur. Hist. Assoc., Moose, Wyo.
Cronquist, A., A.H. Holmgren, N.H. Holmgrtn, and J.L. Reveal. 1972. Intermount. Flora, Vol. 1. Hafner Publ. Co.
Davis, G.G., L.E. Bartel, and C.W. Cook. 1975. Control of Gambel oak sprouts by goats. J. Range Manage. 28:216-218.
Engle, D.M., C.D. Bonham, and L.E. Bartel. 1983. Ecological characteris- tics and control of Gambel oak. J. Range Manage. 36363-365. Kufeld, R.C. 1977. Improving Gambel oak ranges for elk and mule deer by
spraying with 2,4,5-TP. J. Range Manage. 3053-57.
Kufeld, RX. 1983. Responses of elk, mule deer, cattle, and vegetation to burning, spraying, and chaining of Gambel oak rangeland. Colorado Div. Wildl. Tech. Pub. 34.
Kufeld, R.C., M. Stevens, and D.C. Bowden. 1981. Winter variation in nutrient and fiber content and in vitro digestibility of Gambel oak
(Quercusgambelii)and big sagebrush (Artemisia trideniara) from diver-
sified sites in Colorado. J. Range Manage. 34:149-151.
Marquiss, R.W. 1972. Soil moisture, forage, and beef production benefits from Gambel oakcontrol in southwestern Colorado. J. Range Manage. 25:146-150.
Moinat, A.D. 1956. Comparative yields of herbage from oak scrub and interspersed grasslands in Colorado. Ecology 37:852-854.
Oldemeyer, J.L., and W.L. RegeUn. 1980. Comparison of 9 methods for estimating density of shrubs and saplings in Alaska. J. Wildl. Manage. 44662-666.
Price, R. 1938. Artificial reseeding on oak-brush ranges in central Utah. USDA Circ. 458.
Riggs, R.A., P.J. Umess, and T.A. Hall. 1988. Diets and weight gains of Spanish goats used to control Gambel oak. Small Ruminant Res. I:259271.
Rumble, M.A. 1987. Using twig diameters to estimate browse utilization on
three shrub species in southeastern Montana. p. 172-175 In: Proc-
Symp. on Plant-Herbivore Interactions. USDA Forest Serv. Gen. Tech. Rep.-INT-222.
Shepherd, H.R. 1971. Effects of clipping on key browse species in south- western Colorado. Colo. Div. Game, Fish and Parks Tech. Pub. 28. Tew, R.K. 1969. Converting Gambel oak sites to grass reduces soil-
moisture depletion. USDA Forest Serv. Res. Note INT-104.
Warren, L.E.,D.N. Ueckert, end J.M. Shelton. 1984. Comparative diets of Rambouillet, Barbado, and Karakul sheep and Spanish and Angora goats. J. Range Manage. 37:172-180.
Welch, B.L. 1983. Big sagebrush: nutrition, selection, and controversey. p.
21-33. In: K.L. Johnson (ed.). Proc. First Utah Shrub Ecology Work-
shop. Utah State University, Logan.
Welch, B.L., S.B. Monsen, and N.L. Shaw. 1983. Nutritive value of ante- lope and desert bitterbrush, Stansbury cliffrose, and apache-plume. p. 173-185. In: Proc. Res. and Manage. of Bitterbrush and Cliffrose in Western North America. USDA Forest Serv. Gen. Tech. Rep. INT-152. Young, V.A., end G.F. Payne. 1948. Utilization of key browse species in relation to proper grazing practices in cut-over western white pine lands in northern Idaho. J. Forest. 46z35-40.
New
for 1989!
Covers all aspects of range management, including
current and past research-
Range Management:
Principles and Practices
This basic text provides full coverage of range management: history, policy on fed- eral lands, plant ecology, grazing and wildlife management, range nutrition, prob
lems in developing countries and range
improvement.
Practical in approach and
targeted to the needs of
today’s range managers
l Uses current and past publications
Jerry L. Holechek, Rex D. Pieper, and
Carlton H. Herbel,
all of New Mexico State Universityand scientific reports as a foundation for concepts presented
Presents economic and environmen- tal consequences of range manage- ment practices
Discusses grazing methods and sup- plemental feeding of range livestock Shows how to set stocking rates Includes 135 figures and 90 tables to illustrate various concepts
Prentice Hall
Book Distribution Center
Rt. 59 at Brookhill Drive
West Niack, NY 10995-9901
(201) 767-5937
Price
$48/bard
Name
Address
Post/Zip Code
Observations on white-tailed deer and habitat response to
livestock grazing in south Texas
WILL E. COHEN, D. LYNN DRAWE, FRED C. BRYANT, AND LISA C. BRADLEY
Abstract
Since short duration graxing (SDG) was introduced to Texas, concern for white-tailed deer (Odocoileus viqhh) has mrgni- fied because they are a species of major economic importance to ranchers. Tbe objective of this study was to observe the effects of SDC and continuous yearlong grazing (CC) on home ranges and movement indices of female deer, and on forage availability. The study was conducted on the Rob and Ressie Welder Wildlife Refuge, near Sinton, Texas. The study area included a lO-pasture SDG cell and a CC pasture, each stocked at 2.8
ha/auy.
Cattle grazed each SDG paddock 2 to 8 days; paddocks were rested 32 to 47 days. A total of 3,861 radio-fixes from 11 does was collected over an 11-month study period In 1983. Monthly and annual home ranges of does were similar (p>o.OS) between SDG (207 ha) and CG (229 ha). However, white-tailed deer traveled 3% more (X0.05) between fixes in SDG (449 m) than in CC (332 m) from May to August, a time of greatest physiological and nutritional stress for female deer in south Texas. Also, does avoided (PCO.05) cattle during 2 cycles of the SDG rotation. The primary trend observedwas
for the deer under SDG to avoid cattle concentra- tions by alternating between preferred habitats rather than a pre- dictable paddock-to-paddock movement. In general, there were few dlfferencea in total grass and forb cover between SDG and CG. However, several forage species important to deer were less fre- quent (X0.05) under SDG than CG.Key Words: continuous graxing, home range, movement indices,
Odocoikus vlginianus, radio telemetry, short duration grazing Over the last 3040 years, dramatic changes have taken place in Texas grazing management. Initially, continuous grazing (CG), where animals dictated their own patterns of use, was most com- mon. In the 1950’s and 1960’s, those at the forefront in grazing management in Texas shifted from continuous grazing to multi- herd, multi-pasture management programs such as the Merrill 3-herd, 4-pasture regimen (Bryant et al. 1982). By 1961, a l-herd, multi-pasture approach to non-selective grazing was introduced (Howell 1978). This approach reached Texas in the late 1960’s with the high-intensity, low-frequency (HILF) regimen, a variation of nonselective grazing (Acocks 1%6). Short duration grazing (SDG), requiring shorter grazing periods, shorter rest periods, and more grazing cycles per year than HILF (Bryant et al. 1982), emerged in the mid- to late 1970’s. Generally, SDG has grazing periods of 7 days or less, rest periods from 30 to 60 days, and grazing cycles short enough to allow 6 or more rotations per year (Savory 1979). Livestock, vegetation, and soil responses to SDG in Texas are well documented (Heitschmidt et al. 1982a, 1982b, 1982~); how- ever, data on white-tailed deer(0docoileu.r virginianus) response to Authors are research assistant, Range Science Department, Utah State University, Logan 84322; assistant director, Welder Wildlife Foundation, PO Drawer 1400, Sinton, Tex. 78387; and professor and technician, Dept. of Range and Wildlife Manapment, Texas Tech University, Lubbock 79409. At the time of the research, the senior author was research assistant, Dept. of Range and Wildlife Management, Texas Tech University, Lubbock.
Research was funded by the Rob and Ressie Welder Wildlife Foundation, Simon, Tex., as WWF Contribution No. 333. This is Technical Article T-9-520 of the College of Agricultural Sciences, Texas Tech University. Authors would like to thank D. Westcr and L. False for assistance in statistical and telemetry analyses, respectively.
Manuscript accepted 23 January 1989.
JOURNAL OF RANGE MANAGEMENT 42(5), September 1989
SDG are relatively few. Guynn and White (1984) found no differ- ence in deer densities between SDG and a 3-herd, 4-pasture grazing regimen.
We compared home range sizes and movement indices of adult female white-tailed deer between a SDG and a CG pasture; evalu- ated deer locations relative to cattle rotation through the SDG cell; and compared vegetation responses between SDG and CG.
Study
Area
The study was conducted on the Rob and Bessie Welder Wildlife Foundation Refuge near Sinton, Texas. The refuge comprises 3,157 ha of native rangeland adjacent to the Aransas River in San Patricia County. It is located in the Coastal Bend region, a transi- tional zone between the Gulf Prairies and Marshes and the South Texas Plains (Gould 1975).
Prior grazing history of the SDG site was a HILF system stocked at a moderate rate of 5.7 ha/animal unit year (auy) for 8 years, while the CG pasture was continuously grazed at a stocking rate of 5.7 ha/auy for 8 years (Drawe and Cox 1978). In 1982, SDG was initiated and stocking was increased to 2.8 ha/ auy; the CG pasture was maintained under continuous yearlong grazing, but at the identical stocking rate (2.8 ha/auy) of SDG.
t N
I
18 12
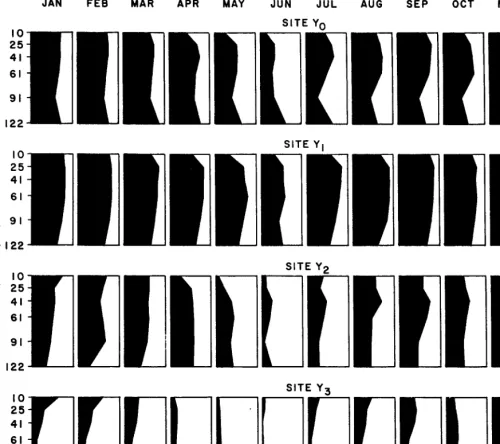
Fig. 1. The short-duration grazing (SDG) cell (Locations I-IO), continu- ous grazing (CC) pasture (Location II). and other areas of female white-tailed deer use (Locations 12-18). l = tracking station location. Grazing rotations on the SDG cell began in Location 10 andproceeded clockwise.
The SDG cell consisted of 219 ha subdivided into 10 equal-sized paddocks (Fig. 1). Water, salt, and supplemental feed were located in the cell center, but livestock also had access to water from the Aransas river and Moody Creek, which bordered the SDG cell on the west and north. Each SDG paddock was grazed from 2 to 8 days and rested 32 to 47 days, depending on vegetation response.
Table 1. Mean monthiy 95% ellipse home rangea (ha), beeed on monthly activity centers, of fern& deer under a short duration end contbmoua grazing on tbe Welder Wiidiife Refuge, 1983.
Grazing system
SDG X’
SE n2
CG x
SE n
Month
Feb Mar APT May Jun Jul Aug SeP ckt Nov Dee
419 316 175 186 233 151 193 162 92 143
14 5 13 44 115 68 15 20 37
323 d
3 3 4 3 4 4 3 2 2
545 179 109 137 100 145 158 160 221
55 66 152 63 21 37 37 1 33 26 74
5 6 5 3 5 3 3 2 4 3 4
lMeam within montha were not significantly(J70.10) different. *n = number of deer.
The 253-ha CG pasture had water, salt, and feeding facilities of fiies for that month. Means were compared using a one-way
available at 2 locations. ANOVA.
Methods
Deer Response to Cattle RotationDeer Home Range and Movement Indices
Radio telemetry was used to monitor white-tailed deer home ranges and movements in the SDG cell and CG pasture. In the winter of 1982-83, drop nets were used to capture 8 and 10 female deer in the SDG cell and CG pasture, respectively. Deer were fitted with radio collars and cattle ear tags, and weights and ages were recorded. After deer losses from death or movement off the area, sufficient data for analysis were obtained on 6 adult female deer in the SDG cell and 5 adult female deer in the CG pasture.
Deer were monitored from 6 February to 31 December 1983 using a null radio telemetry system (Hallberg et al. 1974). Each deer was located from 3 permanent tracking stations, 4 times/day (dawn, noon, dusk, 2300 hours), for 5 consecutive days. Each 5day sampling period was separated by 5 days of no tracking, resulting in approximately 60 fiies per month for each deer.
Deer response to movement of the cattle herd under SDG was determined based on deer distribution frequency tables comparing deer locations relative to the paddock cattle occupied within each complete grazing cycle. The independent variable in the frequency distribution tables was cattle location; dependent variables were potential deer locations and presence/absence of deer in any 1 of 18 potential locations, both inside and outside the SDG cell (Fig. 1). A G-test was used to determine if deer significantly (a = 0.05) responded to cattle during the rotation by testing for homogeneity of deer frequency distributions among cattle locations (Kullback
1959).
Deer Habitat
Triangulation of 3 azimuths was used to plot locations for each animal. Accuracy of the telemetry system was estimated as f2O. A location was deemed unreliable and excluded from data analysis if the area of the error polygon (Springer 1979) was 11.3 ha. A total of 3,861 radio-fixes were used in analysis. Mean size of all accept- able error polygons was 0.2 ha. All reliable fixes were within 1.6 km of their respective tracking stations.
Vegetative cover and frequency were monitored monthly on the SDG cell and CG pasture. Only those grass and forb species which comprised 2Tc or more of deer diets on the Welder Wildlife Refuge (Kie et al. 1980) were measured. Woody vegetation was not sampled because of its low occurrence in deer diets (Chamrad and Box 1%8, Kie et al. 1980).
Monthly home ranges were determined by the 95% ellipse tech- nique (Jennrich and Turner 1%9). A one-way analysis of variance was used to test for differences between home range sizes of deer with activity centers (Hayne 1949) in the SDG cell or the CG pasture.
Cover and frequency were measured using six 0. lo-m2 rectangu- lar quadrats placed at random intervals along each of 10 random transects in each grazing treatment. Cover was estimated, to the nearest 170, by species by quadrat (Daubenmire 1959). Mean cover was calculated by month and compared between treatments using a one-way ANOVA. Frequency of occurrence was calculated monthly by dividing the number of quadrats containing a particu- lar species by the total number of quadrats. Chi-square analysis was used to compare species frequency between SDG and CG. To compare relative movements of deer within the SDG cell and
CG pasture, deer fixes were plotted on a map overlay of the study area. Movement indices for individual deer were determined by summing distances between successive fiies in each 5day sample period. Monthly means were computed for each deer within a grazing treatment by summing distance data across each S-day sampling period within a month and dividing by the total number
Because of the size and nature of this experiment, the SDG and CG programs could not be replicated. Therefore, animal and vege- tational variances within treatments were used for analyses. This approach is considered valid when time and cost preclude replica- tion of a large experiment (Hurlbert 1984, Guthery 1987).
Table 2. Mean movement indices (m) for femaie deer captured in the short duration grazing ceil end the continuously grazed peeture on the Welder Wildlife Refuge, 1983.
Grazing system
SDG X’
SE d
CG x
SE n Feb 51% 26 113 461a 2:; Mar 582a 38 240 663a APr 556a 17 235 589a 2::
May Jun
465a 406a
14 34
206 174
3%b 279b
12 30
279 214
Month Jul 398a 35 128 274b 33 147 AniX 525a 44 261 380b 41 229 ScP 435a 47 193 332a 49 182 Get 395a 36 178 374a 39 150
Nov Dee
30ia 426a
17 54
163 181
382b 412a
19 62
134 138
Weans within months were not significantly (DO.05) different. 2n = number of fixes.