Image Information Mining System Evaluation Using
Information-Theoretic Measures
Herbert Daschiel
German Aerospace Center (DLR), Remote Sensing Technology Institute (IMF), Oberpfaffenhofen, 82230 Wessling, Germany Email:[email protected]
Mihai Datcu
German Aerospace Center (DLR), Remote Sensing Technology Institute (IMF), Oberpfaffenhofen, 82230 Wessling, Germany Email:[email protected]
Received 18 December 2003; Revised 2 September 2004
During the last decade, the exponential increase of multimedia and remote sensing image archives, the fast expansion of the world wide web, and the high diversity of users have yielded concepts and systems for successful content-based image retrieval and image information mining. Image data information systems require both database and visual capabilities, but there is a gap between these systems. Database systems usually do not deal with multidimensional pictorial structures and vision systems do not provide database query functions. In terms of these points, the evaluation of content-based image retrieval systems became a focus of research interest. One can find several system evaluation approaches in literature, however, only few of them go beyond precision-recall graphs and do not allow a detailed evaluation of an interactive image retrieval system. Apart from the existing evaluation methodologies, we aim at the overall validation of our knowledge-driven content-based image information mining system. In this paper, an evaluation approach is demonstrated that is based on information-theoretic quantities to determine the information flow between system levels of different semantic abstraction and to analyze human-computer interactions.
Keywords and phrases:image information mining, CBIR, evaluation, information theory, human-computer interaction.
1. INTRODUCTION
In recent years, the growth of data collected and stored in archives and the access via the world wide web has greatly exceeded our ability to significantly extract user-relevant in-formation from the data. This has resulted in combined ef-forts to develop new methods and concepts to manage large volumes of data: content-based image retrieval(CBIR) [1], data mining [2], knowledge discovery in databases [3], and information visualization. A broad range of techniques was developed to deal either with particular data types, such as text and numerical records, and also with heterogenous data types, for example, combining video and sound. But one of the most complex tasks still remains: the access of image in-formation. Image retrieval systems require both database and machine vision capabilities, but a gap exists between these systems. Until recently, standard databases did not deal with multidimensional pictorial structures and computer vision pattern recognition systems did not provide database query capabilities. Since the size and the information content of imagery keeps increasing, particularly in the remote sensing domain, many new applications in content-based image re-trieval are closer to computer vision and require the
knowl-edge and understanding of complicated spatial and struc-tural characteristics among image objects.
As in other fields, however, further development in image information mining depends on the capability to carefully evaluate the image retrieval and image understanding func-tions and methods. Such an evaluation should include the technical (objective) quality of a system as well as user-related (subjective) concepts. The basic problem in CBIR perfor-mance evaluation is the lack of standardization: defining a common image database and relevance judgments. One can already find a considerable literature on evaluating content-based image retrieval systems [4]. Most of the evaluation ap-proaches are based on query by image example and “rele-vant” versus “nonrele“rele-vant” classes of images. They mainly stay on the level of precision-recall graphs and only validate the image retrieval system function. A work very close to our system validation approach is described by Jermyn et al. [5] where a retrieval system that is regarded to consist of diff er-ent semantic levels is analyzed.
technical considerations in extracting the information con-tent, the information quality, and system complexity. The second category is based on subjective concepts and includes relevance feedback, user satisfaction, and semantic and semi-otic confusions. In [6], we describe an algorithmic evalua-tion protocol that measures the (objective) quality of seman-tic cover-types, identifies the user’s (subjective) degree of sat-isfaction, and compares the two reports. In this paper, how-ever, we restrict ourselves to the analysis of the information flow between different levels of our system, namely “image space,” “content-index space,” and “semantic space.” Addi-tionally, we include the user as an inherent part of the re-trieval loop and analyze the communication between user and system.
The paper is organized as follows. InSection 2we present the concept that is behind our knowledge-driven image in-formation mining (KIM)1 system of hierarchical Bayesian representation of image content. Additionally, the mining system is briefly illuminated from the communication chan-nel view.Section 3introduces information-theoretic quan-tities and inSection 4they are applied to determine the in-formation between different levels of semantic abstraction in the system. Before we conclude the paper inSection 6, we will analyze the information content of human-computer inter-actions as presented inSection 5.
2. KNOWLEDGE-DRIVEN IMAGE
INFORMATION MINING
In order to build a system that is free of the application speci-ficity and to enable its open use in almost any scenario, we start from an application-free hierarchical modeling of the image content as demonstrated inFigure 1. The applied con-cept of information representation on hierarchical levels of different semantic abstraction is based on a 5-level Bayesian learning model [2,7].
To extract primitive image features (level 1) from the data
D (level 0), we apply various stochastic signal models M. These models are given as parametric data modelsp(D|θ,M) and assign the probability to a given realization of the im-age dataDfor a particular value of the parameter vectorθ. The process of information extraction is realized by the max-imum a-posteriori estimate of the parameter vector.
The Bayesian formalism is applied to find the most ev-ident model given some data, in contrast to the model that best describes the data, which will always be the most com-plex one. Therefore, we introduce the next level of semantics and call these features of the features metafeatures (level 2).
Based on the features on level 1 and the metafeatures on level 2, we derive a set of signal classes ωi describing
char-1KIM was successfully implemented and tested under ESA contract. It aimed at the generation of a prototype system to rapidly support users in gathering relevant information from remote sensing image archives. The tool should further manage and add value to the huge amounts of histor-ically and newly acquired satellite datasets. KIM can be accessed by everyone via internet athttp://www.acsys.it:8080/kim.
acteristic groups of points in the parameter spaces of the different modelsM. This vocabulary of characteristic signal classes should be valid across all images (to avoid the time-consuming calculation of similarity functions) and should reject existing structures in the different feature spaces of the data. The individual elements of this vocabulary consti-tute the classesωiat the image classification (level 3). They are obtained by unsupervised clustering of the entire set of data points (features and metafeatures) of the complete im-age archive. We perform the unsupervised clustering using a dyadick-means algorithm with a predefined number of clus-ters depending on the size of the archive. The approach is very similar to vector quantization and proved to be suffi -cient in practical experiments.
Levels 1 to 3 of the hierarchical modeling describe the image data D at level 0 in a completely unsupervised and application-free way. Based on this objective characteriza-tion, the users interestsLν(level 4), that is, semantic interpre-tations of the image content, are linked to the signal classesωi
by probabilities p(ωi|Lν). The information at level 4 can be interactively defined by users with a learning paradigm [2].
After presenting the basic concept of the information mining system of hierarchical image content modeling, we point out the system characteristics from the communica-tion channel point of view. Therefore, the image data at the lowest level in the hierarchical abstraction of image content is considered as a message transmitted by an imperfect com-munication channel as 2D signals to users. The difficulty in understanding the received image information in form of symbols and semantics in a certain semiotic context, and in-ferring about the original image causes the problem of un-supervised image content modeling. Through the hierarchi-cal image content characterization, the image retrieval sys-tem can be viewed as a composed communication chan-nel. The imperfect nature of the system in combination with the well-known statement of information theory, which says that data processing cannot increase information, entails that each level in the hierarchical scheme is associated with a cer-tain loss of information. The accuracy of communication, for example, accessing a target image or a category of images as exploration results, depends on the assumed levels of image modeling.
In this paper, we deal with the measuring of infor-mation (association) between different system levels using information-theoretic quantities. Before we calculate these system performance measurements, we will specify the ap-plied measures in the following section.
3. MEASURES OF INFORMATION
D . ..
M=tex
M=sp
θtex,4 θsp,7
1
0
0 1
1
0
0 1
θtex,3 θsp,4 p(D|θM, M)
Unsupervised clustering Unsupervised clustering
θsp,7
θtex,4
θsp,4
θtex,3 1
0
0 1
1
0
0 1
p(θM|,ωM,i)
. .. . ..
ωsp,1 ωsp,2 ωsp,3 . . .
ωtex,1 ωtex,2 ωtex,3 . . .
ωsp,1ωtex,1 ωsp,1ωtex,2 ωsp,1ωtex,3 ωsp,2ωtex,4 ωsp,3ωtex,4
. . .
p(ωi|Lν) Sea Cloud Lake Grassland River City
. . .
Level 0:D image data
Level 1,2:θ image and metafeatures
Level 3:ωi unsupervised image
classification
Level 4:Lν user–defined semantics
Figure1: Hierarchical modeling of image content. First, primitive featuresθ(level 1) and metafeatures (level 2) are extracted from image dataD(level 0) based on different parametric signal modelsM, for example, spectral (sp) and texture (tex) at a certain scale. Through an unsupervised clustering across all images in the archive, we derive a vocabulary of significant signal classesωias content-index. With simple Bayesian networks we link user-defined cover-type labelsLν(level 4) to the content-index by probabilitiesp(ωi|Lν).
3.1. Shannon’s measure of information
Shannon and Wiener suggested the following measure of en-tropy [8] contained in a random variableXwith its proba-bility mass functionp(x) as
H(X)= −
x p
(x) logp(x). (1)
The entropyH(X) is the uncertainty of a single random vari-able. Further, conditional entropy can be defined, that is the entropy of a random variable given another random variable. This reduction in uncertainty due to another random vari-able is called mutual information. For two random varivari-ables
XandYthis reduction is
I(X;Y)=H(X)−H(X|Y)
=
x,y
p(x,y) log p(x,y)
p(x)p(y).
(2)
The mutual informationI(·) indicates how much informa-tion the random variableYhas about another random vari-ableX. If the observation ofXis done under very noisy con-ditions, for instance, the variablesXandYwill be statistically independent. No “information” aboutXwill be recognized inYandI(X;Y)=0.
Until now we have considered the correlation between two random variablesXandYmodeled by the causality
X−→Y. (3)
The causality betweenXandYis also said to form a Markov chain in the orderX→Yif the conditional distribution ofY
only depends onX. With the more general causality
U−→X−→Y−→V, (4)
described by the joint probability distribution
p(u,x,y,v)=p(v|y)p(y|x)p(x|u)p(u), (5)
the following inequality (data processing theorem) can be obtained:
I(U;V)≤I(X;Y). (6)
This equation states that data processing never increases in-formation, or, no clever manipulation of the data can im-prove the inferences that can be made from the data. To make (6) more evident, we can interprete the model as the causal-ity between different levels of semantic abstraction in the hi-erarchical image content representation implemented in the mining system: image data (U), extracted primitive image at-tributes (X), content-index (Y), and finally the semantic in-terpretation of the image content by the user (V).
3.2. Kullback-Leibler divergence
Kullback-Leibler divergence is a generalization of Shannon’s measure of information. The divergence is a function of two probability mass functions p(x) and q(x) that potentially characterize the same random variableX:
D(p;q)=
x p(x) log p(x)
We want to mention that the divergence is nothing else but the Shannon measure of uncertainty for a random variableX ifq(x) is a uniform probability mass function. Thus, Shan-non’s entropy can be interpreted as the amount of informa-tion in a modelp(x) ofXcompared to the maximum incer-titude model—the uniform distribution. The uniform distri-bution is the one with maximum entropy.
4. INFORMATION BETWEEN DIFFERENT SYSTEM LEVELS
In the last section, we summarized basic measures used in information theory and statistics. Now, we will apply them to determine the information flow in our knowledge-driven mining system. Therefore, we define three basic levels of dif-ferent semantic abstraction:
(i) image spaceI,
(ii) content-index space or class spaceω, (iii) semantic label spaceL.
4.1. Image space versus class space
First, we will evaluate the correlation between image space I and class space ω. For this verification, we prepared two datasets each consisting of 438 geocoded and coregistered Landsat TM and ERS1 images. All images cover Mozambique and have a size of 2000×2000 pixels. The complexity of Land-sat TM images is rather high, both from the point of view of image content and subjective understanding by users. The images indicate a huge diversity of spectral signatures and a very broad variety of structural information at different scales. Contrary to optical image data, the information con-tent of ERS1 SAR images of Mozambique is quite small. Due to the SAR sensitivity to the surface geometry, however, large scale structures like rivers and geomorphology are well visi-ble in the images.
From optical Landsat TM images we use spectral proper-ties and textural properproper-ties at different scales. The latter are related to the auto-binomial model of the Gibbs random field (GRF) family [9]. On ERS1 radar data we apply a filter and obtain the model-based despeckled (MBD) intensity image [10]. Additionally, structural details are extracted based on a Gauss-Markov random field (GMRF) prior texture model.
From the generated content-index, the mutual informa-tion between image spaceI and class spaceωcan be com-puted as
I(I;ω)=
ζ,i
pωi|IζpIζlog p
ωi|Iζ
pωi , (8)
wherep(ωi|Iζ) indicates the posterior probabilities of signal classes ωi given a certain image Iζ from the archive. Prior probabilities for signal classes and images are given byp(ωi) andp(Iζ), respectively.
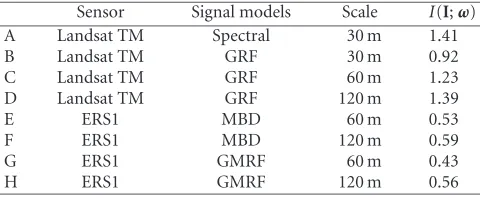
InTable 1, we summarize the calculations between image and class space. The measures indicate the information trans-mitted from image data through feature extraction and un-supervised content-index generation (clustering) to the class
Table1: Mutual informationI(I;ω) between image space and class (content-index) space. The class spaceωwas separately generated for 438 coregistered Landsat TM and ERS1 images based on diff er-ent signal models.
Sensor Signal models Scale I(I;ω)
A Landsat TM Spectral 30 m 1.41
B Landsat TM GRF 30 m 0.92
C Landsat TM GRF 60 m 1.23
D Landsat TM GRF 120 m 1.39
E ERS1 MBD 60 m 0.53
F ERS1 MBD 120 m 0.59
G ERS1 GMRF 60 m 0.43
H ERS1 GMRF 120 m 0.56
space. Note that for radar data, the computed mutual infor-mation I(I;ω) is much lower than for Landsat TM reflect-ing the low information content of ERS1 scenes. For Landsat TM images, the minimum information is given for texture at lowest scale.
Measuring image database complexity
The association between image space and class space can fur-ther be used to measure the complexity of images in the archive. Since the query performance of content-based im-age retrieval systems depends on the complexity of the data, analyzing the image database that is used for testing is rather important for evaluation. Similar to the method of [11] that applies image database statistics and information theory to determine the complexity of image databases, we measure the information between image space and class space based on Kullback-Leibler divergence.
In comparison to mutual information, (8), Kullback-Leibler divergence can be applied to determine the complex-ity of a single image in the entire archive. Thus, we define the prior probability pi as the probability p(ωi) of a par-ticular classωiin the global (across image) class space and the posterior probability qi as the probability p(ωi|Iζ) of a classωigiven a particular imageIζ. For these two quantities, Kullback-Leibler divergence is given according to (7) as
Dpi;qi=
i p
ωi|Iζlog p
ωi|Iζ
pωi , (9)
(a) (b) (c) (d) (e)
(f) (g) (h) (i) (j)
Figure2: Example of multimission dataset containing five coregistered Landsat TM (upper plots) and ERS1 (lower plots) images. For each image we computed the complexity in the archive using different signal models as outlined inFigure 3. (a) Lan096 cut19, (b) lan107 cut1, (c) lan104 cut6, (d) lan100 cut55, (e) lan101 cut81, (f) ers096 cut19, (g) ers107 cut1, (h) ers104 cut6, (i) ers100 cut55, and (j) ers101 cut81.
A B C D
Model 0
1 2 3 4 5
KL
di
ve
rgenc
e
Lan096 cut19 Lan107 cut1 Lan104 cut6
Lan101 cut81 Lan100 cut55 (a)
E F G H
Model 0
1 2 3
KL
di
ve
rgenc
e
Ers096 cut19 Ers107 cut1 Ers104 cut6
Ers101 cut81 Ers100 cut55 (b)
Figure3: Information-theoretic complexity of (a) Landsat TM and (b) ERS1 images as depicted inFigure 2. To describe the content of both datasets, the models fromTable 1are applied. The complexity measures show that “lan096 cut19” is a very simple image in the Landsat TM archive whereas “lan107 cut1” and “lan101 cut55” are quite complex. For ERS1 data, “ers104 cut6” is rather simple and “ers101 cut55” is the image with the highest complexity.
It can be seen as the model that captures most of the significant image structures in the archive.
4.2. Content-index space versus semantic label space
In the same way as we calculated the mutual information be-tween image space and class space, we can compute the mu-tual information between the next levels in the hierarchical
0 5 10 15 20 25 30 Labels
0 0.2 0.4 0.6 0.8 1
I
(
ω
;
L
)
Spectral GRF, 30 m
Figure4: Mutual informationI(ω;L) for a sequence of 26 seman-tic cover-type labels.I(ω;L) was separately computed for each sig-nal model, this time for spectral and GRF, scale 30 m. The increase of the mutual information depends on the diversity of the defined labels.
Since a user-defined semantic cover-type labelLν is the result of several human-machine interactions, the informa-tion betweenωandLcan be seen as subjective and objec-tive. More precisely, the stochastic linkp(ωi|Lν) derived from the user’s feedback connects objective signal classesωito the user-specific interpretation of the image content in form of semantic cover-types Lν. Therefore, the set of probabilities
p(ωi|Lν) is the central element of this analysis. Withp(ωi|Lν) as the likelihoods and the priors p(ωi) and p(Lν), the mu-tual information between signal class space and semantic la-bel space can be computed as
I(ω;L)=
i,ν
pωi|LνpLνlogp
ωi|Lν
pωi . (10)
Note that I(ω;L) is separately computed for each signal model that the user selected to learn a cover-type of his inter-est. We can interprete this measure as the quality of seman-tic cover-typesLνto capture the entire diversity of structures and patterns represented by the content-index. InFigure 4, the behaviour of the mutual information is shown for a quence of semantic labels defined by various users. If se-mantic labels are inserted that differ from the existing ones in terms of association to signal classes ωi of the different feature models, mutual information increases. Contrary, the mutual information decreases if cover-type labels are similar to the existing ones in the DBMS inventory. We can interpret an increase ofI(·) as the ingestion of a new semantic label in the database system that differs from the existing cover-types in terms of signal classesωi. Contrary, the mutual informa-tion decreases if cover-type labels are similar to existing se-mantics.
The mutual information between class space and seman-tic space can further be applied to determine a dynamic index
0 5 10 15 20 25 30
Labels 0
0.05 0.10 0.15 0.20 0.25 0.30
I
(
I
;
L
)
Figure5: Mutual information between image spaceIand semantic label spaceL. If new cover-types that are dissimilar from the existing ones are trained and ingested in the DBMS inventory, the mutual informationI(I;L) increases.
control function. This function enables to filter out labels at real time that are overlapping with other cover-types or to indicate to the user that similar labels have been already de-fined (seeSection 5).
4.3. Image space versus semantic label space
After computing the mutual information between image-class space and image-class-semantic space, we can directly make the connection between cover-type labelsLνand imagesIζ. Therefore, we start with Bayes’ formula
pLν|ωi= p
ωi|LνpLν
ν p
ωi|LνpLν
(11)
to obtain the posterior probabilities p(Lν|ωi) from the
like-lihoods p(ωi|Lν) and the priors p(Lν). Having defined the posterior probabilitiesp(Lν|ωi), we can infer the probability of a semantic labelLνgiven a certain imageIζas
pLν|Iζ=
i p
Lν|ωipωi|Iζ. (12)
These probabilities assign each semantic labelLνto the im-ages in the archive. The imim-ages with the highest probabilities
p(Lν|Iζ) are retrieved by the system and displayed to the sys-tem operator.
In a similar way as the mutual information betweenωi andLνis calculated, we obtain this information by
I(I;L)=
ζ,ν
pLν|IζpIζlog p
Lν|Iζ
pLν (13)
with posterior probabilities p(Lν|Iζ) from (12) and priors
0 5 10 15 20 25 30 Labels
0 10 20 30 40
Ar
ch
iv
e
cov
er
ag
e
(%
)
All
Posterior prob.
Coverage Separability
Figure6: Exploration image archive for 26 defined semantic labels. The plot shows the archive coverage using the first 6 top-ranked images in the search results. With all 26 labels, about 35% of the entire archive is assigned to the semantic content.
space. WhereasI(ω;L) indicates how much information the clusters contain about semantic labels,I(I;L) directly shows the association between images and semantic labels (the in-formation flow from the archive to users). Consequently, we can—at least qualitatively—infer the amount of images in the archive that are connected to cover-types. And if a new semantic label is inserted in the DBMS, its novelty can be as-sessed to the existing ones.
Notice the similarity between Figures6and5. While the first figure shows the coverage of the database according to retrieved top-ranked images based on different search crite-ria [2], the second shows the information-theoretic associa-tion between image and semantic label space.
5. EVALUATION OF HUMAN-MACHINE INTERACTIONS
The development of intelligent human-machine interfaces for information mining applications is a difficult task since no well-established guidelines and models of the functions that such systems should have are available [12]. Despite this difficulty, we designed and implemented graphical, in-tuitive, and powerful visual interfaces that aim at controlling an underlying mining system, directly interacting with the user and enabling him to retrieve relevant images without the support of a human intermediary.
The experiments reported in this section focus on the evaluation of the performance of human-machine interac-tions. First, the user’s target structures are classified and identified by tracing the man-machine interactions. Then, the convergence of the learning process is analyzed using information-theoretic measurements, and finally the train-ing feedback is applied to predict which cover-types the user might be interested in.
For the evaluation task, we ingested several datasets in the KIM system that had been used for studying a flooding disas-ter in Mozambique. Typical tasks for image analysts were to identify flooded land and road networks, to look for airstrips to provide humanitarian air-borne supply, and to detect ar-eas that can be used for building refugee camps. The detailed study of all scenes and the identification of relevant objects with “classical” tools for interpreting remote sensing image data required several months of work. With KIM, we pro-vided the involved image analysts an easy-to-learn tool to ef-ficiently explore large archives and to discriminate and an-alyze the relevant image content. After a short introduction in the KIM system and its functions, the evaluators could de-fine semantic cover-type labels, query the archive for relevant data, and interpret them.
5.1. Target structure classification and identification
In order to follow a system operator’s training iterations, we use the information stored in the user-logTable 2. With this information, the following details about target structures from the traced human-computer interactions are extracted: the time of performed training samples, the action type, and the location of samples in the image. In order to exemplify the classification of target structures, we superimpose the training samples on the images with indication of training iteration and the kind of training (positive or negative). We show the man-machine interactions for training using five Landsat images inFigure 7.
The user both performed 15 samples on these five im-ages to learn the semantic cover-type “road” and commented (off-line) on each iteration. With the positive examples, the operator tried to include many label relevant (linear) struc-tures. Negative ones are supposed to cover a high diversity of irrelevant objects and structures reflected by different feature modelsTable 3.
5.2. Convergence of learning process
How efficient is the mining system learning convergence? To answer this question, we analyze the human-computer inter-actions and measure the learning progress using Kullback-Leibler divergence. In [13], the divergence between two com-plete sets of probabilitiesLν= {p(ω1|Lν),. . .,p(ωr|Lν)}and ¬Lν= {p(ω1|¬Lν),. . .,p(ωr|¬Lν)}is defined as
DLν,¬Lν=
r
i=1
pωi|Lν−pωi|¬Lνln p
ωi|Lν
pωi|¬Lν, (14)
which can be seen as the distance between the two probability distributionsLνand¬Lν. The divergenceD(Lν,¬Lν) can be calculated either for a combination of signal models or separately for each signal class.
Each positive and negative training iteration (mouse click) implicitly causes the update of the probabilistic link
Table2: User-log information stored in the image information mining DBMS. After selecting a certain combination of feature models and an image from the initial gallery, the user started to analyze the image data and to give positive and negative training samples (left and right mouse clicks). Note that each performed action is assigned to a certain action type and time.
Time Action type Parameters
11:30:06 Model 1, 2, Switzerland, spectral, 256, 256, 151
11:30:06 Model 2, 2, Switzerland, texture, 256, 256, 51
11:30:06 Image 0, tmgeo 402 4 6, new label
11:30:38 Applet loaded —
11:30:48 Click left Zoom Panel, [x=195,y=85]
11:30:52 Click left Zoom Panel, [x=179,y=30]
11:30:54 Click right Zoom Panel, [x=172,y=37]
11:30:59 Click right Zoom Panel, [x=106,y=13]
11:31:02 Click right Zoom Panel, [x=95,y=104]
11:31:07 Click left Zoom Panel, [x=196,y=85]
11:31:10 Search —
11:31:28 Order Separability value ASC, lowest
11:31:28 Image 1, tmgeo 402 3 5, swiss river
11:31:35 Tab change Learn
11:31:41 Applet loaded —
11:31:47 Click left Zoom panel, [x=87,y=177]
11:31:52 Click left Zoom panel, [x=87,y=158]
· · · · · · · · ·
1,+
(a)
25,,+− 6,+
7,−
4,−
3,−
(b)
9,−
8,+
(c)
11,−
12,+
10, +
(d)
13,+
15
,
−
14
,
+
(e)
Table3: Information about the training samples shown inFigure 7. The user’s aim was to include many similar structures in his positive training whereas the negative training shows a high range of contrary patterns.
Iteration Training (+/−) User’s comment
1 + Starting sample, road in flat terrain
Search archive, selected image from coverage retrieval set
2 + Road in another image
3 − Negative training sample for smooth terrain
4 − Negative training sample, exclude flat terrain
5 − Negative training sample close to a road
6 + Include road
7 − Exclude rough terrain
Search archive, selected image from separability retrieval set
8 + Include highway road on a new image
9 − Specify road by clicking next to road
Search archive, selected image from coverage retrieval set
10 + Include strong road
11 − Exclude “city”
12 + Include road crossing
Search archive, selected image from separability retrieval set
13 + Include road on another image
14 + Include road
15 − Exclude road
0 5 10 15 20
Training iteration 0
0.5 1.0 1.5 2.0
D
(
ᏸ
;
¬
ᏸ
)
Spectral Texture
Positive training Negative training
Figure8: Kullback-Leibler divergence for interactive learning. The two graphs, each one for a certain feature model, represent the in-crease or dein-crease of divergence after each user-performed training sample.
divergence for the different feature models behaves and (2) whether there is convergence.
InFigure 8, we analyze the Kullback-Leibler divergence for the traced interactions as displayed inFigure 7. After the first two positive training samples, the divergence for both feature models almost equally increases. The third and all following interactions show that the defined semantic label is well represented by texture, the spectral model is of minor importance. Although the last three positive training itera-tions lead to a linear increase of the divergence for texture, the sum of both models as the average quality of the training
shows convergence. This example shows the real behaviour of the interaction between human and system: with only a few training samples, an operator can define a cover-type la-bel and query the database for relevant images. Of course, the number of iterations necessary to train a label depends on the selected feature models and the complexity of the la-bel.
5.3. Matching user-specific semantic labels
The example inFigure 8demonstrates that a user is able to define a particular semantic cover-type with just a few train-ing iterations. Now, we want to predict the user’s intentions. By monitoring the interactions with the database system, it might be possible to somehow predict which semantic label or category of labels the user is interested in. This kind of forecast is called “matching of user interests” in literature and tries to identify the user’s target by analyzing his actions [14]. In a similar way as we computed the Kullback-Leibler diver-genceD(Lν,¬Lν) between the two probability distributions
Lν(positive training) and¬Lν(negative training) in (14), we can extend this formula and determine the “similarity” between a certain label and other labels in the inventory. De-noting byLνthe label a user is training, the similarity to any other labelLµcan be assessed as
DLν,Lµ= i
pωi|Lνln p
ωi|Lν
pωi|Lµ. (15)
Labels that are “close”2toL
νare characterized by a very low divergenceD(·) and labels dissimilar toLνshow a high di-vergence. In Figure 9, we depict the similarity of a partic-ular label to others during the interactive learning process.
1 2 3 4 5 6 7 8 9 10 11 12 13 14 Iteration
0 1 2 3 4
D
(
ᏸν
;
¬
ᏸµ
)
River Road Forest
Forest 2 River 2 Cloud (a)
1 2 3 4 5 6 7 8 9 10 11 12 13 14
Iteration 0
1 2 3 4
D
(
ᏸν
;
¬
ᏸµ
)
River Road Forest
Forest 2 River 2 Cloud (b)
Figure9: Results of matching a trained cover-type label “cloud” using (a) spectral and (b) textural feature model.
After just a few feedback samples, one semantic label close to “cloud” is visible for both the spectral and texture feature model. Of course, the performance of this method depends on the applied signal models for interactive learning and the capability of the user to learn the system.
6. CONCLUSIONS
In this paper we demonstrated the evaluation of a probabilis-tic knowledge-driven image information mining system us-ing information-theoretic measures. We started the presenta-tion with the basic system concept of hierarchical image con-tent modeling and briefly illuminated the system from the communication channel view. Having explained informa-tion measures settled in informainforma-tion theory, namely Shan-non’s entropy, mutual information, and Kullback-Leibler di-vergence, we applied them to evaluate the mining system. Therefore, the system was separated in three main levels: im-age space, content-index space, and semantic label space. We computed the information between image space and class space, class space and semantic space, and finally between image space and semantic space as the direct connection tween image archive data and users. Mutual information be-tween image and class space can be viewed as a pure objec-tive measure and indicates the ability of the system to rep-resent the image content. The other measures are related to subjective user-defined labels and enable an analysis of the trained cover-types in the system. To explore the interactions between human and mining system, an operator was traced during several learning sessions. We classified and analyzed the target structures that are given by positive and negative training samples, analyzed the learning progress, and tried to match user-specific semantic labels.
In future, we will further develop the system and its graphical user interface. In order to optimally adjust the user interface on the user’s needs, we will deal with the registra-tion of the user’s behaviour and preferences, typical queries, and actions. The implementation and evaluation of person-alizer modules for user profiling, content targeting, and user tracking functionality will be improved to deliver the target specific content to a particular group of users. Additionally, different viewing techniques, for example, 2D/3D visualiza-tion, will support the user in analyzing different data sources and will give him an immediate feedback.
REFERENCES
[1] Y. Rui, T. S. Huang, and S. Chang, “Image retrieval: past, present, and future,” in Proc. International Symposium on Multimedia Information Processing (ISMIP ’97), Taipei, Tai-wan, December 1997.
[2] M. Datcu, H. Daschiel, A. Pelizzari, et al., “Information min-ing in remote sensmin-ing image archives: system concepts,”IEEE Trans. Geosci. Remote Sensing, vol. 41, no. 12, pp. 2923–2936, 2003.
[3] U. M. Fayyad, G. Piatetsky-Shapiro, P. Smyth, and R. Uthu-rusamy,Advances in Knowledge Discovery and Data Mining, MIT Press, New York, NY, USA, 1996.
[4] H. M¨uller, W. M¨uller, D. McG. Squire, S. Marchand-Maillet, and T. Pun, “Performance evaluation in content-based image retrieval: overview and proposals,”Pattern Recognition Letters, vol. 22, no. 5, pp. 593–601, 2001.
[5] I. H. Jermyn, C. W. Shaffrey, and N. G. Kingsbury, “Eval-uation methodologies for image retrieval systems,” inProc. Advanced Concepts for Intelligent Visual Systems (ACIVS ’02), Ghent, Belgium, September 2002.
[7] M. Schr¨oder, H. Rehrauer, K. Seidel, and M. Datcu, “Inter-active learning and probabilistic retrieval in remote sensing image archives,”IEEE Trans. Geosci. Remote Sensing, vol. 38, no. 5, pp. 2288–2298, 2000.
[8] T. M. Cover and J. A. Thomas,Elements of Information Theory, John Wiley & Sons, New York, NY, USA, 1991.
[9] M. Schr¨oder, H. Rehrauer, K. Seidel, and M. Datcu, “Spatial information retrieval from remote-sensing images. II. Gibbs-Markov random fields,”IEEE Trans. Geosci. Remote Sensing, vol. 36, no. 5, pp. 1446–1455, 1998.
[10] M. Walessa and M. Datcu, “Model-based despeckling and in-formation extraction from SAR images,”IEEE Trans. Geosci. Remote Sensing, vol. 38, no. 5, pp. 2258–2269, 2000.
[11] A. Rao, R. K. Srihari, L. Zhu, and A. Zhang, “A method for measuring the complexity of image databases,”IEEE Trans. Multimedia, vol. 40, no. 2, pp. 160–173, 2002.
[12] G. Guida and C. Tassa,Design and Development of Knowledge-Based Systems—from Life Cycle to Methodology, Wiley, Chich-ester, UK, 1994.
[13] S. Kullback,Information Theory and Statistics, Dover Publica-tions, Mineola, NY, USA, 1997.
[14] W. Koh and L. Mui, “An information-theoretic approach for ontology-based interest matching,” inProc. Workshop on On-tology Learning (OL ’01), Seattle, Wash, USA, August 2001.
Herbert Daschielreceived the Diploma de-gree in geodetic engineering from the Tech-nical University of Munich, Munich, Ger-many, in 2001, and the Ph.D. degree in com-puter engineering from the Technical Uni-versity of Berlin, Berlin, Germany, in 2004. From 2001 to 2004 he was with the Re-mote Sensing Technology Institute (IMF) of the German Aerospace Center (DLR), Oberpfaffenhofen, Germany, where he
car-ried out algorithms for image information mining system eval-uation and enhancement. Since 2005 he has been with the Bay-erische Vermessungsverwaltung, Munich, Germany. His interests are in knowledge-based multimedia information retrieval, image processing, human-machine communication, and OO program-ming.