Comparative Advantage in Export of Major Agricultural
Commodities in India: A Post-reforms Analysis
Kerobim Lakra, Shoji Lal Bairwa, Lokesh Kumar Meena and Saket Kushwaha
Department of Agricultural Economics, Institute of Agricultural Sciences, Banaras Hindu University, Varanasi-221005, INDIA
Corresponding author: [email protected]
Paper no: 122 Received: 6 April, 2014 Revised: 12 May, 2014 Accepted: 30 May, 2014
Abstract
With the withering away of protectionist policies, the trade pattern of India is likely to march in the direction of its comparative advantage. The paper attempts to assess India’s revealed Symmetric comparative advantage (RSCA) in export of major agricultural commodities. This study evaluates the structure of comparative advantage in India and the change in the scenario over a period of 21 years from 1991 to 2011. The present study has ascertained the changes in comparative advantage status of India’s major agricultural exports vis-a-vis global players during the post-reforms period. It has been observed in the study that in exports of certain commodities like rice, tea, tobacco, spices, groundnuts and castor oil, India has been able to maintain its comparative advantage, but several other commodities like coffee, fresh fruits, fresh vegetables, cotton and sugar, etc. have been negatively affected. India has been found losing out its comparative advantage in export of some of the agricultural commodities to other global competitors during the period of post economic reforms.
Keywords: Agricultural commodities, agricultural exports, comparative advantage, and economic reforms.
countries like China, Malaysia, Philippines, Thailand, Singapore and Indonesia among others pose a big threat to Indian agricultural products. The demand and supply situations in the Asian continent have undergone a rapid transformation due to the growth of the world economy and lowering of trade barriers (Aksoy and Beghin, 2005). An economic upheaval, which took place in most of the South-East Asian countries, has resulted in the creation of a huge supply potential in these economies along with an increase in their per capita income and a simultaneous increase in their trade potential.
Moreover, some recent developments in the international trade scenario, followed by the establishment of World Trade Organization (WTO) and subsequent liberalization of trade have resulted in the emergence of new powers like Vietnam and Turkey with substantial potential in agricultural trade. The formation of regional trading blocks like ASEAN Free Trade Area (AFTA), Bangkok Agreement, South Asia Free Trade Agreement (SAFTA), etc. has given rise to powerful associations with strong bargaining power and these can significantly influence the demand and supply factors in the global markets. Above all, the Indian economy in itself has undergone a rapid transformation after the inception of economic reforms in 1991. India’s ratification of the Agreement on Agriculture (AoA) with WTO also had a major impact leading to redefining of its agricultural trade. During this time span, various agricultural commodities exported from India have responded differently and their levels of comparative advantage in the global markets have altered significantly. Hence, it is imperative to have a systematic and well structured analysis to find alterations in the comparative advantage of India vis-a-vis World. The present study was undertaken with the specific objective of determining India’s comparative advantage in exports of major agricultural commodities with respect to global exports.
Data and Methodology
productivity. The disadvantage, however, is that it cannot distinguish improvements in factor endowments and pursuit of appropriate trade policies by a country (Batra and Khan, 2005). The original index of RCA was first formulated by Balassa (1965) and can be written as per equation (1).
RCAij = (Xij/Xik)/(Xnj/Xnk) . . . (1)
Where,
Xij = Exports of country ‘i’ of commodity ‘j’
Xik = Exports of country ‘i’ of a total agricultural commodities ‘k’
Xnj = Exports of a world ‘n’ of commodity ‘j’, and
Xnk = Exports of a world ‘n’ of a total agricultural commodities ‘k’
In the present study, country ‘i’ refers to India, commodity ‘j’ refers to any of the selected agricultural commodities, set of commodities ‘k’ refers to the total agricultural commodities and ‘n’ refers to World. When RCA assumed the value greater than unity for a given country in a given commodity, the country is said to have a revealed comparative advantage in that commodity. However, RCA suffers from the problem of asymmetry as pure RCA is basically not comparable on both sides of unity. It the index ranged from zero to one, a country is said not to be specialized in a given sector and if the value of the index ranged from one to infinity, the country is said to be specialized. The index is made symmetric, following the methodology suggested by Dalum et al. (1998) and the resultant index is called as Revealed Symmetric Comparative Advantage (RSCA). Mathematically, it can be expressed by the following equation (2).
RSCA = (RCA-1) / (RCA+1) . . . (2)
This measure ranges between -1 and +1 and is free from the problem of skewness. A commodity is said to have comparative advantage in its exports if the corresponding RSCA value is positive and vice versa. In the present study, the RSCA was used to look into the comparative advantage of the selected commodities.
Results and Discussion
Rice (Milled)
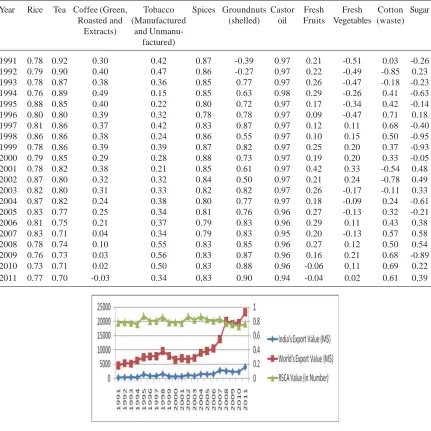
The RSCA values and rice exports from India and world are presented in Table 1 and Figure 1, which revealed that the India has comparative advantage in export of milled rice. Indian milled rice exports showed varying levels of comparative advantage in different years of the study period. In 1991, the estimated value of RSCA was 0.78, which slightly decline to 0.77 in 2011. Therefore, it can be concluded that India enjoyed in export of milled rice over the years at varying levels.
Table 1: Revealed Symmetric Comparative Advantage of Agricultural commodities
Year Rice Tea Coffee (Green, Tobacco Spices Groundnuts Castor Fresh Fresh Cotton Sugar Roasted and (Manufactured (shelled) oil Fruits Vegetables (waste)
Extracts) and Unmanu-factured)
1991 0.78 0.92 0.30 0.42 0.87 -0.39 0.97 0.21 -0.51 0.03 -0.26 1992 0.79 0.90 0.40 0.47 0.86 -0.27 0.97 0.22 -0.49 -0.85 0.23 1993 0.78 0.87 0.38 0.36 0.85 0.77 0.97 0.26 -0.47 -0.18 -0.23 1994 0.76 0.89 0.49 0.15 0.85 0.63 0.98 0.29 -0.26 0.41 -0.63 1995 0.88 0.85 0.40 0.22 0.80 0.72 0.97 0.17 -0.34 0.42 -0.14 1996 0.80 0.80 0.39 0.32 0.78 0.78 0.97 0.09 -0.47 0.71 0.18 1997 0.81 0.86 0.37 0.42 0.83 0.87 0.97 0.12 0.11 0.68 -0.40 1998 0.86 0.86 0.38 0.24 0.86 0.55 0.97 0.10 0.15 0.50 -0.95 1999 0.78 0.86 0.39 0.39 0.87 0.82 0.97 0.25 0.20 0.37 -0.93 2000 0.79 0.85 0.29 0.28 0.88 0.73 0.97 0.19 0.20 0.33 -0.05 2001 0.78 0.82 0.38 0.21 0.85 0.61 0.97 0.42 0.33 -0.54 0.48 2002 0.87 0.80 0.32 0.32 0.84 0.50 0.97 0.21 0.24 -0.78 0.49 2003 0.82 0.80 0.31 0.33 0.82 0.82 0.97 0.26 -0.17 -0.11 0.33 2004 0.87 0.82 0.24 0.38 0.80 0.77 0.97 0.18 -0.09 0.24 -0.61 2005 0.83 0.77 0.25 0.34 0.81 0.76 0.96 0.27 -0.13 0.32 -0.21
2006 0.81 0.75 0.21 0.37 0.79 0.83 0.96 0.29 0.11 0.43 0.38
2007 0.83 0.71 0.04 0.34 0.79 0.83 0.95 0.20 -0.13 0.57 0.58
2008 0.78 0.74 0.10 0.55 0.83 0.85 0.96 0.27 0.12 0.50 0.54
2009 0.76 0.73 0.03 0.56 0.83 0.87 0.96 0.16 0.21 0.68 -0.89 2010 0.73 0.71 0.02 0.50 0.83 0.88 0.96 -0.06 0.11 0.69 0.22 2011 0.77 0.70 -0.03 0.34 0.83 0.90 0.94 -0.04 0.02 0.61 0.39
Tea
The values of RSCA and Tea exports from India and world are presented in Table 1 and Figure 2 from the period 1991 to 2011. India was found to have a comparative advantage in tea exports in all the years under consideration, as could be seen from the positive values of RSCA. But over the years, India’s comparative advantage seemed to be deteriorating gradually.
In 1991, the value of RSCA was 0.92, which decreased to 0.70 by the year 2011, depicting a clear downward trend. The results showed that India had significant and far-reaching implications in the global market and direct impact on the Indian tea industry.
Coffee (Green, Roasted and Extracts)
In coffee exports, Indonesia, Thailand and Vietnam are the major competitors to India. Because of large value, green, roasted and extracts values were combined as one commodity for coffee. The computed RSCA values for India were decling over the years. The RSCA value was 0.30 in year 1991 and it exhabited negative value in year 2011 (Table 1 and Figure 3), which indicated that India has greater threat in export of coffee due to increasing compitition among world.
Tobacco (Manufactured and Unmanufactured)
In tobacco exports, US, Zimbabwe and Brazil are the major competitors to India. The computed RSCA values for India exhibits positive over the years and indicate its comparative advantage in Tobacco exports. The RSCA value was 0.42 in year 1991 and which was slightly decline to 0.44 in the 2011 (Table 1 and Figure 4), which means that India has scope to exports tobacco (manufactured and unmanufactured).
Fig. 2: RSCA values and Tea exports from India and world
Spices
The RSCA values and exports value spices from India and world are presented in Table 1 and Figure 5, which shows that India enjoyed over the years of its comparative advantage in export of spices. The RSCA value was 0.87 in year 1991 and which was slightly decline to 0.83 in year 2011. During 1991 to 1996 export value of spices was stagnate and after that growing trend was observed.
Fig. 4: RSCA values and Tobacco (Manufactured and Unmanufactured) exports from India and world
Groundnuts (Shelled)
A brief perusal of the RSCA values and gruondnuts (shelled) exports from India and world (Table 1 and Figure 6), which revealed that the India has comparative advantage in exports of gruondnuts (shelled). Indian groundnuts (shelled) exports showed increasing levels of comparative advantage in different years of the study period. In 1991 and 1992, the estimated value of RSCA was negative which improved to 0.90 in year 2011.
Fig. 5: RSCA values and Spices exports from India and world
Castor Oil
The RSCA values was highly positive for export of castor oil from India. India enjoying over the years through compatative advantage in export of castor oil.
The RSCA value was 0.97 in year 1991 and it was slightly decline to 0.94 in year 2011 (Table 1 and Figure 7), which revealed that county has greater opporutiny in trade of castor oil.
Fresh Fruits
India’s comparative advantage in export of Fresh Fruits seemed to dwindle during various years after post reforms. At the beginning period of reforms India maintained its comparative advantage till 2009 and lost its comparative acvantage from last two years. The RSCA value was 0.21 in year 1991 and came down to -0.04 in year 2011 (Table 1 and Figure 8), which indicate the comparative disadvantage in export of fresh fruits.
Fresh Vegetables
India’s comparative advantage in export of fresh vegetables was very low over the years. The RSCA value was fluctuating over the years and it was -0.51 in year 1991 and recovered to 0.21 in year 2011(Table 1 and Figure 9). The export value of fresh vegetables is increasing in our county but still comparative advantage is low.
Fig. 7: Castor Oil exports from India and world
Cotton (Waste)
India had fluctuating comparative advantage in export of cotton (waste) over the years and it was observed negative in mid years. After 2003, it was improved and positively increasing.
Morever, the RSCA value is incresing after year 2002 and achieved 0.61 in year 2011 (Table 1 and Figure 10). From the results, India improving its comparative advantage in export of cotton (waste).
Fig. 9: RSCA values and Fresh Vegetables exports from India and world
Fig. 10: RSCA values and Cotton (Waste) exports from India and world
Sugar
The RSCA values revealed that India has comparative disadvantage in export of sugar over the years. The RSCA value was found to be very low and even negative in most of the years, same result was found by Kanaka and Chinadurai (2012). At the begning stage of reforms the RSCA value was -0.26 and it was improved to 0.39 in the year 2011. From the figure 11, contry’s export value was fluctuating continueously and it was getting better after year 2009.
Conclusion
The study had shown that export of various agricultural commodities from India had responded differently in terms of comparative advantage during the post-reforms period. India had enjoyed a comparative advantage in milled rice exports and maintained it over the years. A similar pattern had been observed in tea tobacco and spices export also, where India had been found more comparative advantage in tea and spices export compare to tobacco. The comparative advantage is high in export of tea but trend is slightly decling, same result was found by Shinoj and Mathur ( 2008). Spices has more comparative advantage than tobacco, while both commodities declined slightly over the years. There was comparative disdvantage observed in early economic reform period and after that it recovered and revealed greater comparative advantage in export of groundnuts (shelled). Castor oil had larger comparative advantage and showed consistancy over the years. India had low comparative advantage in both fresh fruits and fresh vegatables compare to other agricultural commodities. Comparative advantage was not much good for cotton (waste) but recovered after year 2003. India’s status in exports of cotton had not been very comfortable. Although cotton products dominate India’s agricultural exports but it could not be attributed to comparative advantage in the global market. India had mostly comparative disadvantage in export of sugar over the years because of lower expoet value of sugar. India is enjoying its comparative advantage in most of the agricultural commodities except fresh fruit, fresh vegetable, cotton and sugar and need to maintain and improve it at global level.
References
Aksoy, M.A. and Beghin, J.C. 2005. Global Agricultural Trade Policies. Global Agricultural Trade and Developing Countries, Manas Publiacations, New Delhi, pp. 37-53.
Balance, R.H., Forstner, H. and Murray, T. 1987. Consistency tests of alternative measures of comparative advantage.
Review of Economics and Statistics 69: 157-161.
Balassa, B. 1965. Trade liberalisation and revealed comp arative advantage. The Manchester School of Economics and
Social Studies 33(2) : 99-123.
Batra, A. and Khan, Z. 2005. Revealed comparative advantage: An analysis for India and China. ICRIER Working Paper No. 168, New Delhi, pp. 5-13.
Dalum, B.K., Laursen, K. and and Villumsen, G. 1998. Structural change in OECD export specialization patterns: De-specialization and stickiness. International Review of Applied Economics 12 : 447- 467.
Kanaka, S. and Chinadurai, M. 2012. A study of Comparative Advantage of Indian Agricultural Exports. Journal of
Management and Science 2 (3) :1-9.
Appendix I:
Total Agriculture Export value of India and World for 1991 to 20011 (in ‘000$)
Year India’s Total Agriculture Export World’s Total Agriculture Export
1991 2796161 328659185
1992 2947061 357340483
1993 3357395 338737928
1994 3239464 388457665
1995 5493709 442901899
1996 5850742 465557247
1997 5655479 457582994
1998 5225313 437741809
1999 4642044 417168848
2000 4949613 410984483
2001 5233895 414356097
2002 5521562 442667343
2003 6504378 525210872
2004 7058321 607328780
2005 9019607 653297989
2006 11259030 721262546
2007 16708194 872861370
2008 17307299 1063734154
2009 15661552 950085842
2010 19933411 1077882284
2011 30288815 1313940192