18th International Conference on Structural Mechanics in Reactor Technology (SMiRT 18) Beijing, China, August 7-12, 2005 SMiRT18-K04-7
SOIL-STRUCTURE INTERACTION ANALYSIS INCLUDING GROUND
MOTION INCOHERENCY EFFECTS
Farhang Ostadan
Bechtel, 50 Beale St, San Francisco,
California, 94105, USA
Phone: 415-768-3734, Fax: 415-768-4692
E-mail: [email protected]
Nan Deng
Bechtel, 50 Beale St, San Francisco,
California, 94105, USA
Phone: 415-768-9144, Fax: 415-768-4692
E-mail: [email protected]
Robert Kennedy
Structural Mechanics Consulting
28625 Mountain Meadow Road, Escondido, CA 92026
Phone: (760)751-3510 , Fax: (760) 751-3537
E-mail: [email protected]
ABSTRACT
For critical nuclear facilities located at soil sites, soil-structure interaction (SSI) analysis is required to develop seismic responses of the structures, systems and components. Such analyses are generally performed using the design motion by assuming a coherent wave field often consisting of vertically propagating shear and P-waves. The wave passage effects can also be considered depending on the seismic setting of the facility. Review of strong ground motion arrays from several dense arrays on soil and rock sites indicates that ground motion coherency reduces as frequency and separation distance of the monitoring points increase. These observations have resulted in several ground motion “incoherency” models to best represent the observed data. In this paper implementation of the most recent ground motion incoherency model in the Computer Program SASSI2000 is discussed. The results in terms of foundation scattered motion is compared with the fully coherent motion for a rock site and a typical 2000-year design motion for Western US (WUS). The incoherency model was also applied to a nuclear facility on a stiff soil site and the differences in the results are presented and discussed.
Keywords: Incoherency, SSI, Foundation Motion, SASSI2000.
1. INTRODUCTION
of spatial variation of ground motion on seismic SSI responses using the most recent ground motion incoherency model.
2. GROUND MOTION INCOHERENCY MODEL AND ITS IMPLEMENTATION IN SASSI2000
The coherency function between the two ground motions at points “i” and “j” is defined as
)
(
)
(
)
(
)
(
ω
ω
ω
ω
γ
jj ii
ij ij
S
S
S
=
(1)where
γ
ij(
ω
)
is the complex coherency function of omega,S
ii(
ω
)
andS
jj(
ω
)
are the power spectral density functions of the time histories at points “i” and “j”, respectively, andS
ij(
ω
)
the cross-spectral densityfunction of the same two motions.
There are several ways the coherency or incoherency can be described: lagged coherency, plane-wave coherency, and unlagged coherency. These three measures of coherency are described below.
The lagged coherency is the most commonly cited coherency measure. It is the coherency measured after aligning the time series using the time lag that leads to the largest modulus of the cross spectrum. There is no requirement that the time lags are consistent between frequencies. In general, the lagged coherency does not go to zero at large separations and high frequencies. The level depends on the number of frequencies smoothed.
The plane-wave coherency differs from the lagged coherency in that it uses a single time lag for all frequencies. That is, it measures the coherency relative to a single wave speed for each earthquake. As a result, the plane-wave coherency is smaller than the unlaggged coherency. The plane-wave coherency is found by taking the real part of the smoothed cross-spectrum after aligning the ground motions on the best plane-wave speed. The plane–wave coherency will approach zero at high frequencies and large separations.
Finally, the unlagged coherency measures the coherency assuming no time lag between locations. It is the real part of the smoothed cross-spectrum. The unlagged coherency is smaller than the plane-wave coherency.
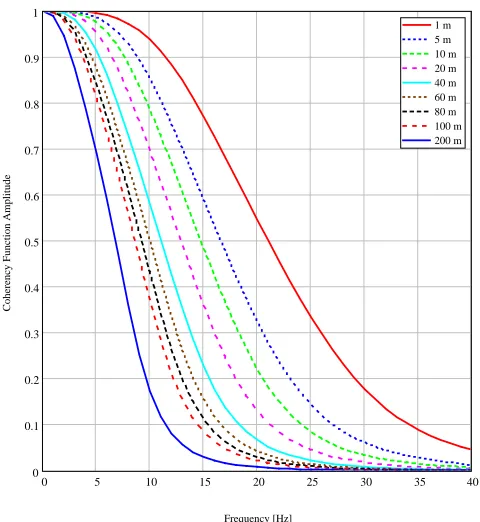
Using the recorded data, Abrahamson (1992) has developed several models over time and enhancing the models using the more recent recorded data. The most recent model (Abrahamson, 2005) is based on the data set from 12 different arrays and is considered the most updated ground motion incoherency model for design application. The amplitude of the coherency functions associated with horizontal and vertical motions are presented in Figs. 1 and 2, respectively. As shown, the coherency reduces significantly over distance and with increasing frequency. As a result of such spatial variation of ground motion, the foundation translational motion which is the constrained motion of the free-field motion, constrained by foundation rigidity, is expected to reduce. However, the rocking and torsional motions tend to increase. The effects of ground motion icoherency on the foundation and structural responses are discussed in a later section.
0 5 10 15 20 25 30 35 40 0
0.1 0.2 0.3 0.4 0.5 0.6 0.7 0.8 0.9 1
1 m 5 m 10 m 20 m 40 m 60 m 80 m 100 m 200 m
Frequency [Hz]
Coherency Function Amplitude
.
Figure 1 Amplitude of Horizontal Incoherency Function
0 5 10 15 20 25 30 35 40
0 0.1 0.2 0.3 0.4 0.5 0.6 0.7 0.8 0.9 1
1 m 5 m 10 m 20 m 40 m 60 m 80 m 100 m 200 m
Frequency [Hz]
Coherency Function Am
plitude
.
3. SSI CASES
3.1 Surface Rigid Square Foundation
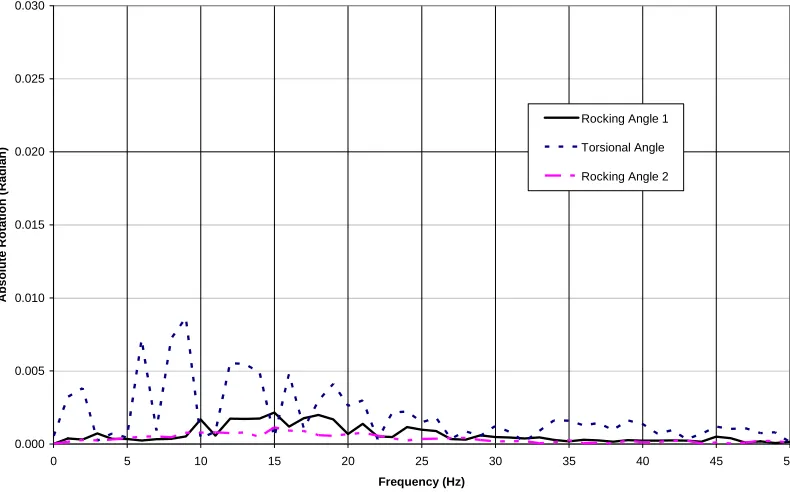
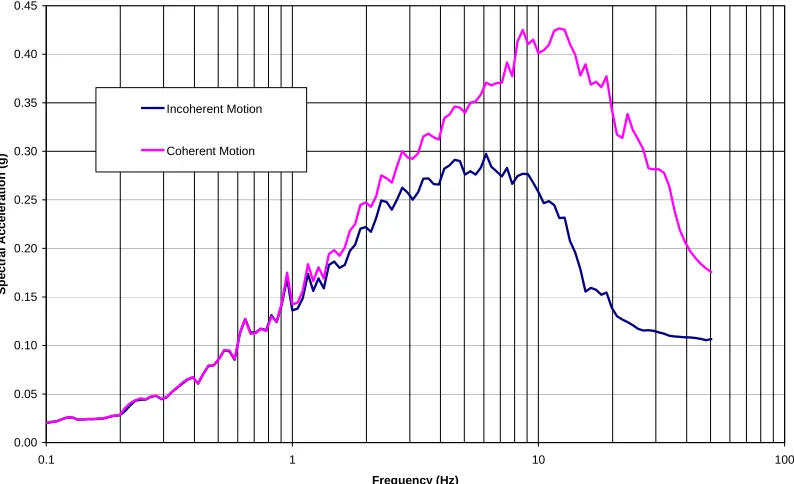
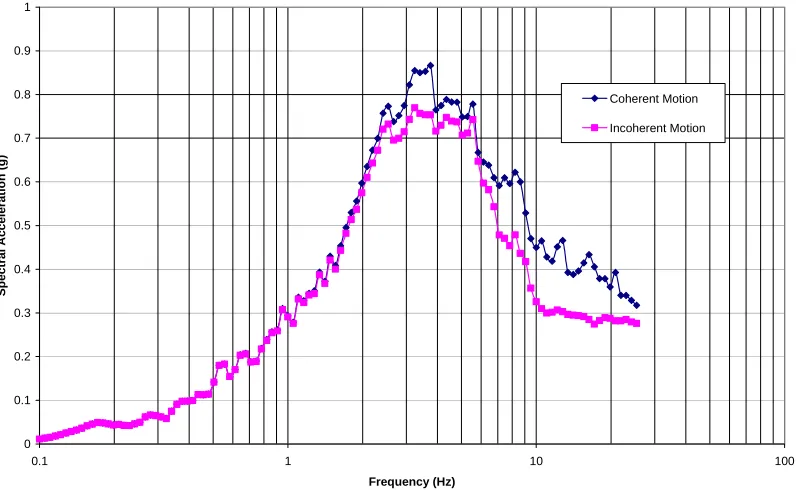
To study the effects on foundation motion, a rigid 150-ft square, massless foundation on the surface of a uniform halfspace with a shear wave velocity of 6300 ft/sec (rock site) was analyzed. Results in terms of the transfer functions at the center of the foundation in the horizontal and vertical directions are shown in Fig. 3 indicating significant reduction of foundation motion at high frequency. It should be noted that for fully coherent motion, the transfer function for a surface rigid massless foundation is unity across the frequency range. The coupling responses of the foundation due to horizontal shaking reflecting the rocking in both directions and torsional motions are shown in Fig. 4. The increase in the coupling response is small. To evaluate the impact on the foundation motion in terms of acceleration response spectra, a typical WUS design motion was used in the analysis. The foundation motion in horizontal and vertical directions are shown in Figs. 5 and 6, respectively. The result for the coherent motion is the same as the input motion. As depicted in these two figures, the reduction of motion at high frequency, in the critical range important for equipment qualification and design, is significant.
3.2 SSI Analysis of a Vitrification Building
The construction of the vitrification facility of the River Protection Project (RPP), Waste Treatment Plant (WTP), in the Hanford Reservation in the State of Washington is progressing at this time. The facility is planned to vitrify nearly 205 million liters of radioactive and chemical wastes currently stored in 177 underground tanks at the Hanford site some of which date back to World War II. The vitrification process mixes waste into sturdy glass. The glass will be stored partly at the site and partly off-site.
The facility consists of several large complex structures that are categorized as Seismic Category I, following the US Department of Energy guidelines. The High Level Waste (HLW) is the main structure with a composite steel framing and concrete shear wall structural system inter-connected at multi-story levels. The shielding requirements stipulate concrete walls up to 4-ft thick and concrete slabs that range in thickness from 1 ft to 3 ft. The footprint of each of these buildings is about 240 ft by 320 ft, rising above grade level to Elevation 70 ft.
At the location of the facility, the site is a very deep soil site consisting primarily of dense to very dense sand and gravel layers. The shear wave velocity at the sites varies from 1200 ft/sec to over 2000 ft/sec at the depth of 150 ft. The details on the plant layout structural design and SSI analysis of the facility was published by Ostadan et. al (2003).
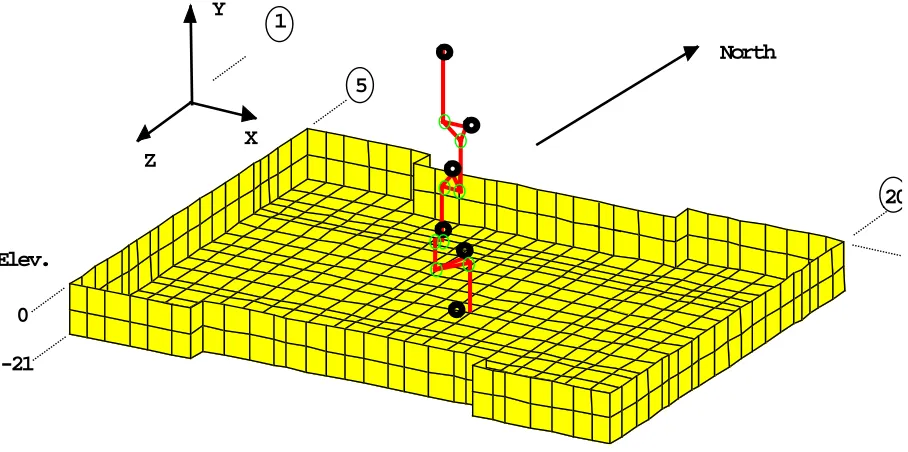
For the purpose of this study a simple beam stick model of the HLW structure was used. The structure was placed on the surface of soil profile to exclude the embedment effects for clear evaluation of the incoherency effects in this study. The SASSI beam stick model of the HLW building is shown in Fig. 7.
The results of analysis in terms of acceleration response spectra at the major floor of the building (Elevation 57 ft) in the horizontal and vertical directions are shown in Figs. 8 and 9, respectively. As shown in these figures, even at the soil sites with the design motion typical of WUS design motion, containing much less energy in the high frequency range as compared with the EUS design motions, the effect of ground motion incoherency is significant. The reduction results in less seismic demand for equipment analysis and qualification.
4. CONCLUSIONS
0.000 0.100 0.200 0.300 0.400 0.500 0.600 0.700 0.800 0.900 1.000
0 5 10 15 20 25 30 35 40 45 50
Frequency (Hz)
Am
pl
it
u
d
e
Vertical TF at the Foundation Center
Horizontal TF at the Foundation Center
Figure 3. Horizontal and Vertical Response Transfer Functions of the Foundation Motion
(Rigid Massless Square Foundation)
0.000 0.005 0.010 0.015 0.020 0.025 0.030
0 5 10 15 20 25 30 35 40 45 50
Frequency (Hz)
Ab
so
lu
te Ro
tat
ion
(R
ad
ia
n)
Rocking Angle 1 Torsional Angle Rocking Angle 2
Figure 4. Coupling Response Transfer Functions of the Foundation Motion
0.00 0.10 0.20 0.30 0.40 0.50 0.60 0.70
0.1 1 10 100
Frequency (Hz)
S
p
e
ctr
al
Ac
ce
le
ra
tion
(
g
)
Incoherent Motion
Coherent Motion
Figure 5. Foundation Motion in the Horizontal Direction (5% Damping)
(Rigid Massless Square Foundation)
0.00 0.05 0.10 0.15 0.20 0.25 0.30 0.35 0.40 0.45
0.1 1 10 100
Frequency (Hz)
S
p
e
ctr
al
Ac
ce
le
ra
tion
(
g
)
Incoherent Motion
Coherent Motion
X Y
Z
Elev.
0
-21
North
5
20 1
0 0.1 0.2 0.3 0.4 0.5 0.6 0.7 0.8 0.9 1
0.1 1 10 100
Frequency (Hz)
S
p
e
ctr
al
Ac
ce
le
ra
tion
(
g
)
Coherent Motion Incoherent Motion
Figure 8. Comparison of Horizontal Response Motion (5% Damping) at Elevation 57 ft
0 0.1 0.2 0.3 0.4 0.5 0.6 0.7
0.1 1 10 100
Frequency (Hz)
S
p
e
ctr
al
Ac
ce
le
ra
tion
(
g
)
Coherent Motion Incoherent Motion
REFERENCES
1. Abrahamson, N., (1992), “Spatial Variation of Earthquake Ground Motion for Application to Soil-Structure Interaction”, EPRI Report No. TR-100463, March.
2. Abrahamson, N. (2005), “Updated Coherency Model” Report Prepared for Bechtel Corporation, April.
3. Kausel, E., Manolis, G., (2000), “Wave Motion in Earthquake Engineering,” WIT Press, Southampton, Boston.
4. Ostadan, F., Deng, N, Costantino, C. (2003), “River Protection Project - Seismic Analysis of Vitrification Buildings,” SMiRT17th Confrence, Prague, Czech Republic, August.
5. SASSI2000, Lysmer, J., Ostadan, F, Chin, C, (1999), “SASSI – A System for Analysis of
Soil-Structure Interaction”, Geotechnical Engineering, Department of Civil Engineering, University