Reliability Based Comparison of Ductility and
Energy Based Design
Kuldeep Kaushik
1, Ritukesh Bharali
2Graduate student, Department of Civil Engineering, Assam Engineering College, Guwahati, Assam, India1
Graduate student, Department of Civil Engineering, Assam Engineering College, Guwahati, Assam, India2
ABSTRACT: In this paper, a reliability based study has been incorporated to compare the categories of Performance Based Seismic Design (PBSD) of a reinforced concrete frame which are the ductility based design and the energy based design respectively. For this purpose, a two dimensional reinforced concrete frame consisting of one bay and one storey is modelled in Opensees 2.4.0 in order to evaluate the capacity of the structure. Based on the analysis results, an equivalent bi-linear model is developed and the two different limit states are defined based on the ductility demand and overall damage index(ODI) of the structure whereby material property of concrete, steel and loads are considered as the random variables. A dynamic analysis has been carried out in Opensees 2.4.0 on the bilinear model by varying the peak ground acceleration (PGA) from 0.05g to 0.4g of the simulated results of the El-Centro earthquake to quantify its non-linearity in damage index scale and ductility factor scale. The Damage Index (DI) has been computed from the modified Park and Ang Damage Index while the Ductility factor (DF) has been obtained from the top node displacement of the structure. It has been observed that at low PGAs, DF has higher values, as the structure does not yield . With increment in the PGAs, it is seen that, DI values are greater than DF after a certain PGA level. Also fragility curves has been developed where probability of failure has been plotted against PGA, for both ductility and energy based design for the respective durations of 20-25 and 40-50 seconds and it has been observed that at higher values of PGA, pF values for DI will be greater than that of ductility which establishes the fact that a Damage index or energy based design is better than ductility based design for higher PGA levels.
KEYWORDS:Opensees, Damage Index, Ductility, Reliability, Peak ground acceleration, bilinear.
I. INTRODUCTION
A realistic characterization of potential structural damage is the prime aspect of performance-based seismic design (PBSD), which has been a forefront area of research in earthquake engineering, over the last decade. Three broad categories of PBSD are classified on the basis of various approaches for characterization of structure damage, viz., displacement or ductility based, energy based and lifecycle cost based method. It has been observed that, ductility based design is most commonly used in practice, in which the structure is designed for a certain target displacement, maximum inelastic inter-storey drift, ductility demand, etc. Since this method adopts an inelastic approach for determining structure damage in the event of an earthquake loading, it is highly preferable over conventional elastic and force-based methods. However, this method does not account for the cumulative hysteretic energy, which the structure dissipates, under cyclic loading during the advent of a seismic excitation. Hysteretic energy has been taken into consideration in energy based design, which combines the cumulative energy demand along with the ductility demand. Hence a reliability based study has been carried out, to compare ductility and energy based design, with uncertainties in material property and loadings.
Celarec and Dolseck[1] study on the parameter modeling uncertainty on reinforced concrete frames under seismic
DOI: 10.15680/IJIRSET.2014.0310066
seismic response parameters whereas, lesser important parameters are the mass of the structure, the concrete strength, the yield rotation in the columns, and the effective slab width.
Lu et. al.[7] has discussed about collapse simulation of RC frame. For this study, considered structure is three storey 3D model with four column without considering slab or wall. For simulation purpose, these frame is modeled as strong beam and weak column. Instead of infinite element method, distinct/discrete element method is used in 3DCollap1.0 program. Simulation was done considering El Centro earthquake data. After that, simulation based on result is compare with laboratory based test result and it fits well under consideration minor and moderate earthquake data.
Alam and Kim[6] show on effect of seismic response considering different types of material modeling of RC frame. For
modeling of concrete, used models are Kent-Scot-Park model and Popovics-Saenz model and for reinforcement used
models are 1DJ2 plasticity model and smooth inelastic Menegotto-Pinto model. Considering these material property, a
two storey two bay RC frame is modeled in computer program OpenSees. The element type is used with distributed plasticity with five integration points. Here recorded response was taken as roof displacement and limit state was also based on that. To obtain failure probability, reliability methods first order second moment and important sampling were used and to compute the structural reliability a freeware reliability tools called Risk tools software was used. In their result, it was observed that Popovics Saenz concrete model with smoothing parameter shows smooth continuous loading unloading displacement response in quasi-static cyclic loading. For steel, smooth response was given by M-P model.
Faleiro et al[8]discuss about the plastic damage model of RC frames. For their study they had consider a five storey
reinforce concrete frame model. Considered input motion was taken as Kobe earthquake ground motion. In the study, element wise and global damage index were evaluated. Result shows that damage concentrated on first floor column. Damage index of beams was higher than the columns damage index.
II. PROCEDURE
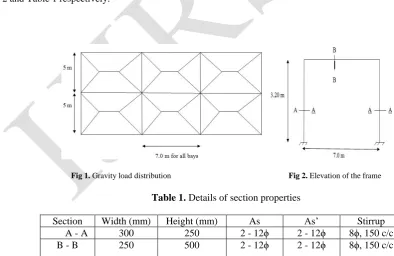
A two dimensional RC frame consisting of 1 bay and 1 storey is considered for analysis in OpenSees 2.4.0. In addition to its self weight, distributed dead load and live loads are considered, pertaining to Indian Standard code of practice. Gravity load distributions from the adjacent beams are shown in Fig 1. The elevation and frame details are provided in Fig 2 and Table 1 respectively.
Fig 1. Gravity load distribution Fig 2. Elevation of the frame
Table 1. Details of section properties
Section Width (mm) Height (mm) As As’ Stirrup
A - A 300 250 2 - 12ϕ 2 - 12ϕ 8ϕ, 150 c/c
Mander’s model is used in the concrete section to represent confinement and unconfined concrete in the section. In order to ensure the ductility of the frame, reinforcements are modelled as Guiffre-Menegotto-Pinto steel material. The cross-sections of beam and column elements are divided in mesh depending on the stress level. Core concrete is meshed into 5 x 20 grid in both, beams and columns, whereas cover concrete is meshed as 1 x1 grid. Uncertainty in material properties are provided in Table 2.
Table 2. Uncertainty in material properties
Parameter Distribution Type Mean Upper Limit Lower Limit Unit No of samples
Fck Normal 20 - - MPa
50
Fy Normal 415 - - MPa
Es Normal 200 260 GPa 140 GPa
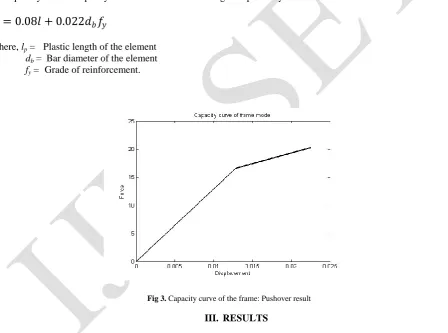
The frame elements are modelled as two node elements with concentrated plasticity as both ends. Paulay and
Priestley’s[11] plastic length formula (Eqn. 1) is used, in the non-linear pushover analysis that was carried out
subsequently and the capacity curve has been shown in Fig.3 respectively.
𝑙
𝑝= 0.08𝑙 + 0.022𝑑
𝑏𝑓
𝑦 (1)Where, lp = Plastic length of the element
db = Bar diameter of the element
fy = Grade of reinforcement.
Fig 3. Capacity curve of the frame: Pushover result
III. RESULTS
DOI: 10.15680/IJIRSET.2014.0310066
are employed for solving the non-linear dynamic system in this study, based on the convergence criteria. If in one approach, the system fails to converge, the next immediate method is chosen for analysis.
Modified (theta in modified) Park and Ang damage index (Eqn. 2) has been used for computation of damage index (DI) of the structure.
DI P & A = 𝛿𝜃𝑚
𝛿𝜃𝑢
+
𝛽𝛿𝜃𝑢 𝑃𝑦
𝑑𝐸 ℎ
(2)Its first part corresponds to ductility and the second part corresponds to cumulative hysteretic energy dissipation of the structure under cyclic loading (SGM, in this case). In the modified analogy, it is assumed that damage is the structure occurs only after its yielding commences. The modified damage index has also been scaled from 0 to 1, i.e., from no damage to ultimate collapse state. Ductility factor (DF) has been calculated based on the demand-capacity ratio computed from the top node displacements. Limits states has been defined for both, ductility factor and DI.
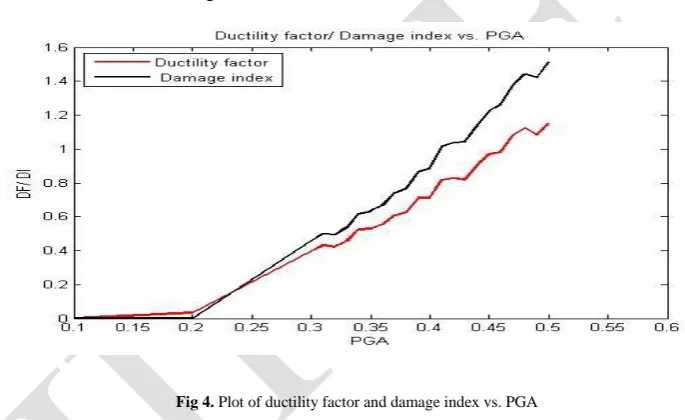
It has been observed in the preliminary study that, at low PGAs, DF has higher values, as the structure does not yield and hence first part modified ductility is zero. With increment in the PGAs, it is seen that, DI values are greater than DF after a certain PGA level shown in Fig.4.
Fig 4. Plot of ductility factor and damage index vs. PGA
This establishes the very objective of the study, which puts forward that a design based on stochastic analysis performs better than deterministic design in a random environment, and also, proves that a DI or energy based design is better than ductility based design for high PGA levels.
Fig 5. Plot of Probability of failure (pF) vs PGA for 20-25 seconds duration of earthquake
In Fig 5, with low duration of earthquake (20-25 seconds), it can be seen that at up to 0.26 PGA, the DI and ductility curve remains close to zero pF value as the structure is in linear zone. But with increase in PGA, the two curves bifurcates, as dissipation of energy takes place and structure enters the non-linear domain and DI results in greater value than ductility for higher PGA.
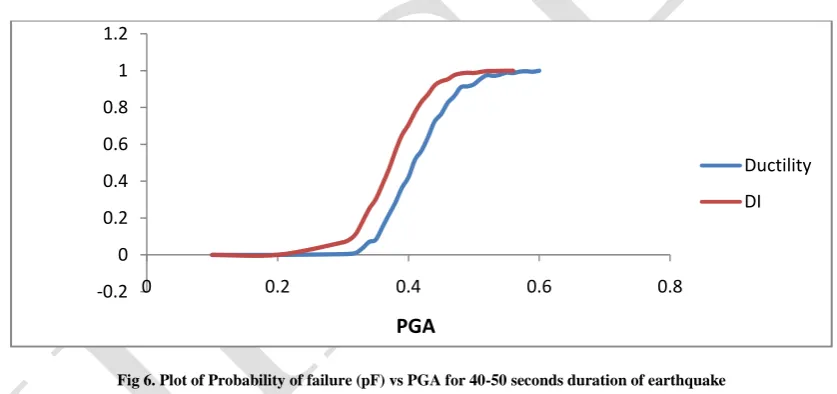
Fig 6. Plot of Probability of failure (pF) vs PGA for 40-50 seconds duration of earthquake
In Fig 6. as the duration of earthquake is increased (40-50 seconds) there is a slight increase in the corresponding DI value, even though the PGA remains same. With more number of cycles, the energy dissipated increases, hence, the DI curve separates from that of ductility earlier, that is at 0.22PGA in this case, than that of the 20-25 seconds curve.
IV.CONCLUSION
From the paper the following points may be concluded:
It has been observed in the preliminary study that At low PGA, Damage Index (D.I) and Ductility values
remain close to zero and same, as the structure remains in the linear zone and energy is not dissipated. However, with an increase in PGA values, the DI curve separates from that of ductility, as dissipation of energy takes place in the form of cracks and beam column joint failure. Hinges are formed and the structure enters the nonlinear domain.
-0.2 0 0.2 0.4 0.6 0.8 1 1.2
0 0.1 0.2 0.3 0.4 0.5 0.6 0.7
Ductility
DI
pF
PGA
-0.2 0 0.2 0.4 0.6 0.8 1 1.2
0 0.2 0.4 0.6 0.8
Ductility
DI
DOI: 10.15680/IJIRSET.2014.0310066
As the duration of earthquake increases, there is a slight increase in the corresponding DI value, even
though the PGA remains same. With more number of cycles, the energy dissipated increases; hence, the DI curve separates from that of ductility earlier for duration greater than that of the earlier one.
From the graph plotted between the probability of failure against PGA, for both ductility and energy based
design for the respective durations of 20-25, 40-50 and 60-70 seconds, it has been observed that at higher values of PGA, pF values for DI will be greater than that of ductility, establishing the very objective of the study, which puts forward that based on the probabilistic design of a model in a random environment the DI or energy based design is better than ductility based design for high PGA levels.
REFERENCES
[1] D. Celarec and M. Dolek. The impact of modelling uncertainties on the seismic performance assessment of reinforced concrete frame buildings. Engineering Structures, 52:340 – 354, 2013.
[2] IS 456 : Plain and reinforced concrete code of practice, 2000.
[3] IS 875 (part 1): Code of practice for design loads (other than earthquake)for buildings and structures : Dead loads - unit weights of building material and stored materials, 1987.
[4] IS 875 (part 2): Code of practice for design loads (other than earthquake) for buildings and structures: Imposed loads, 1987. [5] IS 1893 (part 1): Criteria for earthquake resistant design of structures, 2002.
[6] J.H. Yi, S.H. Kim, and S. Kushiyama. Pdf interpolation technique for seismic fragility analysis of bridges. Engineering Structures, 29(7):1312 –
1322, 2007.
[7] X. Lu, J. Wanga, and F. Zhang. Seismic collapse simulation of spatial RC frame structures. Computers and Structures, 119:140 – 154, 2013.
[8] J. Faleiro, S. Oller, and A.H. Barbat. Palstic-damage seismic model for reinforced concrete frames. Computers & Structures, 86:581 – 597, 2008.
[9] S. Ghosh, D. Datta, and A.A. Katakdhond. Estimation of the parkang damage index for planar multi-storey frames using equivalent single-degree
systems. EngineeringStructures, 33(9):2509 – 2524, 2011.
[10] S. Mazzoni, F. McKenna, M.H. Scott, and G.L. Fenves et al. OpenSees Command Language Manual. Open System for Earthquake Engineering
Simulation (OpenSees), July 2007.
[11] T. Paulay and M.J.N. Priestley. Seismic Design Of Reinforced Concrete and Masonry Buildings. Jhon Willey & Sons, Inc, 1992.
[12] Y.J. Park and A.H.S. Ang. Mechanistic seismic damage model for reinforced concrete. Journal of Structural Engineering, 111(4):722 – 739,