COTRANS:
A
Program for Cotransduction Analysis
Mary B. Berlyn* and Stanley Letovsky?
*Department of Biology School of Forestry and Environmental Studies, Yale University, New Haven, Connecticut 06520, and TLetovsky Associates, 286 West Rock Avenue, New Haven, Connecticut 06515
Manuscript received October 7, 199 1 Accepted for publication January 17, 1992
ABSTRACT
COTRANS is a program for analyzing cotransduction data. It calculates distances from pairwise cotransduction frequencies, computes crossovers required to obtain each observed recombinant class, and applies rules to draw conclusions about order. The rules are based on the correlation between the frequency of the classes and the number of required crossovers for each possible ordering compatible with the distance calculations. The procedure emulates a geneticist’s stepwise analysis of
the data by first calculating distances, then looking for obvious three-point ordering conclusions, and finally proceeding to a complete crossover analysis. It reports results from each step of the analysis and an overall conclusion. COTRANS provides significant gains in speed and convenience over hand analysis, particularly for multipoint crosses with several recombinant classes.
C
OTRANS is a program for automating the cal-culation of intermarker distances and the infer- ence of orders from transduction data. T h e program takes as input donor marker information and recom- binant class frequencies and first calculates pairwise cotransduction frequencies and distances. It then ex- amines trios of selected and unselected markers in a way that partially simulates a geneticist’s initial scan
of the data for conservative conclusions about marker
order. The third step is a crossover analysis that
computes the number of crossovers required to gen- erate the observed recombinant classes for each pos- sible ordering of the markers and identifies the most
likely orderings based on rules that compare class
frequency and crossover number.
We have implemented COTRANS versions both
on a Unix platform and on PC or Macintosh com-
puters. T h e Unix version of COTRANS is linked to the Escherichia coli Genetic Stock Center Database, which describes strain genotypes in terms of alleles,
structural mutations, mating type, and plasmids and
also contains information on pedigrees, genes, gene products, phenotypic and other properties of muta- tions, linkage map position, and references. T h e role of the database with respect to the analytical software
is to store raw data, computed conclusions and editing
decisions and to verify or update marker and strain names and characteristics. This version of COTRANS is also linked to a mapping utility; it sends its output
to a constraint propagation inference engine called
CPROP that constructs maps from distance and or-
dering constraints (LETOVSKY and BERLYN 1992). T o
date, we have used COTRANS primarily to reexam-
ine published cotransduction data and to integrate
such data via CPROP with new mapping data that
Genetics 131: 235-241 (May, 1992)
include sequences and restriction maps as well. T h e simpler Macintosh and PC versions of CO-
TRANS are independent of CPROP and the data-
base. [These versions, called XCoTRANS, are imple- mented on top of MicroSoft’s Excel spreadsheet pro-
gram (versions
2
or higher) and are available on floppydisk upon request. Requestors must supply their own
licensed copy of Excel, which for the PC requires
Windows capability.] These stand-alone versions ana- lyze individual cotransduction results; the integration and comparison of independent experimental results require explicit collation, examination, and evaluation by the user. T h e following sections describe the con- ceptual details of the analysis and some of the details of the implementation.
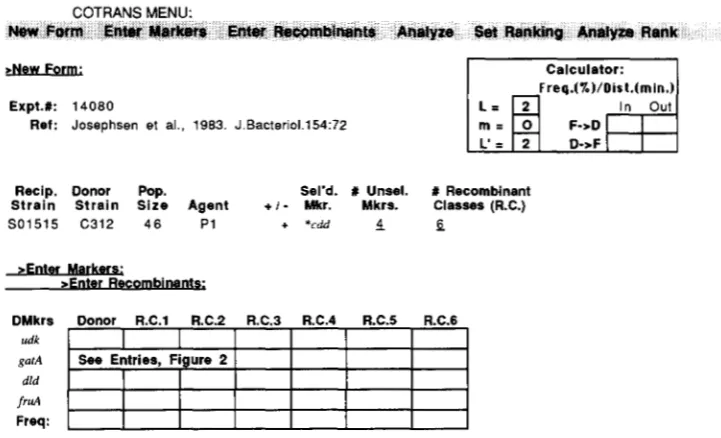
Form of entry and results: Figures 1 and 2 show the entry forms with a sample entry of marker infor-
mation, and the returned templates and computa-
tions, as they are presented in the XCoTrans version. In this version entry of a new dataset is initiated by
selecting New Form on the COTRANS menu. T h e
prompts and menu commands are shown in boldface in the figures. Experimental information (reference,
donor and recipient strains, population size, agent,
selected marker, number of unselected markers and
number of recombinant classes observed) is entered. In the Unix version, the selected and unselected donor markers and the donor and recipient strains are veri- fied as known alleles or strains within the database. When the field indicating the number of recombinant classes is filled (“6” in the example shown in Figure
l), a template for entry of the frequency and genotype
for each of the indicated number of classes is pre-
sented. In XCoTrans, the menu option Enter Mark-
Freq.(X)/Dist.(min.)
Expt.t: 14080 In Out
Ref: Josephsen et al.. 1983. J.Bacterio1.154:72 m = F->D
Strain Strain Size Agent + / - Mkr. Mkrs. Classes (R.C.) Recip. Donor Pop. Sel’d. t Unsel. t Recombinant
SO1515 C312 4 6 P1 + *cdd 4 6
DMkrs Donor R.C.l R.C.2 R.C.3 R.C.4 R.C.5 R.C.6
udk
See Entries, Figure 2
I
gorA
1
1
I
f r d
Freq:
I
I
I
1
FIGURE 1 .-GOTRANS form and first-stage entries for a set of cotransduction data from Table 3 of JOSEPHSEN, HAMMER-JESPERSEN and
HANSEN (1983). The format shown resembles the appearance of the XCoTrans forms rather than the Unix format. Column Abbreviations: Recip., recipient; DMkrs, donor markers; R.C. and Rec., recombinant class, Sel’d. Mkr., selected marker; # Unsel. Mkrs., number of unselected markers. Shown in boldface are the fields presented in response to the New Form command. In response to the Enter Markers
choice on the menu, the column for entering the donor markers and a template for indicating the genotype of the donor and of each recombinant class are presented. (See Form of entry section.) The calculation table which appears on the upper right of the opening screen and of the figure converts frequency in percent to distance in minutes (F + D) or distance to frequency (D + F) for ad hoc entries placed in the “In” box, and also allows setting of the length parameters ( L , m , n ) in the cotransduction calculation. (see Calculation of cotransduction distance section). The L and m parameters entered here will be used in the subsequent run of either a COTRANS analysis or an ad hoc
calculation.
enter recombinants generates a table for indicating
the genotype (by entering
+
or -) for the donor andrecombinant classes, along with the frequency of each class. T h e completed table for an example entry is
shown at the top of Figure 2. When entries are com-
pleted, the Analyze function on the menu calculates
the cotransduction frequencies and the distances be- tween the selected marker and the unselected mark- ers, as described below. (These calculations are shown
in the unenclosed table in Figure 2.) COTRANS then
analyzes the data in the steps described below, pre- senting the results in the 3-point orderings (closer marker) and crossover analysis tables in Figure
2.The box on the upper right in Figure 1 is the
cotransduction calculator, which converts cotransduc- tion frequency and distance using formulas derived from Wu (1966) and described in the following sec- tion. It is used for ad hoc entries of either frequency o r distance. T h e column on the left of the table
specifies length parameters L and m (standard default
values are shown) in the calculation (see below). T h e parameters entered here apply then for both the
COTRANS program and for distance/frequency con-
versions for ad hoc entries into the calculator.
Calculation of cotransduction distance: T h e first step of the analysis is straightforward. T h e frequency
of cotransduction of an unselected donor marker with
the selected marker is calculated by summing the
frequencies of all recombinant classes which carry that
unselected marker. T h e distance between the two
markers is computed from the cotransduction fre- quency. Two formulas, using somewhat different as-
sumptions, have been commonly used for this com-
putation. T h e assumptions are discussed by LOW
(1987) and by SANDERSON and ROTH (1983, 1988)
We use the formula of Wu (1966) in its simplest,
reduced form for the default calculation in CO-
TRANS:
d = L * ( 1 - 3 J f )
where d is distance,
f
is cotransduction frequency, andL is the estimated length of the chromosomal segment
transferred. For P I transduction of E . coli, L is usually
set at 2 min (using the standard 0-100-min coordi-
nates for the linkage map), and the length for P22
transduction of Salmonella is approximately 1 min. In
COTRANS we use 2 as the default value, with alter-
nate values set by the user, as indicated below. Chang-
ing the value of L may be useful not only for analysis
of results with different vectors and species, but also in attempting to resolve systematic discrepancies be- tween physical and genetic maps.
An application of a less reduced formula was pro-
posed by SANDERSON and ROTH (1 988) for transduc-
tions using insertion mutations as selected or un-
Recombination Data Entered:
DMkrs
udk
Donor R.C.l R.C.2 R.C.3 R.C.4 R.C.5 R.C.6
+
-+ + - +
-
I
garA
+ I - I - I - I
- [ - +dld
-
+ +-fruA + - + - +
Freq.: 1 1 1 5 5 9 7 4 4
+ANALYZE
Freq. Distance
udk 4 1.32
garA 1 5 0.94
dld 2 6 0.72
fnul 2 2 0.79
-Point Orderings (Closer Marker) M1 M2 M3 Both Far Ratic *cdd gatA udk 4
*cdd dld udk 4
*cdd dld garA
7 1 5 0.47
dld *rdd fruA 1 5
flu4 *cdd udk
1 5
fru.4 *cdd garA
4
Crossover Analysis
Class: R.C.l R.C.2 R.C.3 R.C.4 R.C.5 R.C.6
Freq.: 5 9 1 5 1 1 7 4 4
Orderings Considered: # of Crossovers
u d k gatA frrul *cdd dld udk gatA *cdd dld f r d
2 2 4 2 2 4
2 4 4 2 2 4
*cdd dld f r d garA rrdk
2 2 2 2 2 2
frlul *cdd dld gatA rrdk
2 4 2 2 2 4
gatA *cdd dld frrul udk
2 2 4 2 2 4
gatA fruA *rdd dld ndk
2 4 4 2 2 4
udk %id dld fnul gatA
2 2 2 2 2 4
udk fnul *cdd dld gatA
2 4 2 2 2 2
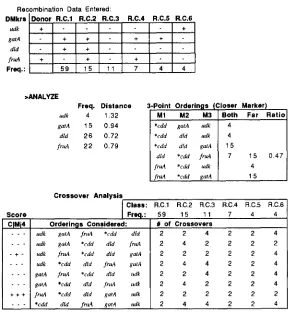
FIGURE 2.-The genotype and frequency entries (continuing from Figure 1 entry) for the set of data cited in the previous figure. The
sample genotypes and frequencies are shown at the top. The Analyze command on the menu calculates the frequency and distance values
and presents all closer marker trio results (shown in the center of the figure), and (shown in lower part of figure) a crossover analysis table. (The default values of parameters were used in the calculation.) This table shows eight orderings and the number of crossovers for each recombinant class within each ordering, as well as the test results for each class in the leftmost column. Abbreviations for tests are C for closer marker consistency, M for monotonicity test, and 4 for the least fours test. Other abbreviations as in Figure 1 .
accommodates this option. This modification corrects for the length of the inserted segment, which has no
homologous region in the recipient. T h e modified
expression is presented as:
( L
-
m)'-
(L-
m-
d)'(L
-
m-
n-
d)'l / f = 1
+
where m and n are lengths of an insertion within the
selected and unselected markers, respectively. When
m and n are 0, this reduces to the preceding, simpler
WU equation.
In the most common non-default case, a selectable
( T n ) insertion is used as the selected marker, and this
also reduces to the simpler formula, with ( L
-
m )substituted for L . When an m value is entered in the calculation table, the ( L
-
m) value, L ' , is used in the calculation. This is consistent with the physical reduc- tion of the region eligible for recombination with therecipient chromosome to the shortened length ( L
-
m). This is approximately a 10% reduction in the
distance calculation for a selected 10-kb TnlO inser-
tion in a P1 phage transduction. A nonzero n value,
however, does not provide an easily soluble equation
for d, and families of standard curves have been used
to make these corrected conversions (SANDERSON and
ROTH 1988). This approach could be supported by interpolation of values in look-up tables, and this will be included as an option in the program if the correc- tion proves frequently useful.
Scanning of marker trios-closer marker analysis:
Once the cotransduction distances have been calcu- lated, a geneticist often inspects the data in order to draw the most obvious conclusions and thereby limit
the number of ordering possibilities that must be
examined by crossover visualizations. This initial scan of the data is not always perceived as an explicit or consistently applied step in the analysis, so the for- malism which we introduce here may not look familiar or be universally used. (In fact, as noted below, there are conditions in which its use is not appropriate, and it is bypassed in those cases.) It formalizes the exami- nation of three markers (two unselected and one selected marker) to determine which lies between the other two. For purposes of automation, we must set conditions for use (or bypassing) of the test and specify a criterion for accepting the betzueenness conclusion.
In transduction, two crossovers are required to
recipient linkage group, and since the donor DNA in a transducing phage is of restricted length, any incor- poration event that will require more than two cross- overs will not be a high frequency event. In examining
a trio of markers, namely the selected marker S and
two unselected markers of calculated distance from S ,
the two possible configurations consistent with dis-
tance data (ignoring mirror image configurations) will
differ in the number of crossovers required to cotrans- duce the more distant marker in the absence of the
nearer marker. This will be reflected in the frequency
of the two types of recombinant classes. For the order
Near S Far
two crossovers are required to cotransduce either S
and Near, S and Far, or all three donor markers; however, for the order
S Near Far
four crossovers are required to cotransduce S and Far
in the absence of Near. Thus cotransduction of S and
Far only should be a rare event when Near is between
S and Far, but may be a common event when S is
between Near and Far. We implement this between-
ness determination by examining the ratio of recom-
binants carrying both Near and Far donor markers to
recombinants carrying the Far marker only. If the
frequency of recombinant classes carrying both is
much greater than the frequency of classes with the
Far marker in the absence of the Near marker, it is
concluded that Near is between S and Far. T h e nu-
merical criterion for “much greater” frequency is ob- viously a subjective one; we currently use:
f F a r W e a r
,
3.5.fFar Alone
T h e three-point orderings inferred from the closer
marker consistency test, and the corresponding “Far
only’’ and “Both” frequencies are shown at the right of
the frequency/distance calculator in Figure 2.
In some cases, this part of the analysis is not appro- priate and it is bypassed. These cases usually involve extremes of marker distances, and we set criteria
which will result in bypassing this analysis for a given
pair of markers. If the distance between the selected
marker S and either the Near or Far marker is large,
the ratio is not meaningful. Such a condition is often found in experimental data, particularly if there are more than two unselected markers in the cross; as a result, closer marker analysis is often limited to the two closest markers. (However, in some instances the additional comparisons are very useful. For markers
SBCD with B, C and D having increasing distances
from S, and distance SC and SD very similar and large
in comparison with BC, observation of low co-occur- rence ratio for C and D is strong evidence for the
order CSD.) COTRANS draws no ordering conclu- sions if the marker cotransductions are too small, as specified by the following criteria:
If Near’s frequency is less than 5 % (distance > 1.5 min), or
if Near’s is less than 20% and Far’s is less than 2%, no order is concluded in this step.
If Near is so close to S that separation rarely occurs, the ratio will be high for either orientation of markers,
therefore we exclude these cases as well, using a
cotransduction frequency greater than 90% as the
numerical criterion for bypassing the analysis:
If Near’s cotransduction frequency is greater than 90%, no conclusion is drawn in this step.
Some of the conclusions derived from the closer marker analysis will be drawn as well from the cross-
over analysis that follows, and it may appear that the
latter is sufficient, if all possible orderings are exam- ined, and that this trio-examining step is therefore unnecessary. In fact, the results from this analysis are used to evaluate the full orderings produced in the next stage. Moreover, the closer marker analysis can draw conclusions in cases where the crossover analysis does not. Even in cases where the crossover analysis suffices to draw a conclusion, the separation and dis- play of separate steps is helpful to a user in evaluating
the results. In most cases the three-point analysis
provides very strong, conservative conclusions. These
conclusions can be examined in the closer marker
table (Figure
2),
and subsequent all-marker orderingsare scored for consistency with those three-point re- sults.
Crossover analysis: For this analysis, which by con- trast with the preceding one will be quite recognizable as an implementation of the standard hand analysis,
different orderings are evaluated according to the
number of crossovers required to generate each ob-
served recombinant class. In a complete crossover
analysis a geneticist enumerates all possible orderings compatible with distance results, visualizes the cross- overs required for each possible ordering to produce each observed recombinant class, and retains as plau- sible only those that assure that recombinant classes
that require more than two crossover events occur
only at low frequency. Those orderings which corre- late high frequency of the class with low number of crossovers are chosen as the most likely orderings. If this correlation holds for more than one ordering, a further judgment may be based on minimizing total number of four-crossover events required to generate
all recombinant classes under the ordering. T h e au-
tomated version of these procedures is implemented in COTRANS in the following steps:
Enumerating orderings: T h e crossover counts for
each ordering are often a tedious part of hand analysis
This is usually true, even if a preliminary examination
of the data has restricted the number of possible
orderings that must be examined. Therefore, the
rapid enumeration of orderings and computing of
crossovers required is a particularly important part of
the program.
Although the number of markers in a cotransduc- tion experiment is typically no greater than five, in-
cluding the selected marker, there are 5! = I20 pos-
sible orderings of 5 markers. Although such a number
is not so large as to appreciably slow the workstation version, it is burdensome within the Excel-imple- rnented versions, and in either case, it is undesirable
to confront the user with this many possibilities. A
smart enumeration strategy is therefore used to gen- erate orderings for crossover analysis, which avoids
generating uninteresting orderings. Two uninterest-
ing classes of orderings are mirror images of orderings
which have been considered, and orderings which
contradict the distance data. T h e enumeration strat- egy generates only orderings that are consistent with the distances from the selected marker, and it gener- ates no mirror images. It works as follows.
The most frequent unselected marker is assumed to lie directly to the right of the selected marker. This assumption breaks the mirror symmetry, eliminating
half the permutations. The other markers have a left/
right bit associated with them. T h e vector of left/ right bits is treated as a binary counter for enumera-
tion purposes: it begins with all O's, then a 1 is added
on each iteration, carrying as necessary, until it is all 1 's. T h e marker order is determined on each iteration
by placing each marker on the left or right of the
selected/most frequent pair, according to the value of
its left/right bit, and ordering the markers on each
side of this pair in accordance with their distances from the selected marker. This last step guarantees consistency with the distance data. For three markers
this procedure generates only
2
of the 6 possibleorderings; for 4 markers, 4 of 24; and for 5 , 8 of a possible 120 (in general 2"-' us. n! for n markers). These are the orderings presented on the COTRANS form along with the crossover counts for each recom- binant class and the test results (Figure 2).
Note that the enumeration strategy takes marker
distances completely literally. It does not make statis- tical judgments about small differences. Nor does it set a numerical criterion for ignoring such values, as in the closer marker analysis. When unselected mark- ers are very close to each other, the small differences in their cotransduction frequency will cause the enu- meration algorithm to ignore orders that reverse those markers, so that legitimate ordering candidates may be excluded from the analysis. T o avoid this the user may examine the distances and three-point or-
derings for close adjacent markers and select addi-
tional orderings to be evaluated, as described below
in the section on Evaluating additional orderings.
Computing crossovers: Once an order has been gen-
erated, the number of crossovers required to produce
each recombinant class is computed. Each recombi- nant class is represented as an assignment of same/ different bits to the set of markers: a 1 means the recombinant carries a different value for that marker than the recipient parent; i.e., it carries the donor marker. All recombinants have a 1 value for the
selected marker. These same/different bits are ar-
ranged in the order dictated by the marker ordering
under consideration, and a 0 is placed on either end
of the sequence to signify the fact that the recipient parent chromosome still constitutes the major portion
of the recombinant's chromosome. In the resulting
binary sequence the number of crossovers is equal to the number of times a bit is followed by a different bit-a 0 after a 1, or vice versa. Since there is at least one 1 bit in the sequence, representing the selected
marker, and a 0 at each end, the minimum number
of crossovers is two, reflecting the biological mini- mum.
T h e crossover counts for each class and ordering
are shown to the user as an almost immediate response
to the command in the Unix version, and in less than a minute in the other versions. It is shown in Figure
2 on the right-hand side of the crossover analysis box,
with the test results on the left.
Tests: T h e complete crossover analysis examines all
possible orderings to ensure that (1) four-crossover
events occur only in low frequency recombinant
classes, and
(2)
the closer-marker betweenness con-straints are not violated; and (3) if several classes satisfy these two demands, the one(s) with the least number of total crossovers (for all classes) is identified. For
each ordering generated in the above COTRANS
procedures, the three tests are applied and reported as follows.
1. Monotonicity test: T o enforce the principle that
recombinant classes that require more than two cross-
overs between the donor and recipient chromosomes will occur less frequently than those that require only the two crossovers necessary for incorporation of any
donor DNA, the recombinants are enumerated in
order of decreasing frequency, and a check is made
that in progressing down this list, the number of
crossovers is nondecreasing. An ordering that passes
the monotonicity test is marked with a
+
in theM
column of the crossover analysis table, as shown in
Figure 2.
2. Closer marker consistency: COTRANS then deter- mines whether each proposed ordering is consistent with the orderings produced in the preceding closer
marker analysis. Closer marker analysis produced be-
definitely in the middle, but the global order of the three may be forward or backwards. An ordering is closer-marker consistent if and only if every between- ness constraint is satisfied in the ordering. T h e result of this test is indicated in the
C
column of the CO- TRANS form.3. Least-fours test: Further examination of crossover numbers can be used to eliminate orders that are monotonic as described, but require an unlikely num- ber of crossovers to give frequent or numerous classes. T h e monotonicity test is satisfied, for example, for
classes A, B, and C, ordered by frequency, if the
number of crossovers required is 2, 2 and 2, respec- tively, or 2, 2 and 4, or 2, 4 and 4, or even 4, 4 and 4. Yet the biological likelihoods argue that for most cases, the latter two occurrences, although monotonic, are extremely unlikely. We therefore also instituted the least-fours rule, which says that when more than one order is compatible with the closer marker analy-
sis and the monotonicity rule, that order which re-
quires the fewest number of four-crossover events is selected and the other orders are rejected. This result is reflected in an overall selection column in the Unix version. On the Macintosh and PC forms, it is pre-
sented in the “4” column, and the overall selections
correspond to
“+ + +”
scores in the CIM14 columns(Figure 2).
In the strongest cases, orders which fail the cross- over analysis have already been eliminated by closer marker analysis. However, when (1) the closer marker
test is not invoked because of low cotransduction
frequencies for some of the Far markers and (2) more than one possible order is returned, the least-fours test adds an additional level of discrimination against the four-crossover classes. T h e results of each test are visible to the user, which is helpful in resolving con- tradictions and evaluating the returned orders.
Evaluating the results: T h e above tests usually rule out all but one or two orderings. T h e orderings which
pass the tests are indicated by the
+
markings. In theUNIX version of COTRANS, linked to the Esche-
richia coli Genetic Stock Center database, only one complete marker ordering can be stored in the data- base. If more than one ordering survives all of these checks, the user is asked to choose among them by altering one of the
+
designations in the overall results column. The user may also override the automated result by selecting an order that was rejected by the above tests or reject all orderings, if she elects to use criteria other than those applied by COTRANS or finds no reason to prefer one selected ordering over another. (Such overrides are sometimes appropriateas a result of evaluations based on additional infor- mation or interpretations not used by the program.) Only those results marked with a plus sign are saved in the database; the original results can be regenerated
by rerunning the Analyze function. If all orders are rejected only the raw data and metric conclusions are stored in the database. T h e distances and orderings stored by COTRANS become available to the con-
straint propagator CPROP (LETOVSKY and BERLYN
1992) for use in constructing maps and map segments.
We store the values computed, and the record of any
action taken by the user to alter those values. By
storing this information as well as the raw data, we preserve a record of the process used to derive con- clusions.
T h e Macintosh and PC versions are intended for use by others in association with a database of their own devising. This leaves the number of orderings that can be stored and the format of the stored infor- mation to the individual user. T h e copy and paste functions provided by Excel can be used to store the results on summary pages.
Evaluating additional orderings: T h e algorithm for enumerating marker orderings is able to focus on a relatively small subset of the full set of permutations
because it only produces orderings that are compatible
with the distance data. For example, the algorithm
would not generate an order S A B where B was closer
to S than A , as determined by the distance values.
This strategy has one drawback, however: if the SA
distance and the SB distance are very similar, it may
be worth considering the S A B ordering. COTRANS
incorporates an option that allows the user to direct
it to consider alternative orderings. The set rank
menu option sets up a column of numbers on the form
that rank the markers in terms of their distance from the selected marker: 1 is the closest, 2 is the next
closest, and so on. Note that these rank numbers do
not imply an ordering: it need not be the case that the
marker ranked 2 is between 1 and 3 since markers
may be on different sides of the selected marker. The initial rank values are determined from the distances previously computed by COTRANS; however, users may modify these. For example, to force COTRANS to consider the possibility that A is closer to S than B ,
one would exchange their ranks. In the example in Figure 2, the user could obtain an evaluation of the
additional orderings with gatA and udk reversed by
calling the rank table and changing the ranking of
gatA and udk to 4 and 3, respectively. After the rank
values have been modified, the menu option analyze
DISCUSSION
This software attempts to emulate a geneticist’s
analysis of cotransduction data. It calculates distance, looks for obvious three-point conclusions, and then proceeds to a complete crossover analysis of all recom- binant classes. It draws an overall conclusion, but also reports each of the analyses separately to facilitate evaluation by the user. It is much speedier than hand
analysis for transductions involving three or more
markers. For two-point crosses, recombinant class en- tries are useful only for preserving the record, and
the independent cotransduction calculator alone is
adequate and quicker to use if record-keeping is not
the issue. T h e ability to set the Length parameters, L
and m , in the calculation is also a gain over hand analysis. Adding an option to set the length parameter
n as well is under consideration.
COTRANS, like the bacterial geneticist, does not routinely apply statistical analysis to the data, although an error term is added when used with the mapping program cited below. Many features of cotransduction analysis differ from standard recombination analysis,
and these determine the COTRANS approach as well:
the population analyzed is often a single large one,
selected for occurrence of two crossovers within a
small set of overlapping regions less than 100 kb long.
Co-occurrence of a nonselected donor marker with the selected marker is nearly unequivocal evidence for linkage at least corresponding to the maximum distance between ends of the transducing phage insert. Possible sources of error for this conclusion (sponta- neous mutagenesis, a second coincident transduction
event at a different region of the chromosome, or
atypical sizes of phage inserts) are rare occurrences
and will not significantly affect the accuracy of the
cotransduction distance estimate. More likely sources
of error are failure to score the phenotype associated
with a particular marker accurately and unambigu-
ously and nonrandom incorporation or recombination
of regions. It is not clear that any of these errors are normally distributed and would be handled effectively
by statistical analyses based on the assumption of such
a distribution. Despite these specialized features of
cotransduction analysis, components of the CO-
TRANS procedure may be applicable to other types of recombination analysis. We are exploring the use of the class enumeration and crossover counting and
ranking algorithms with eukaryotic recombination
analysis.
COTRANS was initially developed to facilitate in- troduction of cotransduction data into CPROP, a
map-generating program (LETOVSKY and BERLYN
1992). CPROP analyzes the ordering and distance
constraints submitted and makes conclusions that may tighten them or may report conflicts resulting from combining them. T h e Macintosh and PC (XCoTrans) versions were developed to provide the recombination analysis functions in a free-standing and more distrib-
utable form. In the XCoTrans versions, the combi-
nation, inspection, and integration of related results are performed by the user. In all versions, resolution of conflicts and evaluation of conclusions are left to the expertise of the user.
This work is supported by the National Science Foundation NSF- DIR9019995 and previously as a supplement to NSF-BSR8807021.
LITERATURE CITED
JOSEPHSEN, J., K. HAMMER~ESPERSEN and T. D. HANSEN, 1983 Mapping of the gene for cytidine deaminase ( c d d ) in Escherichia coli K-12. J. Bacteriol. 154: 72-75.
LETOVSKY, S., and M. B. BERLYN, 1992 CPROP: a rule-based program for constructing genetic maps. Genomics 12: 435- 446.
LOW, K. B., 1987 Mapping techniques and determination of chro- mosome size, pp. 1184-1 189 in Escherichia coli and Salmonella typhimurium, edited by F. C. NEIDHARD, J. L. INGRAHAM, K . B.
LOW, B. MAGASANIK, M. SCHAECHTER and H. E. UMBARGER. American Society for Microbiology, Washington, D.C.
SANDERSON, K. E., and J. R. ROTH, 1983 Linkage map of Salmo- nella typhimurium, Edition VI. Microbiol. Rev. 47: 410-453. SANDERSON, K . E., and J. R. ROTH, 1988 Linkage map of Salmo-
nella typhimurium, Edition VII. Microbiol. Rev. 52: 485-532. WU, T. T., 1966 A model for three-point analysis of random
general transduction. Genetics 5 4 405-410.