INTRODUCTION
To fly aircraft safely and effectively, pilots must properly use visual information about the relative positions of both stationary and moving objects in the environment. Unfortunately, mak-ing these visual judgments, includmak-ing judgments of an object’s motion in depth, can often be diffi-cult, especially under conditions of reduced visibility. This may be caused by factors that lead pilots to misperceive the distance to objects. A number of factors affect people’s percep-tions of distance. One important factor is a built-in bias identified by Gogel (1969), which he labeled the specific-distance tendency.It is the tendency for an observer to perceive an object as if it were at an intermediate distance, typically between 2 and 3 m. Under reduced viewing conditions this scalar (behaviorally meaningful) bias may exert an important influ-ence on distance perception. Other scalar in-fluences under reduced viewing conditions
involve residual oculomotor cues. These are unavoidable physiological states that exist in some fashion in any visual situation, even if an attempt is made to limit all other information. Gogel (1972) gave the name egocentric refer-ence distanceto the scalar perception of dis-tance provided by the combination of the specific-distance tendency and the residual oculomotor cues.
Far-Anchor Effect
When two points of light, separated in stereoscopic depth, are presented to an ob-server individually, the obob-server’s perception of their distances may be different than when the two points are presented simultaneously. When the points are presented singly, for example, one at 5 m and the other at 6 m, each is perceived as being approximately 2–3 m away. Gogel (1972) found that when two such points of light are presented together, the farther point appears to be located at the egocentric
and Implications for Aviation Safety
Karen R. Young, Donald H. Mershon, and Leigh Jay Hicks, North Carolina State University, Raleigh, North Carolina
The far-anchor effect is responsible for a motion-in-depth illusion that has only recently been recognized. When viewing conditions are limited, motions in depth of a farther target in a two-object display may readily be perceived as opposite motions in depth of the nearer target. The present studies determined whether this error could be avoided through controlled fixation or training with feedback. Under conditions of reduced visibility, participants (college students) viewed 64 two-target presentations varying in the position of the moving target and its direction of motion. Neither fixation instructions nor informational feedback about motion errors affected the occurrence of the basic illusion, nor did a vertical separation of the targets eliminate the main effect, indicating the robustness of the motion illusion under some relatively realistic variations. Such errors in judg-ing motion in depth have significance for both midair collisions between aircraft and ground-incursion accidents under conditions of reduced visibility. Potential applications include the elaboration of examples used in pilot training programs or in training programs for ground personnel.
reference distance and the near point is per-ceived significantly closer than when it is presented alone. Using a slightly different method, Foley (1985) found similar results.
These results persist even when the nearer object is a rectangle (a potentially more stable perceptual object) rather than a small point of light (Mershon & Lembo, 1977). Mershon, Voncannon, and Windes (1976) found similar results using a combination of monocular cues to depth rather than binocular disparity. This tendency to perceive the farthest point in a dis-play at the egocentric reference distance and to perceive other objects in the display as signifi-cantly closer was also found in a display with several objects (Mershon, Granberry-Hager, Bartlett, & DeCamp, 1981). Hence this effect is robust under several conditions. It was termed the far-anchor effect(FAE) by Mershon, Jones, and Taylor (1993).
Far-Anchor Effect and the Perception of Motion
Perceived motion is often related to perceived distance (Epstein, 1977; Gogel, 1990). It follows that errors in perceived distance can lead to errors in perceived motion. Mershon et al. (1993) found that predictable motion errors occurred under conditions similar to those in which the FAE was identified. When the nearer of two points in the display moved in depth, observers tended to perceive the motion correctly. However, when the farther point moved in depth, observers tended to perceive the far point as stationary and the near point as moving. This is explained by the FAE because the far target remained the farthest target in the display and thus should have been continually perceived at the egocentric reference distance. The attribution of motion to the near object occurred because the physical movement of the far target changed the relative depth be-tween the points, “requiring” that some motion be seen (Rock, Auster, Schiffman, & Wheeler, 1980). The motion illusion associated with the FAE occurs even with additional structure in the visual field (Clarke, 1998).
Implications for Aviation
One of the most likely realms in which the illusory motion associated with the FAE would have a significant impact on human safety is
gen-eral aviation. There are two primary reasons why this is so. First, there are significant differences in the amount and variety of information avail-able to commercial versus general aviation pilots. Virtually all jet or commercial flights fol-low instrument flight rules (IFR) and rely on explicit instruction from the air traffic control (ATC) system. Each jet or commuter plane is equipped with a transponder that emits the air-craft’s identity, flight plan, and altitude. Air traffic controllers use this information to guide pilots through a flight. General aviation flights, on the other hand, follow visual flight rules (VFR). Most often, general-aviation aircraft do not have transponders and do not participate in the ATC system (Oster, Strong, & Zorn, 1992).
A second reason that general aviation may be more affected by the motion illusions asso-ciated with the FAE is that there are significant differences in experience and training between commercial and general aviation pilots. Pilots flying jets or commuter aircraft have under-gone extensive training to obtain commercial license ratings and other certifications such as air-transport pilot (ATP) certification. General aviation pilots, in contrast, typically have only a private or student license and much less in-flight training experience (Oster et al., 1992). One of the most crucial ways in which the human visual system helps a pilot fly safely involves the avoidance of other aircraft (O’Hare & Roscoe, 1990). The conditions of reduced visibility involved in flying at night make it par-ticularly difficult for pilots to detect and avoid objects in the sky. One of the strategies suggest-ed to pilots is to “keep up a systematic scan at all times. Do not fixate on any one spot but keep moving the head and eyes, thus maximizing the chance of detecting a target” (O’Hare & Roscoe, 1990, p. 18). This may be an appropriate strat-egy for detection, but what about situations in which two targets have already been detected and their direction of motion must be deter-mined? Would this strategy for fixation still be appropriate for the task of determining the direc-tion of modirec-tion? This is one of the quesdirec-tions that the present research attempted to answer.
Goals for the Current Research
research equipment and procedures were ade-quate for investigating the dynamic FAE. The second and third experiments were conducted to determine whether controlled fixation or training with feedback might eliminate or reduce the prevalence of the otherwise com-mon motion errors.
EXPERIMENT 1
Experiment 1 used a 3 ×2 design in which the independent variables were the experimen-tal display itself and the gender of the observer. Three displays were presented to separate groups of observers: the near point alone, the far point alone, and both points together in one of three configurations (explained later).
The FAE predicts that the egocentric refer-ence distance will determine the perceived dis-tance to each target presented individually. It also predicts that the perceived distance to the far target will remain the same when presented in combination with the near target. Finally, it predicts that the near target will be perceived significantly closer when presented in combi-nation with the far target. A replication of pre-vious results was expected despite the use of some modified configurations. No differences attributable to the observer’s gender were expected. However, this variable was included and balanced because such effects have occa-sionally been found in past studies of egocentric distance perception (Mershon et al., 1981); specifically, women tend to report smaller per-ceived distances than do men.
Method
Participants.We recruited 96 observers (48 men, 48 women) from a pool of introductory psychology students who participated in the research as one way of completing a course requirement. The mean age of the participants
was 18.9 years (SD = 2.55, range 17–38).
Participants underwent visual screening and were required to have a minimum Snellen acu-ity of 20/30 in each eye (either corrected or uncorrected) and a minimum stereoacuity of 145 of arc, as measured by a Multi-Stereo Test in a Keystone telebinocular.
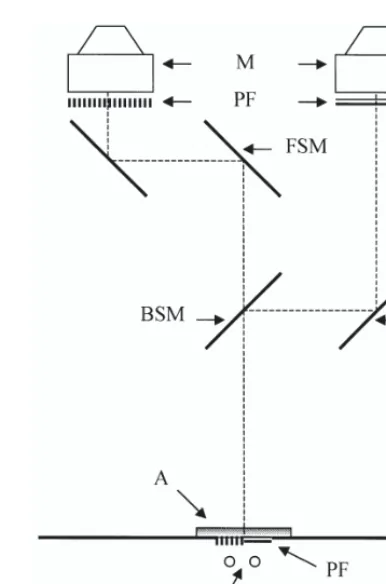
Apparatus.A stereoscope is a device that allows two-dimensional stimuli to be combined
booth. A stationary chin rest was used in order to control the binocular disparity between the targets and to ensure that each eye would view the appropriate stimuli. Observers looked into a completely dark visual alley, which could be occluded by an experimenter-controlled shutter when necessary. An intercom system provided two-way communication.
Procedure.After visual screening, observers were taken to the booth and given two minutes for partial dark adaptation. The experimenter then opened the shutter and showed the par-ticipant the appropriate experimental display. Some initial questions confirmed that fusion had occurred and that for displays containing two points, the targets were correctly perceived in depth. Participants indicated (by verbal re-port) the apparent egocentric distance to each point in feet or inches or in some combination of feet and inches.
The display consisted of either a single point alone or two points in combination. When a single target was presented, it could be located at either 2.85 m (near) or 4.05 m (far). The presentations of both the near and the far points were balanced among six directional positions, covering the different elevation con-figurations to be tested in Experiment 2. When
two targets were presented together, the points represented various combinations of the indi-vidual lights just described.
Configurations for the two points together consisted of one of the following: (a) a display in which the two points were separated hori-zontally by 39 min-arc and were at the same elevation relative to the eyes (standard condi-tion); or (b) a display in which the two points were separated by the same extent horizontally, but one point was elevated 19.5 min-arc above eye level and the other was lowered an equiva-lent amount below eye level. The vertically dis-placed configurations were balanced for left or right point raised or lowered.
Results and Discussion
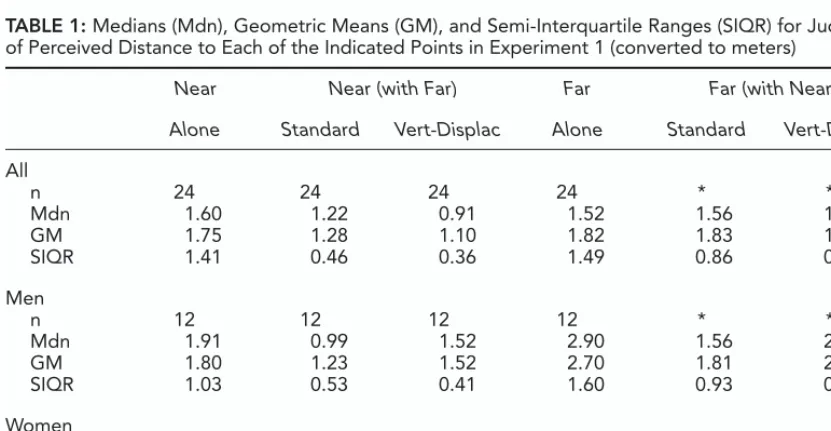
Verbal reports of perceived distance do not usually result in normally distributed data (Mer-shon & Lembo, 1977). In the present case, the mean reported distance to the far point, when presented with the near point in the standard condition, was 2.82 m (SD = 4.40 m, range 0.30 m–22.9 m). Consequently, nonparametric analyses were performed to test the effects of the independent variables (alpha = .05). See Table 1 for a summary of the medians, geo-metrical means, and semi-interquartile ranges
TABLE 1: Medians (Mdn), Geometric Means (GM), and Semi-Interquartile Ranges (SIQR) for Judgments of Perceived Distance to Each of the Indicated Points in Experiment 1 (converted to meters)
Near Near (with Far) Far Far (with Near)
Alone Standard Vert-Displac Alone Standard Vert-Displac
All
n 24 24 24 24 * *
Mdn 1.60 1.22 0.91 1.52 1.56 1.52
GM 1.75 1.28 1.10 1.82 1.83 1.52
SIQR 1.41 0.46 0.36 1.49 0.86 0.41
Men
n 12 12 12 12 * *
Mdn 1.91 0.99 1.52 2.90 1.56 2.02
GM 1.80 1.23 1.52 2.70 1.81 2.30
SIQR 1.03 0.53 0.41 1.60 0.93 0.65
Women
n 12 12 12 12 * *
Mdn 1.60 1.37 0.91 0.91 1.83 1.22
GM 1.70 1.32 0.79 1.22 1.84 1.21
SIQR 1.60 0.29 0.50 0.29 0.63 0.50
for each of the points tested for all observers and within each gender.
According to the predictions of the far-anchor effect, three results are expected. (These analyses were conducted on the full data set.) First, distance judgments for the near point presented alone should not be different from distance judgments for the far point presented alone. A Mann-Whitney Utest, conducted to test this hypothesis, did not reveal a significant difference. (Note that the criterion here is the absence of a statistically significant result, not the proof of exact equality.)
Second, distance judgments to the far point presented alone should not be different from judgments for the far point when presented with the near point. Mann-Whitney Utests were conducted to test this hypothesis for both the standard condition and the configurations with vertical separation. The tests revealed no signif-icant differences for any of the configurations. Third, distance judgments to the near point when presented with the far point should be significantly closer than judgments to the near point presented alone. Again, Mann-Whitney
U tests were conducted to test this hypothesis for both the standard condition and the com-bined conditions with a vertical displacement. The test of the near point alone versus the near point in the standard condition was not signifi-cant (U = 218, p = .06), but it was in the expected direction. The test for the near point alone versus the near point in the conditions with vertical separation was significant (U= 194, p= .025).
Although these results already provide ade-quate (albeit somewhat weak) confirmation of the static FAE with the current equipment, a final test was performed. In the study by Mer-shon et al. (1993), the comparison of the near point alone and the near point with the far point involved targets which were all at eye level. Hence a final Mann-Whitney U test was conducted based only upon reports for points at eye level. This test revealed a significant dif-ference, U= 32.5, p= .0029, supporting the existence of a far-anchor effect in the present situation.
A Mann-Whitney U test was also performed to identify any gender differences between par-ticipants presented with the single-point
con-figurations. The test revealed that women re-ported smaller perceived distances than did men (U= 503.5, p< .0001). Although a simi-lar direction of difference has been reported occasionally in past studies, it seems more rea-sonable to attribute such results to differences in response characteristics than to assume that men and women have significantly different perceptual abilities with respect to egocentric localization. Further tests within each gender group were deemed inappropriate because of the lack of power brought about by small sam-ple sizes and the instability of medians of verbal reports (for n≤12).
EXPERIMENT 2
The purpose of Experiment 2 was to investi-gate the effects of fixation instructions and ver-tical displacement of target objects upon the perceived motion in depth associated with the FAE. Fixation is often related to predictable errors in perceived distance. Gogel and Tietz (1977) and Gogel (1979) found that objects tended to be displaced toward the distance at which the eyes were fixated. These displace-ments led to substantial errors in the perceived distances of nonfixated objects located at dis-tances other than fixation. Based on the direct relationship between errors in perceived dis-tance and errors in perceived motion, it seemed likely that fixation might have an effect on errors of motion perception. Because pilots are already taught to scan, we considered whether specific instructions on scanning and fixation might minimize the influence of the FAE.
Past investigations of the FAE have typically used two points of light separated horizontally but vertically both at eye level. It is unlikely that pilots seeking visual information about other aircraft are necessarily viewing lights located exactly at the same elevation. Thus it is important to know whether the motion illusion associated with the FAE will still occur when objects are separated both horizontally and
vertically. The present research provides infor-mation about this issue.
Method
2. They were recruited from the same partici-pant pool, and had the same characteristics as those in Experiment 1. None had participated previously in the laboratory. The mean age of the participants was 18.9 years (SD = 1.40, range 18–26).
Apparatus.The stereoscope and stimuli from Experiment 1 were also used for Experiment 2. However, the targets were dynamic rather than static; small horizontal movements of the appropriate half-images on the monitors pro-duced clear stereoscopic motion of the targets in depth. Neither the luminance nor the size of the targets changed at any time during the trials. Although the monitors were physically (opti-cally) at a distance of 5.37 m, one of the two targets was always positioned stereoscopically at either 2.85 m or 4.05 m. This target re-mained stationary in depth. The moving target always began at a stereoscopic mid point dis-tance of 3.35 m and then moved forward or backward to one of the extreme positions. (Had targets simply moved between the ex-tremes, participants could have had trouble maintaining fusion of the point-sources through-out the motion.)
Participants rested their feet on a board that held an adjustable footrest and two pedals. When a pedal was pressed, one of two small lights at the experimenter’s station was illuminat-ed to indicate which target appearilluminat-ed to move.
Procedure. Visual screening and dark adap-tation were the same as in Experiment 1. Par-ticipants were then given two practice trials to orient them to the motion task, followed by two blocks consisting of 32 presentations each. For each presentation the observer began by viewing two stationary points of light. Upon seeing the lights, the observer indicated, by verbal report, if the light on the left or on the right appeared closer.
Having established that the observer saw the points in their correct stereoscopic rela-tionship, the experimenters moved one of the two lights in depth. The observer pressed the foot pedal on the same side as the light that appeared to move the most. These responses were converted into two scores across the total trials: number correct (NC) and number pre-dicted (NP). The NC score equaled the num-ber of trials in which the observer’s response
matched the target that physically moved. The NP score equaled the number of trials in which the observer’s response matched the response predicted by the FAE.
Independent variables. The experiment was a mixed-model design with repeated measures. There were two between-subjects and five within-subject variables. The first between-subjects variable was fixation instructions (four levels). In the experimental levels, ob-servers were asked to fixate the near target, fix-ate the far target, or shift fixation continuously between the two targets. The fourth level was a control. Observers in this group were not given any instruction on how they should fixate. The second between-subjects variable was observer’s gender. Although no differences were expected, this factor was included and bal-anced within each level of fixation instructions, because gender differences were found in the second experiment of Mershon et al. (1993).
There were five within-subject variables consisting of the following: depth change (an expanding versus collapsing depth interval), lateral position (right versus left) of the moving target, target-in-motion (near versus far), tar-get configuration (vertical and horizontal rela-tionship of the targets; see later text), and block (first versus second). Neither of the first two variables was expected to make a difference on participant performance, but balancing was implemented for control.
Results
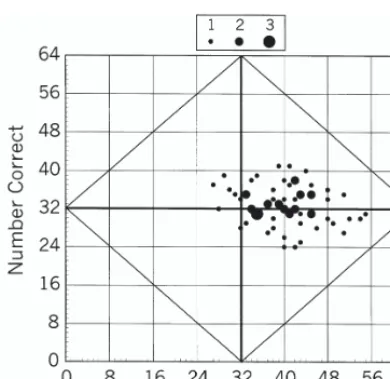
The overall data from the study are depicted graphically in Figure 2. The diamond area on the graph outlines the region for possible pair-ings of the NP and NC scores. These two scores are partially constrained by one another. The far-anchor effect predicts that when the near target moves, its motion will be perceived correctly, adding to both scores. However, when the far target moves, its motion should not be perceived correctly, which thereby con-tributes nothing to the NC score. Thus if an observer did not correctly perceive the motion of the targets in any of the 64 trials (across both blocks), NC would equal 0 and NP must equal 32. If NC = 32, then NP could vary from 0 to 64.
A sign test (alpha =.05) was performed to evaluate the hypothesis that the FAE makes better-than-chance predictions about perfor-mance. The test revealed a significant differ-ence between the number predicted by the FAE (NP score) and the number (32) expected from chance, z= 6.477, p< .0001. Another sign test, performed to test the hypothesis that
the NC score was different from chance, did not reach significance, z= .795, p= .2148. The results of the sign tests are evident in Figure 2 in the way the points cluster (or do not cluster) around the axes. If neither score were different from chance, all of the points would be distrib-uted evenly around the center of the graph. If either the NP or NC scores were different than chance, then the values would be asymmetrical with respect to one of the axes. This is the case for the current data. The values for the NC scores do not differ significantly from chance, and the points are distributed evenly, both above and below the horizontal axis at NC = 32. However, the vast majority of the NP points are shifted to the right of the vertical axis (at NP = 32), consistent with the strong predictive value of the FAE.
To test the effects of the independent vari-ables, a 4 (fixation instructions) ×2 (gender of observer) ×2 (target-in-motion) ×2 (depth change) ×2 (lateral position) ×4 (target con-figuration) ×2 (block) ANOVA was performed to test for main effects and up to three-way inter-actions of the seven variables. The dependent measure used was percentage correct. Because of the number of tests that were performed and the possibility for Type I error, interactions beyond three ways were not tested, and an a priori alpha was set at .01. The ANOVA re-vealed a significant main effect for target-in-motion, F(1, 3920) = 292.35, p= .0001. The percentage-correct value was much higher when the near target moved (M= 64.06, SE= 1.06) than when the far target moved, M= 38.48, SE= 1.06. No main effects were found for fixation instructions, gender of observer, block, target configuration, depth change, or lateral position.
Target configuration did not significantly affect performance. The motion illusion is readily apparent from the means for each con-dition. The mean percentage-correct values for the configurations in which the near target moved were as follows: standard = 64.84, ver-tically displaced = 63.38, and expanded = 64.65 (for all configurations, SE= 2.12). The mean percentage-correct values for the config-urations when the far target moved were stan-dard = 38.78, vertically displaced = 40.14, and expanded = 34.87.
A significant two-way interaction was found between fixation instructions and target-in-motion, F(3, 3920) = 5.57, p = .0008. The mean percentage-correct values for each of the fixation instructions when the near target moved were as follows: fixate near = 62.30, fixate far = 68.36, continuous scan = 65.43, and no instructions = 60.16. The mean percentage-correct values for each of the fixation instruc-tions when the far target moved were fixate near = 42.19, fixate far = 33.01, continuous scan = 39.27, and no instructions = 39.45. Post hoc comparisons using Tukey’s HSD pro-cedure were performed to identify where the significant differences existed. Performance was always better when the near target moved than when the far target moved. Additionally, the results indicate that performance was bet-ter when the observer fixated on the stationary target. Gogel and Griffin (1982) did not find differences in performance when observers fixated on a test point compared with when observers fixated on an inducing point. How-ever, as in our experiment, these researchers found that substantial amounts of induced motion in depth occurred with either set of fix-ation instructions.
Discussion
The ANOVA and the sign tests indicate that the FAE was present in the current study. These results are consistent with those of Mer-shon et al. (1993), Clarke (1998), and Mayer (1998). The motion illusion occurred despite the different vertical locations of the targets. This suggests that the FAE is a robust phenom-enon and that it is likely to persist in many natural and laboratory environments.
Fixation instructions were manipulated in the hope that a factor could be identified that would decrease the effects of the FAE. However, per-formance did not differ significantly among the four fixation instructions. The lack of a signifi-cant main effect most likely resulted from one of two reasons: either fixation made no difference or the instructions made no difference. The task of fixating or not fixating on objects under the reduced viewing conditions of the experi-ment was difficult. Observers may not have been physically able to follow the instructions, or they may not have followed them uniformly.
Observers in the present study made re-sponses for 64 trials; the maximum number of trials in any past study was 24. The nonsignifi-cant results from the block variable suggest that the FAE will not show any significant change over repeated trials. However, because observers were never given information about the accuracy of their response, they might not have been able to take full advantage of the additional experience. Experiment 3 was con-ducted to identify whether or not informative feedback about performance would lead to improvement.
EXPERIMENT 3
Recent research (Niall, Reising, & Martin, 1999) suggests that providing feedback about distance judgments can improve later judgments. If feedback about distance judgments can improve later performance, so might feedback about judgments of motion. One of our goals for this research was to identify a factor that could reduce the pervasiveness of the motion illusion and that could also be easily implement-ed during aviation training. An investigation of feedback on performance was important be-cause of the real-world applicability to situations in which pilots make visual judgments about the motions of surrounding objects. If pilots were using information from air-traffic con-trollers to confirm what their eyes told them, it would give them feedback about their perfor-mance. If such feedback could improve per-formance on later judgments, changes in training could lead to an increase in safety.
Method
Participants.Forty participants (20 men, 20 women) served as observers for Experiment 3. They were recruited from the same participant pool as those in the earlier experiments. None had participated previously in the laboratory. Their mean age was 19.6 (SD = 1.6, range 18–24).
number of fully balanced presentation blocks, a change necessary to test for a training effect.
Procedure.The procedure for Experiment 3 was identical to that of Experiment 2, with the following exceptions. There were four blocks of experimental trials consisting of 16 presen-tations each. Participants were given two rest breaks, one after the first block and one after the third block. During Blocks 2 and 3, half of the participants were given feedback about performance but the other half were not. (Gender of the observer was balanced within the feedback conditions.) After the participant had pressed the foot pedal indicating which light appeared to move the most, the experi-menter indicated which light had been moved and in what direction (e.g., “on that trial, the left light moved back”).
Results
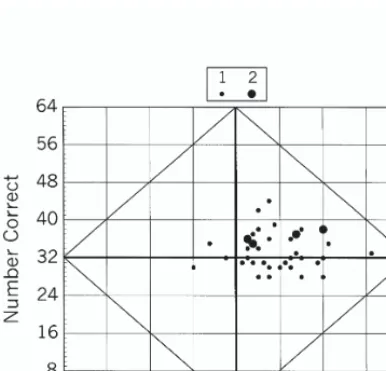
The overall data from the study are illustrat-ed in Figure 3. The range of NP and NC scores is the same as those in Experiment 2. A 2 (Feedback Condition) ×2 (Gender of Observer)
×4 (Block) ×2 (Lateral Position) ×2 (Depth
Change) ×2 (Target-in-Motion) mixed-model ANOVA was performed to test for main effects and up to three-way interactions of the vari-ables (alpha = .01). The ANOVA revealed a significant main effect of target-in-motion,
F(1,2486) = 145.99, p< .0001. The percentage-correct value was much higher when the near target moved (M= 64.38, SE = 1.35) than when the far target moved (M= 41.33, SE= 1.35). No significant main effects or inter-actions were found for the feedback conditions between or within participants.
For participants in the feedback condition, the mean percentage-correct values for Blocks 1 and 4 were 52.50 and 51.56 (SE= 2.70), respectively; for participants in the no-feedback condition, the equivalent mean percentage-correct values were 56.88 and 50.00, respec-tively.
Significant two-way interactions of Target-in-Motion ×Depth Change, F(1,2486) = 24.92,
p < .0001, and of Lateral Position × Depth Change, F(1,2486) = 10.17, p= .0014, were found. Post hoc comparisons using Tukey’s HSD procedure were performed to identify whether or not performance was significantly better in the expanding or the collapsing con-ditions within the target-in-motion variable. The mean percentage-correct values were far-expand = 35.55, far-collapse = 47.10, near-collapse = 60.62, and near-expand = 68.13 (for all conditions SE= 1.91). All comparisons were significantly different (p < .0001) except for that of near-collapse versus near-expand.
Similar tests were conducted for the depth change conditions within lateral position (mov-ing target on left or right). The mean percentage-correct values were as follows: left-expand = 48.99, right-collapse = 50.62, right-expand = 54.69, and left-collapse = 57.10 (for all con-ditions, SE= 1.91). The only significant differ-ence (p= .01) occurred between the left-expand and left-collapse conditions.
Discussion. The results of the ANOVA clearly indicate that participants experienced the illusory motion associated with the FAE. These results are consistent with those of Experiment 2 and Mershon et al. (1993). The errors persisted over several trials, even when observers were given feedback about their per-formance on individual trials. The implications Figure 3. A plot of number-correct (NC) versus
of the two interactions are unclear. Observer performance was not consistently better for conditions in which the depth interval was expanded or collapsed.
CONCLUSIONS
The current studies provide further support for the theory behind the far-anchor effect and the presence of the motion illusions associated with it. The FAE occurs under static and dy-namic conditions and with targets located at a variety of locations in space. The findings of the current experiments suggest that it may be dif-ficult to find a relatively easy way to counteract the motion illusions associated with the FAE.
The choice to manipulate fixation instruc-tions and feedback was a practical one. We had hoped to identify a technique that could help pilots reduce the prevalence of the motion illusions associated with the FAE and that could easily be implemented during training. The fact that neither of those variables had an effect is important. If participants were unable to con-trol their fixation during minimally demanding tasks in a laboratory environment, there is no reason to believe that such a recommendation would overcome similar motion errors under more realistic conditions. It remains to be seen whether more extensive training with feedback might still be a valuable training tool.
The perceptual consequences of the FAE might also have implications for other environ-ments. For example, the FAE may be an im-portant factor in nighttime ground operations at large airports. Because of the amount of traffic, including both aircraft and a multitude of ground-support vehicles, moving lights are visible along (or adjacent to) almost any line of sight. Such lights appear at various distances and involve movements in many directions. It is likely that both pilots and the drivers of ground vehicles make numerous errors in perceiving the motions of other aircraft, trucks, and buses. Collisions between aircraft and ground vehicles are a common problem during nighttime condi-tions or during poor visibility caused by weather (Aviation Safety, 2000). Thus understanding whether and how the FAE can be ameliorated may help us to avoid another serious hazard of air travel, the ground-incursion accident.
Two aspects of the present study might sug-gest limitations in applying the results to prac-tical issues in aviation safety. First, data were collected from trials in which the only useful information about target position came from binocular disparity and vergence. (Also inherent in the use of the stereoscope was the require-ment that observers restrict head motion via a chin rest.) Second, the physical (and stereo-scopic) distances of the targets were less than 6 m, vastly less than the distances of operating aircraft in the air or on the ground. Neither of these factors, however, constitutes an actual limitation.
To evaluate the application of a laboratory study to a less controlled situation, one should determine what factors differ and how. A pilot judging the motions of other aircraft or ground vehicles at night is realistically dependent on the same visual information as provided to our lab-oratory observers. If anything, our participants might have had slightly greatervisual informa-tion for egocentric distance, in that the oculo-motor cues would be more effective for the closer laboratory distances. Neither accommo-dation nor vergence could provide effective dis-crimination of the physical distances between planes in flight or targets distributed across a large airport. Nor would movements of a pilot’s head add appreciable parallax information.
We conclude that the motion illusions de-scribed in this paper are ubiquitous and very likely affect the judgments of those involved in nighttime aircraft accidents. Whether or not the resulting errors are causally involved in such accidents remains to be determined. Nevertheless, understanding the mechanisms for the FAE may be important for finding ways to reduce such errors and their potential risks.
ACKNOWLEDGMENTS
We thank David L. Clarke for initial devel-opment of the program that controlled the stimuli and Aaron Young for additional pro-gramming assistance.
REFERENCES
Com-mittee on Appropriations, 106th Cong., 2d Sess., 45 (2000) (testimony of Jim Hall).
Clarke, D. L. (1998). Errors in the perception of motion in depth: Effects of a structured field-of-view.Unpublished doctoral dis-sertation, North Carolina State University, Raleigh.
Epstein, W. (1977). What are the prospects for a higher-order stimulus theory of perception? Scandinavian Journal of Psych-ology, 18,164–171.
Foley, J. (1985). Binocular distance perception: Egocentric distance tasks. Journal of Experimental Psychology: Human Perception and Performance, 11,133–149.
Gogel, W. C. (1969). The sensing of retinal size. Vision Research, 9,1079–1094.
Gogel, W. C. (1972). Scalar perceptions with binocular cues of dis-tance. American Journal of Psychology, 85,477–497. Gogel, W. C. (1979). The common occurrence of errors of
per-ceived distance. Perception & Psychophysics, 25,2–11. Gogel, W. C. (1990). A theory of phenomenal geometry and its
applications. Perception & Psychophysics, 48,105–123. Gogel, W. C., & Griffin, B. W. (1982). Spatial induction of illusory
motion. Perception, 11,187–199.
Gogel, W. C., & Tietz, J. D. (1977). Eye fixation and attention as modifiers of perceived distance. Perceptual and Motor Skills, 45,343–362.
Mayer, C. M. (1998). Effects of noise and organizational factors on the perception of motion in depth. Unpublished master’s thesis, North Carolina State University, Raleigh.
Mershon, D. H. (1997). Phenomenal geometry and the measurement of perceived auditory distance. In R. H. Gilkey & T. R. Anderson (Eds.), Binaural and spatial hearing in real and virtual envi-ronments(pp. 257–274). Mahwah, NJ: Erlbaum.
Mershon, D. H., Granberry-Hager, S., Bartlett, K., & DeCamp, B. (1981). Scalar perceptions of distance in a multiobject binocu-lar display. Bulletin of the Psychonomic Society, 18, 249–252. Mershon, D. H., Jones, T. A., & Taylor, M. E. (1993). Organi-zational factors and the perception of motion in depth. Perception & Psychophysics, 54,240–249.
Mershon, D. H., & Lembo, V. L. (1977). Scalar perceptions of dis-tance in simple binocular configurations. American Journal of Psychology, 90, 17–28.
Mershon, D. H., Voncannon, M. G., & Windes, W. R. (1976). Scalar perceptions of distance for a monocularly determined depth interval. Bulletin of the Psychonomic Society, 8, 341–342.
Niall, K. K., Reising, J. D., & Martin, E. L. (1999). Distance esti-mation with night vision goggles: A little feedback goes a long way. Human Factors, 41, 495–506.
O’Hare, D., & Roscoe, S. (1990). Flightdeck performance: The human factor.Ames: Iowa State University Press.
Oster, C. V., Strong, J. S., & Zorn, C. K. (1992). Why airplanes crash: Aviation safety in a changing world. New York: Oxford University Press.
Rock, I., Auster, M., Schiffman, M., & Wheeler, D. (1980). In-duced movement based on subtraction of motion from the inducing object. Journal of Experimental Psychology: Human Perception and Performance, 6,391–403.
Karen R. Young is an assistant professor of psycholo-gy in the Department of Psycholopsycholo-gy at the University of Alabama in Huntsville. She received her Ph.D. in psychology from North Carolina State University in 2002.
Donald H. Mershon is a professor of psychology and director of graduate programs in the Depart-ment of Psychology at North Carolina State Uni-versity. He received his Ph.D. in psychology from the University of California, Santa Barbara, in 1970.
Leigh Jay Hicks received her B.A. degree in psychol-ogy (with honors) at North Carolina State Uni-versity in 2000. She is employed as an Instructional Technologist for the Learning Technology Service at NCSU.
Date received: January 24, 2001