Improving the Design of Travelling Wave Type
Sloshing Absorbers
Jayson Allan Grant
A thesis submitted to Victoria University
for the Doctor of Philosophy Degree (Mechanical Engineering)
ii ACKNOWLEDGEMENTS
I would like to thank the supervisors of this thesis, Dr. Eren Semercigil, Dr. Özden Turan and
Dr. Mahesh Prakash. Their valuable guidance, encouragement and assistance helped me
immensely in the preparation and completion of this study.
While undertaking my Doctorate of Philosophy I received a Postgraduate Research
Scholarship from Victoria University, as well as a top-up Research Scholarship from CSIRO.
The financial support of these two scholarships was greatly appreciated.
Finally, I express my sincerest gratitude to my family and friends for their support.
iii ABSTRACT
Liquid sloshing absorbers are simple structures consisting of a partially full container of
liquid with a free surface. The primary objective of this thesis is to investigate the potential to
improve the design of rectangular sloshing absorbers through attaching surface roughness
elements (obstructions) to the absorbers. The potential to increase energy dissipation through
intentionally induced liquid sloshing within an absorber for structural control purposes is
presented.
Smoothed Particle Hydrodynamics (SPH) is a numerical modelling tool used in this thesis to
predict fluid-structure interactions. SPH can accurately predict complex liquid free surface
behaviour and liquid velocities. Here SPH is used to successfully model two and
three-dimensional liquid sloshing absorbers with predictions validated experimentally. Hence, SPH
is proven to be a promising tool for these studies.
The novelty of this thesis consists of using SPH to determine energy dissipation
characteristics and the increase of performance in various designs of liquid sloshing absorbers
through the introduction of surface roughness elements (obstructions). Attaching obstructions
to the base of shallow liquid level rectangular sloshing absorber increases energy dissipation
significantly. Varying the inclination alone of two rectangular absorbers attached to a
structure is then investigated, giving promising results over various structural frequencies.
Normally, varying structural frequencies require different size containers to maintain
effective control as the container length is a critical tuning parameter. Hence, there are
practical advantages by using the same container, but only varying its inclination. Finally, the
novel concept of implementing the geometry of a hen’s egg as a sloshing absorber is
analysed. Experiments were previously undertaken to analyse the effectiveness of energy
dissipation within the egg by reporting on the transient oscillations after it is released, on the
ground, from its vertical position. These experiments are compared with three dimensional
numerical predictions of the hen’s egg and produce acceptable similarities. The egg’s unique,
iv TABLE OF CONTENTS
Page
ACKNOWLEDGEMENTS ii
ABSTRACT iii
TABLE OF CONTENTS iv
LIST OF FIGURE CAPTIONS vi
Chapter 1 1
INTRODUCTION
Chapter 2 9
ANALYSING AN EFFICIENT LIQUID SLOSHING ABSORBER FOR VIBRATION CONTROL USING SPH
2.1 INTRODUCTION 9
2.2 SURFACE ROUGHNESS ELEMENTS 11
2.3 FREQUENCY STUDY 13
2.4 INITIAL CONDITION DEPENDENCE 14
2.5 NUMERICAL MODEL 16
2.6 PERFORMANCE INDICATOR 18
2.7 NUMERICAL PREDICTIONS 20
2.7.1 Optimum Ratio Cases 20
2.7.2 ‘Tuned’ cases 24
2.7.3 Comparisons between Summaries of Optimum and ‘Tuned’ Cases 27 2.7.4 Energy Dissipation Characteristics of Optimum Obstruction Case 27 2.7.5 Dependence on Initial Displacement Magnitude 29 2.7.6 Energy Dissipation Characteristics for Different Initial 34
Displacement
2.8 CONCLUSIONS 35
Chapter 3 53
A SLOSHING ABSORBER WITH DESIGNED OBSTRUCTIONS TO IMPROVE ENERGY DISSIPATION
3.1 INTRODUCTION 53
3.2 EXPERIMENTAL SETUP 54
3.3 INITIAL EXPERIMENTS 56
v Page 3.3.3 Identifying Effective Obstruction Cases With respect to d/L 65
3.4 NUMERICAL MODEL 66
3.5 NUMERICAL PREDICTIONS 67
3.5.1 Numerical and Experimental Displacement History Comparison 67 3.5.2 Numerical and Experimental Liquid Flow Field Comparison 70 3.5.3 Numerical Displacement Histories Analysing Effects of 72
Obstructions
3.5.4 Summary of Performance of Numerical Cases 73 3.5.5 Numerical and Experimental Settling Time Ratio Comparison 76 3.5.6 Liquid Flow Field Comparisons – Effects of Obstructions 77
3.6 CONCLUSIONS 78
Chapter 4 99
A STUDY ON THE EFFECT OF INCLINATION ON A SLOSHING ABSORBER USING SPH
4.1 INTRODUCTION 99
4.2 NUMERICAL MODEL 101
4.3 NUMERICAL PREDICTIONS 104
4.3.1 Numerical Validation 104
4.3.2 Frequency Variation Study 109
4.3.3 Summary of Performance 112
4.3.4 Liquid Velocity Flow Fields 116
4.3.4.1 Energy dissipation Characteristics – Cases Without and 116 With Inclination
4.3.4.2 Energy dissipation Characteristics – Inclined Tuned and 121 Un-tuned Cases
4.3.5 Inclination Cases with Obstructions 125
4.4 CONCLUSIONS 129
Chapter 5 153
SLOSHING AND ENERGY DISSIPATION IN AN EGG: SPH SIMULATIONS AND EXPERIMENTS
5.1 INTRODUCTION 153
5.2 NUMERICAL MODEL 155
5.3 DISCUSSION 156
5.3.1 Comparison of Experimental and Numerical Observations 156
5.3.2 Effect of Viscosity 160
5.3.3 The Effects of Obstructions 163
5.3.4 Tuning – A Frequency Study 167
vi
Chapter 6 186
CONCLUSION
REFERENCES 192
APPENDIX 1 199
SMOOTHED PARTICLE HYDRODYNAMICS
APPENDIX 2 204
vii LIST OF FIGURE CAPTIONS
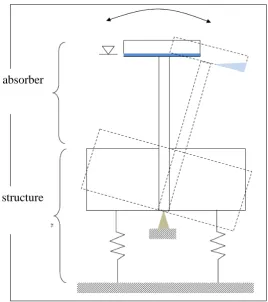
Figure 1.1: Schematic of the structure with an absorber.
Figure 2.1: (b) Liquid flow past a semi-circular obstruction within the rectangular liquid
sloshing absorber and (b) geometry of the rectangular absorber with
semi-circular obstructions.
Figure 2.2: Two snapshots of the velocity contours at particular instances for the 1
obstruction case with a 16 degree initial displacement. (a) High velocities (in
red) occur within the liquid and (b) large free surface deformation occurs at
the right wall as the structure oscillates from left to right. Velocity scale runs
from 0 m/s to 0.8 m/s.
Figure 2.3: (a) Schematic of the structure with an attached absorber and (b) displacement
history of uncontrolled structure (with attached absorber without liquid).
Figure 2.4: Displacement histories with liquid height of 14.9 mm (▬ ▬); and 8 mm
without (▬▬) and with one 6 mm obstruction (▬▬) for structural
frequencies of (a) 0.36 Hz, (b) 0.5 Hz, (c) 0.64 Hz, (d) 0.78 Hz and (e) 0.92
Hz.
Figure 2.5: Variation of (a) 10 % and (b) 5 % settling times with the frequency ratio from
Figure 2.4. Without ( ) and with 1 obstruction ( ) at a liquid height of 8
viii Figure 2.6: Same as in Figure 2.4, but for varying liquid heights to achieving theoretical
tuning.
Figure 2.7: Same as in Figure 2.5, but for ‘tuned’ liquid height cases, from Figure 2.6,
without ( ) and with 1 obstruction ( ).
Figure 2.8: Same as in Figure 2.5, but for cases from Figures 2.5 and 2.7. Horizontal axis
is structural frequency, fs (Hz).
Figure 2.9: Still frames at areas of interest of liquid flow field comparisons of water
within a sloshing absorber controlling a structure. Left column shows 1
semi-circular obstruction located in the bottom centre and liquid height of 8 mm
case. Right column shows the case without an obstruction with a liquid height
of 14.9 mm. Both cases have a 2.5 degrees initial displacement. Fixed velocity
scale shows fluid particle velocity ranging from 0 to 0.8 m/s.
Figure 2.10: Numerical displacement histories with structural frequency of 0.64 Hz and
liquid height of 14.9 mm without obstructions (▬ ▬) and liquid height of 8
mm with 1 (▬▬) and 2 (▬▬) obstructions with radius of 6 mm for initial
displacements of (a) 1.25, (b) 2.5, (c) 3.75, (d) 6.25, (e) 10 and (f) 16 degrees.
Figure 2.11: Summary of (a) 10 % and (b) 5 % settling times from cases in Figure 2.10 for
cases with 1 ( ) and 2 ( ) obstructions at a liquid height of 8 mm and
ix Figure 2.12: Still frames at areas of interest of liquid flow field comparisons of water
within a sloshing absorber controlling a structure. Left column shows the same
1 obstruction case as in Figure 2.9 with an initial displacement of 2.5 degrees.
Right column shows the same case with an initial displacement of 16 degrees.
Fixed velocity scale shows fluid particle velocity ranging from 0 to 0.8 m/s.
Figure 3.1: (a) Schematic and (b) photograph of the structure with the absorber.
Figure 3.2: (a) Geometry of the rectangular absorber with 3 semi-circular obstructions
(not to scale). (b) 3 semi-circular obstructions attached to the bottom centre of
the rectangular container (distance between obstructions centre to centre is
42.5mm). (c) Front and (d) plan views of the semi-circular obstruction with
section of tape removed.
Figure 3.3: Schematic plan views of containers with obstructions attached (specified by
red lines) for (a) 7 obstructions (even spaced), (b) 2 obstructions (1 obstruction
45 mm from each wall) and (c) 1 obstruction (centre).
Figure 3.4: Settling time ratios for 0 obstructions ( ), 7 obstructions ( ), 2
obstructions (sides) ( ) and 1 obstruction (centre) ( ) with a 4 mm
x Figure 3.5: Schematic plan views of containers with obstructions attached (specified by
red lines) for (a) 1 obstruction (centre), (b) 3 obstructions (1 obstruction
centre, 2 obstructions (45 mm from each wall) and (c) 3 obstructions (centre,
spaced 45 mm from centre obstruction).
Figure 3.6: Same as Figure 3.2 but for 0 obstructions ( ), 1 obstructions (centre)
( ), 3 obstructions (1 centre, 2 sides) ( ) and 3 obstructions (centre)
( ) with a 2 mm obstruction height and 1 obstructions (centre) ( ), 3
obstructions (1 centre, 2 sides) ( ) and 3 obstructions (centre) ( ) with a
4 mm obstruction height.
Figure 3.7: Schematic plan views of containers with obstructions attached (specified by
red lines) for (a) 1 obstruction (centre), (b) 3 obstructions (1 obstruction
centre, 2 obstructions spaced 45 mm from each wall), (c) 3 obstructions
(centre, spaced 45 mm from centre obstruction), (d) 2 obstructions (45 mm
from each wall) and (e) 5 obstructions (spaced evenly).
Figure 3.8: Settling time ratios for 2 obstructions (sides) ( ), 5 obstructions ( ), 1
obstruction (centre) ( ), 3 obstructions (1 centre, 2 sides) ( ) and 3
obstructions (centre) ( ) with an 8 mm obstruction height at 7.7 mm to 15.3
xi Figure 3.9: Schematic plan views of containers with obstructions attached (specified by
red lines) for (a) 3 obstructions (1 obstruction centre, 2 obstructions spaced 45
mm from each wall), (b) 3 obstructions (spaced evenly), (c) 3 obstructions
(centre, spaced 45 mm from centre obstruction) and (d) 3 obstructions (centre,
spaced 22.5 mm from centre obstruction).
Figure 3.10: Same as Figure 3.2 but for 0 obstructions ( ), 3 obstructions (1 centre, 2
sides) ( ), 3 obstruction (1 centre, 2 middle) ( ), 3 obstructions (1
centre, 21.25 mm) ( ) and 3 obstructions (centre) ( ) with a 4 mm
obstruction height.
Figure 3.11: A summary of settling time ratios for cases with obstruction height to liquid
height ratio (r/hw) and obstruction heights (r) of 2 mm ( ), 4 mm ( )
and 8 mm ( ). Inserts are schematic plan views of containers for cases in
each figure with varying distance of obstruction to centre of container to free
surface length ratio (d/L) of (a) 0 (1 obstruction in the centre), (b) 0.125 (3
obstructions in the centre with 42.5 mm spacing) and (c) 0.375 (3 obstructions
with 127.5 mm spacing).
Figure 3.12: Variation of settling time ratio for distance of obstructions to centre of
container to free surface length ratio (d/L) for obstruction height to liquid
height ratio (r/hw) of 0.4 (r = 2 mm) ( ), 0.5 (r = 4 mm) ( ), 0.8 (r = 8
xii Figure 3.13: Displacement histories of uncontrolled (---) and controlled () with the
rectangular absorber with 3 semi-circular obstructions attached to the bottom
centre of the container with obstruction height of 4 mm and a liquid height of
7.7 mm.
Figure 3.14: Displacement histories of the experimental observation (----) and numerical
prediction with smoothing lengths of 1.2 (▬), 1.6 (▬), 2.0 (▬) and
2.4 (-▬-). Obstructions are the same as in Figure 4.
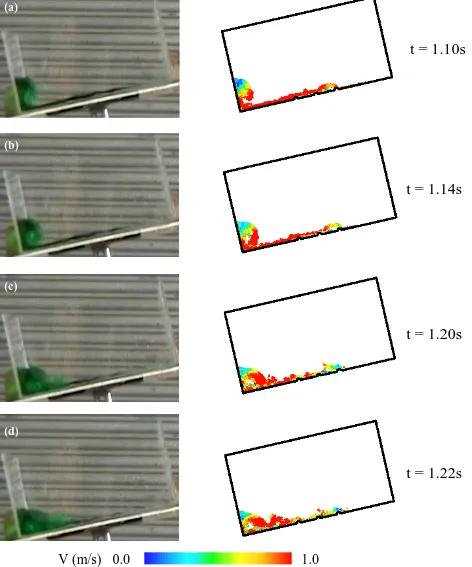
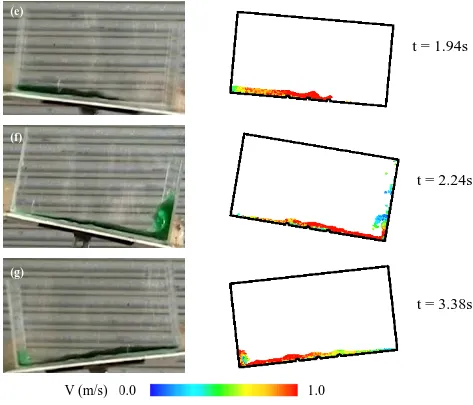
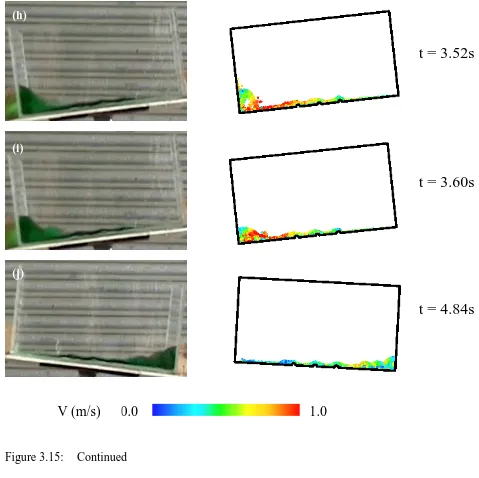
Figure 3.15: Still frames at areas of interest of free surface comparisons of water within a
sloshing absorber controlling a structure. 3 semi-circular obstructions located
in the bottom centre with obstruction height and spacing of 4 mm and 42.5
mm respectively, 16 degrees initial displacement and liquid height of 7.7 mm
case is used for this comparison. Left column shows experimental
observations. Right column shows numerical predictions obtained with SPH.
Experimental error is 1/25 s (+/- 40 ms). Fixed velocity scale shows fluid
particle velocity ranging from 0 to 1 m/s.
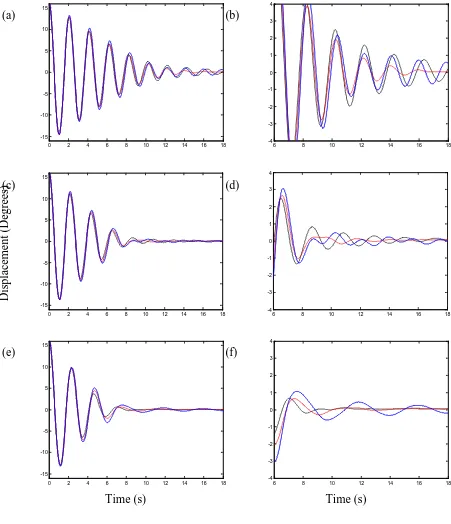
Figure 3.16: Displacement histories of the structure when coupled to rectangular shaped
absorber without (▬ ▬) and with one (▬▬) and 3 (▬▬) semi-circular
obstructions located in the centre (4 mm obstruction height) with obstruction
spacing of 42.5 mm, 16 degrees initial displacement and liquid heights of (a)
2.6 mm, (c) 5.1 mm, (e) 7.7 mm, (g) 10.2 mm and (i) 12.8 mm. The right
xiii displacement and time from 6 s to 18 s to focus on the effect of obstructions at
small displacements (b) 2.6 mm, (d) 5.1 mm, (f) 7.7 mm, (h) 10.2 mm and (j)
12.8 mm.
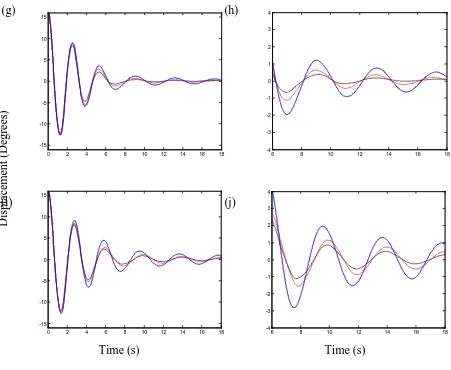
Figure 3.17: Variation of (a) 10 %, (b) 5 % and (c) 2.5 % settling time ratios with liquid
height to free surface length ratio (hw/L) for absorbers without ( ) and
with 1 ( ) and 3 ( ) obstructions. Settling times are taken from cases in
Figure 3.14. The settling time ratio for the optimum case from (V.J. Modi and
S.R. Munshi, 1998) with a d/L of 0 and an r/hw of 0.75 (r = 6 mm) ( ) is also
displayed for comparison.
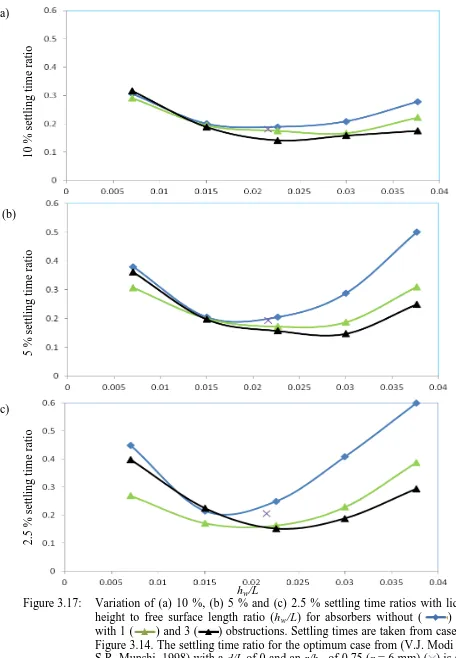
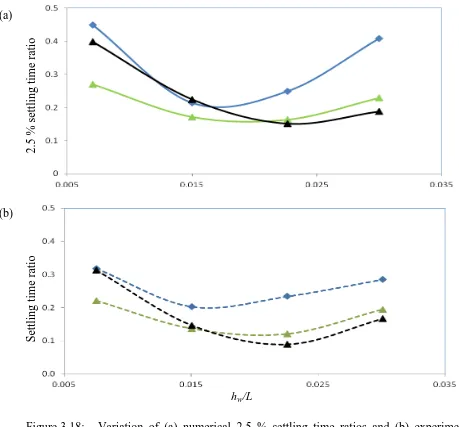
Figure 3.18: Variation of (a) numerical 2.5 % settling time ratios and (b) experimental
settling time ratios with liquid height to free surface length ratio (hw/L) for
absorbers without ( ) and with 1 ( ) and 3 ( ) obstructions.
Numerical and experimental settling time ratios are taken from cases in
Figures 3.17(c) and 3.6, respectively.
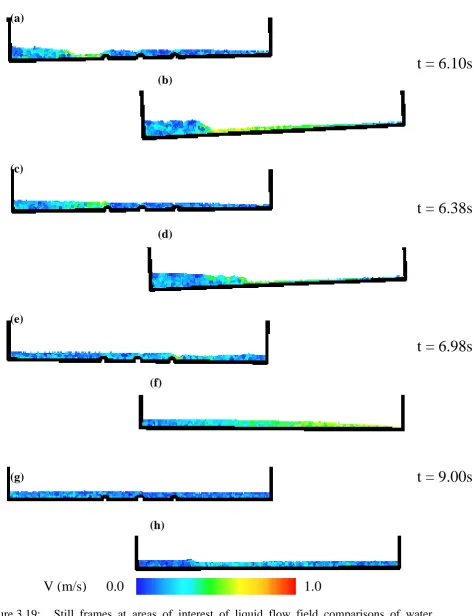
Figure 3.19: Still frames at areas of interest of liquid flow field comparisons of water
within the lower half of a sloshing absorber controlling a structure. Left
column shows 3 semi-circular obstructions located in the bottom centre with
obstruction height and spacing of 4 mm and 42.5 mm respectively, 16 degrees
initial displacement and liquid height of 7.7 mm case is used for this
comparison. Right column shows same case without obstructions. Fixed
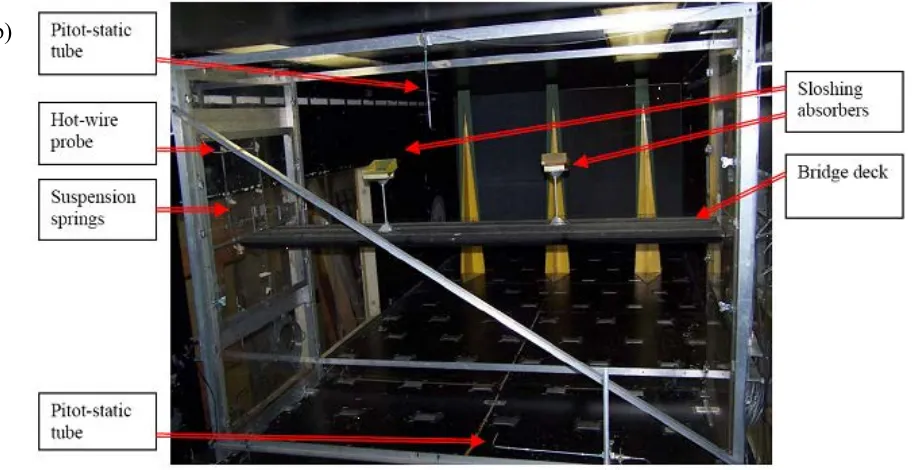
xiv Figure 4.1: An (a) isometric line drawing and (b) photograph of the experimental setup in
the wind tunnel, looking upstream. (c) Numerical model of the two inclined
containers attached to the bridge deck by two vertical poles. A simplified end
view is shown, for clarity.
Figure 4.2: A snapshot of the velocity contours at a particular marked instance for the 20
degree inclination case. Liquid sloshing occurs within the two containers as
the structure oscillates. Velocity scale runs from 0 m/s to 0.1 m/s.
Figure 4.3: Numerical (solid line) and experimental (dashed line) displacement histories
for 2 containers with free surface (L) of 150mm at structural frequency of
1.8Hz (a) uncontrolled and at inclinations (b) 0, (c) 8, (d) 13, (e) 20 and (f) 26
degrees. (Tuned at 13 degrees (c))
Figure 4.4: Numerical displacement histories of the 0 degree inclination case at a
structural frequency of 1.8Hz with particle sizes 0.8 mm x 0.8 mm (▬ ▬)
from Figure 4.3(b), and 0.4 mm x 0.4 mm (▬▬).
Figure 4.5: Same as Figure 4.3 but for a structural frequency of 0.85Hz. (Tuned at 0
xv Figure 4.6: Numerical displacement histories for 2 containers with free surface (L) of
700mm at inclinations (a) 0, (b) 1.5, (c) 2.5, (d) 4, (e) 6, (f) 8, (g) 10 and (h)
12 degrees for structural frequencies of 0.5Hz (▬ ▬), 0.7Hz (▬▬) and
0.9Hz (▬▬). Structural frequencies of 0.5Hz, 0.7Hz and 0.9Hz are tuned at 4
(d), 8 (f) and 12 (h) degree inclinations respectively.
Figure 4.7: (a) 10 % and (b) 5 % settling times ratios for cases with structural frequencies
0.5 Hz ( ), 0.7 Hz ( ) and 0.9 Hz ( ), from Figure 4.6.
Figure 4.8: Average (a) 10 % and (b) 5 % settling time ratios over structural frequencies
0.5 Hz, 0.7 Hz and 0.9 Hz, for cases from Figure 4.6.
Figure 4.9: (a) 10 % and (b) 5 % settling time ratios with respect to liquid frequency to
natural frequency (fL/fs) for cases in Figures 4.7(a) and (b).
Figure 4.10: Liquid velocity flow field snapshots for 3 numerical cases appraoching first
positive structural peak displacement. (a) for 0 degree inclination from Figure
4.5(b) with a structural frequency of 0.85 Hz, (b) for 0 degree inclination from
Figure 4.6(a) with a structural frequency of 0.5 Hz, (c) for 4 degrees
inclination from Figure 4.6(d) with a structural frequency of 0.5 Hz. Velocity
colour scale indicates a range from 0 m/s (blue) to 0.1 m/s (red).
Figure 4.11: Same cases as Figure 4.9 except approaching second negative structural peak
xvi Figure 4.12: Liquid velocity flow field snapshots at first zero structural displacement for
cases with a structural frequency of 0.7 Hz. (a) for 4 degree inclination from
Figure 4.6(d), (b) for 8 degree (tuned) inclination from Figure 4.6(f) and (c)
for 12 degrees inclination from Figure 4.6(h).
Figure 4.13: Same cases as Figure 4.12 except at first positive structural peak displacement.
Figure 4.14: Same cases as Figure 4.12 except at second zero structural displacement.
Figure 4.15: Same cases as Figure 4.12 except at second negative structural peak
displacement.
Figure 4.16: Same cases as Figure 4.12 except at fifth zero structural displacement.
Figure 4.17: Same cases as Figure 4.12 except at third positive structural peak
displacement.
Figure 4.18: Same cases as in Figure 4.6 (▬ ▬) without obstructions and with a single
semi-circular obstruction located in the centre base of the container with
obstruction radius of 2.4mm (▬▬) and 5.9mm (▬▬) for inclinations (a) 0,
xvii Figure 4.19: Same cases at in Figure 4.6 (▬ ▬) without obstructions and with evenly
spaced semi-circular obstructions (▬▬) with obstruction radius of 2.4mm for
inclinations (a) 0, (b) 1.5, (c) 2.5, (d) 4, (e) 6 and (f) 8 degrees. (Tuned at 4
degrees (d))
Figure 4.20: Liquid velocity flow field snapshots for 2 numerical cases with a structural
frequency of 0.5 Hz. (a) and (c) for 4 degrees inclination (repeated from
Figure 4.9(c) and 4.10(c)), (b) and (d) for 4 degrees inclination with evenly
spaced obstructions with a obstruction height of 2.4 mm from Figure 4.19(d).
Velocity colour scale indicates a range from 0 m/s (blue) to 0.1 m/s (red).
Figure 5.1: Angular displacement history of an egg when raw (▬) and boiled (---) from
(G. So and S.E. Semercigil, 2004).
Figure 5.2: Physiology of egg (Avian Sciences Net, 2012).
Figure 5.3: Geometry of an egg (A. Marsh et al., 2012).
r1 = 22 mm (vertical), r2 = 14 mm (inverted) and r3 = 44 mm (horizontal).
Figure 5.4: Displacement histories for numerical egg friction coefficient of 0.01 (blue
thin), 0.05 (red thick) and experimental observations (green dot) for (a) 0.2,
xviii Figure 5.5: Variation of (a) 10% and (b) 5% settling time and (c) initial potential energy
( ) with volume fraction. Settling times given for experimental cases
( ) and numerical ones with friction coefficient of 0.01 ( ) and 0.05
( ).
Figure 5.6: Numerical displacement histories for friction coefficient of 0.01, 0.2 volume
fraction and a viscosity of (a) 0.001 Pa s, (b) 0.1 Pa s, (c) 1.0 Pa s; and 1.0
volume fraction and a viscosity of (d) 0.001 Pa s, (e) 0.1 Pa s and (f) 1.0 Pa s.
Red dots correspond to the instants of the snapshots in Figure 5.7 and 5.8.
Figure 5.7: Liquid velocity flow field snapshots corresponding to marked instances in
Figure 5.6 for 0.2 volume fraction. (a) to (d) for viscosity of 0.001 Pa s, and
(e) to (h) for viscosity of 1.0 Pa s. Velocity colour scale range from 0 m/s
(blue) to 0.3 m/s (red).
Figure 5.8: Same as in Figure 7, but for 1 volume fraction.
Figure 5.9: Egg geometry for 1 (a) and 2 (b) semi-circular obstruction cases with radius 4
xix Figure 5.10: Numerical displacement histories without (---) and with 1 semi-circular
obstruction (▬▬) with radius 4 mm and friction coefficient of 0.01, 0.2
volume fraction and a viscosity of (a) 0.001 Pa s, (b) 0.1 Pa s, (c) 1.0 Pa s; and
1.0 volume fraction and a viscosity of (d) 0.001 Pa s, (e) 0.1 Pa s and (f) 1.0
Pa s.
Figure 5.11: Same as Figure 5.10 but for 2 semi-circular obstructions (▬▬) with radius 4
mm.
Figure 5.12: Liquid velocity flow field snapshots for 0.2 volume fraction. (a) to (d) for 2
semi-circular obstructions with 4 mm radius and (e) to (h) without obstruction
case. Velocity colour scale indicates a range from 0 m/s (blue) to 0.3 m/s
(red).
Figure 5.13: Variation of the structural (■) and liquid frequencies for different fill levels and for (a) upright (♦), (b) horizontal (♦) and (c) inverted (▲) positions of the
egg.
Figure 5.14: Variation of the experimental (▲) and numerical (0.01 friction coefficient ♦,
1 Chapter 1
INTRODUCTION
Tall structures, such as towers and bridges, are subject to wind and earthquake loads which
can cause them to oscillate at excessive magnitudes. Liquid sloshing absorbers with shallow
or deep liquid levels can be used to suppress these excessive oscillations for structural control
purposes (Modi et al., 1996; Modi and Munshi, 1998; Tamura et al., 1996) by tuning the
frequency of the sloshing to the critical frequency of the structure to be controlled. These
absorbers are simple structures consisting of a partially full container of liquid with a free
surface. Tuning ensures that significant amounts of harmful energy can be extracted from the
structure to the sloshing liquid. However, there needs to be a rapid means of dissipating this
energy to avoid its returning back to the structure (then back to the liquid periodically).
A simple configuration of a structure is displayed in Figure 1.1 with an attached shallow
liquid level rectangular sloshing absorber. A shallow liquid level refers to a liquid height
sufficiently smaller than the sloshing wavelength, defined by the free surface length, such
that the liquid motion is governed by travelling waves. Alternatively, a deep liquid level
results in primarily standing wave motion. A free surface is marked in the container attached
on top of a single degree-of-freedom structure. The structure’s motion excites the fluid within
the absorber producing sloshing waves. This fluid motion moves out of phase with the
structure, causing the fluid to exert counteracting pressure forces on the container walls,
2 design, low manufacturing cost and minimal maintenance. Also, a sloshing absorber can be
installed into existing and new structures.
Shallow liquid level sloshing absorbers are the main focus of this thesis. This is because
sloshing absorbers with shallow liquid levels have been found to be more effective energy
dissipaters than deep liquid level sloshing absorbers (Guzel el al., 2005; Modi and Munshi,
1998; Marsh et al., 2010). Rectangular shaped sloshing absorbers with shallow and deep
liquid levels have attracted considerable attention in the literature (Modi et al., 1996;
Colagrossi et al., 1994; Colagrossi et al., 1996).
Variations of the standard rectangular container sloshing absorber to improve the energy
dissipation performance have been the focal point of several previous studies. Some
variations include flexible container walls (Gradinscak et al., 2002), a fluid submerged net in
the container (Kaneko and Mizota, 2002), baffles attached to container walls (Anderson et al.,
2000), wedge shaped fluid obstacles on the bottom of the container (Modi and Akinturk,
2002), container with embossments on the walls (Young-Kyu, 2004) and a study of various
shapes including circular and trapezoidal containers (Marsh et al., 2009). However, there is
minimal work in the literature on the energy dissipation performance of surface roughness
elements (obstructions) attached to the base of a sloshing absorber, other than that of Modi
and Munshi (1998). The primary objective of this thesis is to further investigate the potential
to improve the design of sloshing absorbers with surface roughness elements for structural
3 The secondary objective of this thesis is to demonstrate the potential of a numerical
modelling tool (Smoothed Particle Hydrodynamics – SPH) to predict fluid-structure
interactions. The SPH code used in this thesis has been previously developed by CSIRO
(Commonwealth Scientific and Industrial Research Organisation) Division of Mathematics,
Informatics and Statistics. Due to its Lagrangian nature SPH can accurately capture complex
free surface behaviour (Monaghan, 1992; Cleary and Prakash, 2004) without the need for a
mesh structure. Consequently, the potential problem of empty control volumes, which would
exist with a grid based Computational Fluid Dynamics (CFD) model, as the sloshing of a
shallow level liquid exposes the bottom of the container, does not exist with this technique.
Here, SPH is used to model two and three-dimensional liquid sloshing absorbers with
predictions validated experimentally. A standard form of the quasi-compressible SPH method
has successfully been used to model fluid flows for several industrial and environmental
applications (Cleary et al., 2007; Cleary and Prakash, 2004). A detailed description of the
method can be found in Monaghan (1992). A brief description of the method is presented in
Appendix 1. Each chapter’s novelty within this thesis is summarised next. Every chapter
contains its own introduction, literature review, discussion and conclusions. All tables and
figures are given at the end of each chapter.
Earlier work demonstrated the superior energy dissipation efficiency of a rectangular liquid
sloshing absorber through the introduction of semi-circular obstructions attached to the base
of the absorber (Modi and Munshi, 1998). A parametric free-vibration study was undertaken
showing a significant increase in energy dissipation when the obstructions are introduced.
Consequently, suggested experimental optimum ratios were given by Modi and Munshi
4 location. However, this optimum obstruction case was only analysed at a single structural
frequency. As wind and earthquake loads are random in nature, a sloshing absorber that is an
effective energy dissipater over a range of structural frequencies and initial structural
displacement amplitudes is attractive for design purposes. As a result, in Chapter 2, a
sloshing absorber with attached obstructions using optimum ratios, from Modi and Munshi
(1998), is compared to optimal cases without an obstruction and analysed over a range of
structural frequencies and initial displacements. This study is undertaken numerically, using
SPH, with results validated with the experimental results from Modi and Munshi (1998).
Comparing improvements in performance with obstructions over a range of structural
frequencies has not been undertaken previously in the literature.
An initial structural displacement amplitude study was undertaken in Modi and Munshi,
comparing logarithmic damping factors of cases with and without attached obstructions.
However, due to uncertainties in determining the damping factor, as discussed in Chapter 2,
10 % and 5 % settling time is used as the main performance indicator throughout this thesis.
A 10 % (or 5 %) settling time is the time taken for the structure to oscillate within 10 % (or 5
%) of its initial displacement. Using settling time as the performance indicator gives even
more promising results than observed with displacement amplitudes. In the present study,
SPH capabilities are utilised to present further improvements with attached obstructions in
structural control. In Chapter 2, displacement histories and liquid velocity flow fields are
analysed for collision instances and interaction between the liquid and walls or obstructions.
5 The main focus of Chapter 3 is to further explore the full potential of the effects of surface
roughness elements. Further exploring the effect of size, number and location of these
designed obstructions with respect to liquid height is the topic of interest in this chapter.
Increased effectiveness is observed in the cases analysed in Chapter 3 compared to the study
in Modi and Munshi (1998). An in-depth numerical and experimental comparison study is
undertaken to validate the numerical model as well as determine how the attached
obstructions enhance energy dissipation. This study consists of structural displacement
history and liquid free surface shape comparisons, which have not been undertaken
previously in the literature for an absorber with attached obstructions. Both experimental and
numerical predictions are presented in the form of design recommendations. The design
recommendations contribute to the literature by giving evidence on how to significantly
increase energy dissipation within the sloshing absorbers for engineering applications3,4.
An earlier experimental study, in Semercigil et al. (2013), demonstrated that effective control
can be achieved by using the inclination of the container as the only design parameter for
varying structural frequencies. Varying the inclination of the container varies the static free
surface length and therefore the liquid frequency. Generally, optimal energy dissipation is
achieved when the liquid frequency equals the frequency with which the structure oscillates
(Kareem, 1990; Banerji et al., 2000). Hence, there is potential for the inclination angle to be
an effective tuning parameter. Furthermore, the potential for one inclination angle that is
effective over a range of structural frequencies is attractive for design purposes. In Chapter 4,
two-dimensional numerical predictions, using SPH, are validated with experimental
observations from Semercigil et al., (2013). Numerical cases are analysed over varying
6 responsible for effective energy dissipation. An inclination angle that is effective over a range
of structural frequencies is established. Surface roughness elements are attached to the base
of the absorber to explore the potential to increase energy dissipation5.
The raw hen’s egg uses liquid sloshing to efficiently dissipate energy to protect its embryo.
Determining the effective dissipation characteristics inherent in the egg’s unique shape
possesses significant advantages for liquid sloshing absorber design in structural control
applications. Therefore, determining the egg’s effective dissipation characteristics is the main
focus of Chapter 5. Three-dimensional numerical predictions in this chapter are undertaken
using SPH. These numerical predictions are validated with experimental observations from
So and Semercigil (2004). Three-dimensional numerical analysis of the egg, using SPH, has
not been undertaken previously in the literature. SPH is also used to analyse complex liquid
free surface shapes and identify the natural egg’s effective energy dissipation characteristics.
Fill volume and viscosity of the sloshing liquid are investigated in this chapter to establish
parameters that produce effective dissipation. Attaching surface roughness elements to the
egg to improve energy dissipation further is also investigated. Finally, a frequency study is
undertaken to provide an understanding of the insensitivity to varying fill levels. This
insensitivity implies a form of self tuning, which can potentially provide significant design
advantages6,7.
Conclusions of the thesis are summarised in Chapter 6. The thesis also includes two
appendices. In Appendix 1, a brief description of the SPH method and numerical modelling
technique is given. A resolution study is presented in Appendix 2, justifying the resolution of
7 Figure 1.1: Schematic of the structure with an absorber.
absorber
8 1
Grant, J.A., Prakash, M., Semercigil, S.E., Turan, Ö.T., 2010, Analysing an Efficient Liquid Sloshing Absorber for Vibration Control Using SPH, AFMC (Australasian Fluid Mechanics Conference), Auckland, New Zealand.
2
Grant, J.A., Prakash, M., Semercigil, S.E., Turan, Ö.T., 2013, Analysing an Efficient Liquid Sloshing Absorber for Vibration Control Using SPH, Journal of Fluids and Structures, under preparation.
3
Grant, J.A., Prakash, M., Semercigil, S.E., Turan, Ö.T., 2010, A Rectangular Absorber with Designed Obstructions to Improve Energy Dissipation, 5th International SPHERIC Workshop, Manchester, England.
4
Grant, J.A., Prakash, M., Semercigil, S.E., Turan, Ö.T., 2013, A Rectangular Absorber with Designed Obstructions to Improve Energy Dissipation Using SPH, Journal of Fluids and Structures, under preparation.
5
Grant, J.A., Prakash, M., Semercigil, S.E., Turan, Ö.T., 2013, Tuning A Sloshing Absorber Through Inclination Using SPH, Journal of Sound and Vibration, under preparation.
6
Grant, J.A., Prakash, M., Semercigil, S.E., Turan, Ö.T., 2012, SPH Simulations and Experiments of Sloshing in an Egg-Shaped Shell, 7th International SPHERIC workshop, Prato, Italy.
7
9 Chapter 2
ANALYSING AN EFFICIENT LIQUID SLOSHING ABSORBER FOR VIBRATION CONTROL USING SPH
2.1 Introduction
Large, flexible structures can vibrate at excessive levels due to wind and earthquake loads,
causing discomfort to occupants or even structural failure. These structures include tall
buildings, long span suspension bridges, communication towers and any section of a machine
or building structure that has a significant free span. A sloshing absorber can be attached to a
structure to reduce these excessive vibrations. A sloshing absorber is a container partially
filled with liquid that has a free surface. A tuned mass damper is another type of absorber,
which requires sensors and actuators that control a large solid mass to move in opposition of
a structures natural frequency. These sensors and actuators are expensive and require regular
maintenance. Sloshing absorbers have a number of advantages compared to a tuned mass
damper including simple design, low manufacturing cost and minimal maintenance and
therefore sloshing absorbers are the main focus of this thesis. Utilising these advantages
would simply be achieved by attaching a sloshing absorber to a large, flexible structure to
reduce vibrations instead of a solid mass damper. Liquid sloshing absorbers have been used
to reduce vibrations in tall buildings in Japan, United States of America, Canada and
Australia (Tamura et al., 1996; Young-Kyu, 2004).
Earlier work demonstrated the superior energy dissipation efficiency of a rectangular liquid
sloshing absorber through the introduction of obstructions (Modi and Munshi, 1998).In this
10 energy dissipation in the presence of the obstruction. Consequently, suggested experimental
optimum ratios were given for a sloshing absorber’s container dimensions, liquid height,
obstruction height and location. However, this optimum case was only analysed at one
structural frequency. As wind and earthquake loads are random in nature, a sloshing absorber
that is an effective energy dissipater over a range of structural frequencies and excitation
amplitudes is attractive for design purposes in structural applications. As a result, a sloshing
absorber with an attached obstruction using optimum ratios from Modi and Munshi, (1998) is
compared to optimal cases without an obstruction and analysed over a range of structural
frequencies.
Generally, tuning a sloshing absorber to achieve optimum energy dissipation requires the
frequency of the sloshing to equal the natural frequency of the structure (Kareem, 1990;
Banerji et al., 2000). The key parameters for determining the sloshing frequency within a
rectangular absorber are the container length and liquid height. For consistency with the study
by Modi and Munshi (1998), container length or free surface length remains constant
throughout this chapter and variations in liquid height are investigated. Liquid heights that
produce a sloshing frequency that equals the frequency of the structure are analysed over a
range of structural frequencies. These ‘tuned’ liquid height cases, without and with an
obstruction using the previously mentioned optimum ratios are compared with the most
effective energy dissipation cases without and with an optimum obstruction, from Modi and
Munshi (1998). This study is undertaken to determine if the most effective cases, from Modi
and Munshi (1998), are more effective than the ‘tuned’ liquid height cases over a range of
11 An initial structural displacement amplitude study was undertaken by Modi and Munshi
(1998), comparing cases with and without attached obstructions. However, results from this
chapter show differences compared to the study, by Modi and Munshi (1998), analysing the
same cases. Therefore, an initial displacement amplitude study is presented in this chapter to
determine the potential of the obstructions effectiveness over a range of initial structural
displacements.
In this chapter, numerical predictions are undertaken using Smoothed Particle
Hydrodynamics (SPH). A standard form of the quasi-compressible SPH method has
successfully been used to model fluid flows for several industrial and environmental
applications (Cleary et al., 2007; Cleary and Prakash, 2004). In Chapter 3, numerical
predictions using this SPH code are validated with experimental observations for a similar
setup to this chapter. Due to its Lagrangian nature, SPH can accurately capture complex free
surface behaviour (Monaghan, 1992; Cleary and Prakash, 2004). A two-dimensional
rectangular sloshing absorber with and without obstructions is modelled here to further
investigate the experimental data, from Modi and Munshi (1998). Also, the experimental data
is compared with the numerical predictions to validate the SPH model.
2.2 Surface Roughness Elements
Attaching semi-circular surface roughness elements (obstructions) to the base of a rectangular
liquid sloshing absorber container were suggested to increase the velocity of the liquid
travelling wave. Liquid is accelerated while flowing past an obstruction (V2 > V1) as
12 velocity of the travelling wave produces increased potential energy within the liquid at the
wave-to-wall interactions. Therefore, enhanced energy dissipation can be achieved through
attaching these designed obstructions to a liquid sloshing absorber.
Optimum ratios, for absorber and obstruction geometries, to achieve increased energy
dissipation were given by Modi and Munshi (1998). These optimum ratios for a sloshing
absorber contain parameters consisting of container length or liquid free surface length (L),
liquid height (hw), obstruction height (r) and location (d) displayed in Figure 2.1(b).
Optimum ratio, obstruction location to container length or free surface length (d/L) equals 0.
This suggests that an obstruction located in the centre of a container gives optimum energy
dissipation. As a result, a rectangular absorber with 1 obstruction attached in the centre of the
absorber’s base is analysed in this chapter.
Another obstruction case tested by Modi and Munshi (1998) that shows promising dissipation
characteristics is the case with 2 obstructions with a d/L of 0.25. Both cases with 1 and 2
obstructions were analysed at a structural frequency of 0.64 Hz and have an obstruction
height of 6 mm, liquid height of 8 mm and free surface length of 370 mm. Therefore, these
cases have optimum ratios of obstruction height to liquid height (r/hw) of 0.75 and liquid
height to free surface length (hw/L) of 0.02. The two obstruction cases are compared to the
optimum energy dissipation case without obstructions from Modi and Munshi (1998), which
has a liquid height of 14.9 mm. These cases are analysed over structural frequencies of 0.36
13 2.3 Frequency Study
Tuning a sloshing absorber to achieve optimum energy dissipation is usually accomplished
by choosing the frequency of the sloshing liquid (fL) that equals the natural frequency (fs) of
the structure (Kareem, 1990; Banerji et al., 2000). The key parameters for determining the
sloshing frequency within a rectangular absorber are the container length and liquid height.
For consistency with Modi and Munshi (1998), container length or free surface length
remains constant throughout this study and variations in liquid height are investigated. For a
given structural frequency, the suggested liquid height to achieve optimal energy dissipation
is determined using theoretical tuning, Equation 2.1 (Blevins, 1979). This expression is for a
shallow liquid inside a rectangular container.
g L f hw L
2 ) 2 (
=
, (2.1)
where fL, L and g are liquid frequency, free surface length and gravitational acceleration,
respectively. The free surface length of all cases analysed in this chapter remains constant at
370 mm. However, in liquid heights producing high velocity travelling waves and large free
surface discontinuities, this equation may not be as important (Marsh et al., 2009). Instead,
efforts to increase energy transfer and dissipation through tuning can produce enhanced
14 Structural frequencies (fs) analysed in this chapter are 0.36 Hz, 0.5 Hz, 0.64 Hz, 0.78 Hz and
0.92 Hz. These structural frequencies were chosen as they cover a realistic range of
frequencies for a large structure such as a tall building. Therefore, frequencies outside of this
range are not of interest. Of course, this small model would not be applied directly to a real
structure due to the difference in absorber to structure mass. Effective control can be
achieved at an absorber to structure mass ratio of 1 % for a lightly (more than 2 %) damped
structure (Banerji et al., 2000). Therefore, to achieve this mass ratio, the absorber’s
geometries and liquid volumes analysed in this chapter would need to be a part of a larger,
compartmentalised arrangement. As a result, the number of absorbers required to produce
effective control of the structure would depend entirely on the structure’s mass.
The optimum obstruction case, from Modi and Munshi (1998), produces a liquid frequency
(fL) of 0.38 Hz. As a result, for structural frequencies of 0.36 Hz, 0.5 Hz, 0.64 Hz, 0.78 Hz
and 0.92 Hz, this case has fL/fs of 1.1, 0.76, 0.6, 0.49 and 0.41. Cases with liquid heights
using Equation 2.1 for these structural frequencies are 7.2 mm, 14 mm, 22.9 mm, 34 mm and
47.2 mm. An obstruction is then attached to the centre of the container. Obstruction heights
of 5.4 mm, 10.5 mm, 17.2 mm, 25.5 mm and 35.4 mm are determined using the optimum
ratio, r/hw of 0.75.
2.4 Initial Condition Dependence
An initial structural displacement amplitude study was undertaken by Modi and Munshi
(1998). The displacement amplitude of the structural oscillations affects the liquid motion
15 are barely noticeable within the liquid and energy dissipation is negligible. At amplitudes 1 to
2.5 degrees, a single wave is produced accompanied by small ripples in the liquid. Small
wave breaking at the wave-to-wall interactions is also observed. At amplitudes from 2.5
degrees to 8.5 degrees (maximum analysed), free surface deformation and high velocity
travelling waves of the liquid are observed producing high kinetic energy of the liquid mass.
These characteristics result in significantly increased energy dissipation.
Snapshots of the velocity contours, using SPH, at particular instances for the 1 obstruction
case with a 16 degree initial displacement are displayed in Figure 2.2. Velocity scale runs
from 0 m/s to 0.8 m/s. At displacement amplitudes above 2.5 degrees, high velocities (in red)
occur within the liquid, in Figure 2.2(a) and large free surface deformation occurs at the right
wall, in Figure 2.2(b) as the structure oscillates from left to right. These predictions agree
with the liquid motion characteristics observed at structural displacements above 2.5 degrees
by Modi and Munshi (1998). This gives confidence that SPH is a promising numerical tool to
further analyse the liquid sloshing absorbers in this chapter.
The study presented in Modi and Munshi (1998) compared cases with and without attached
obstructions for varying initial displacement. This study suggested that the case with an
obstruction produced increased energy dissipation than compared to the case without an
obstruction from initial displacement amplitudes from approximately 0 to about 4 degrees.
Above 4 degrees, the case without obstructions produced increased energy dissipation. From
experiments and numerical predictions undertaken in Chapter 3, using different optimum
16 achieve increased energy dissipation at an initial displacement of 16 degrees compared to
cases without obstructions. Discrepancies in the effectiveness of the attached obstructions,
compared to the study by Modi and Munshi (1998), are due to the difference in the
performance indicator used in this chapter, discussed in Section 2.6.
As wind and earthquake loads are random in nature, a sloshing absorber that is an effective
energy dissipater over a range of excitation amplitudes is attractive for design purposes in
structural applications. Therefore, an initial displacement amplitude study is undertaken in
this chapter to determine the potential of the obstructions effectiveness over a range of initial
structural displacements. Cases are analysed over initial displacement amplitudes from 1.25
to 16 degrees. Cases outside of this initial displacement history range are not of importance.
2.5 Numerical Model
Numerical predictions are undertaken using Smoothed Particle Hydrodynamics (SPH) to
predict fluid-structure interactions. The SPH code used here is developed by CSIRO
(Commonwealth Scientific and Industrial Research Organisation) Division of Mathematics,
Informatics and Statistics. Due to its Lagrangian nature SPH can accurately capture complex
free surface behaviour (Monaghan, 1992; Cleary and Prakash, 2004) without the need for a
mesh structure. In this chapter, SPH is used to model two-dimensional liquid sloshing
absorbers. A standard form of the quasi-compressible SPH method has successfully been
used to model fluid flows for several industrial and environmental applications (Cleary et al.,
2007; Cleary and Prakash, 2004). A brief description of the method is presented in Appendix
17 The two-dimensional structure and the sloshing absorber system are represented by a rigid
body, having the same dimensions as the rectangular sloshing absorber from Modi and
Munshi (1998) in Figure 2.3(a). The structure’s motion is restricted to dynamic rotation about
its pivot point. A container to accommodate the sloshing liquid is mounted on top 670 mm
above the pivot point. Tethers are attached, representing the structure’s stiffness and
mechanical damping. Water is used as the sloshing liquid with a density of 1000 kg m-3 and
dynamic viscosity of 0.001 Pa s.
As this structure is excited, the container on top is subjected to angular oscillations. The
uncontrolled structure, for a liquid height of 8 mm, has a mass moment of inertia of 3 kg m2.
The displacement history of the uncontrolled structure after an initial displacement of 2.5
degrees is displayed in Figure 2.3(b). The uncontrolled structure’s slow decay is due to its
light damping and critical damping ratio of 1 %. The rectangular absorber’s size for the
numerical validation remains constant for the study with a length (L) and height (H) of 370
mm and 125 mm respectively. Therefore the wavelength of the fluid or free surface length is
also 370 mm. To achieve constant liquid to structure mass ratio, the uncontrolled structure for
liquid heights of 7.2 mm to 47.2 mm has a mass of 14.9 kg to 97.9 kg and mass moment of
inertia of 2.7 kg m2 to 17.6 kg m2 respectively, at rest position.
An SPH particle size of 0.8 mm x 0.8 mm is suitable to accurately model liquid heights 8mm
and above. For liquid heights below 8 mm a particle size of 0.4 mm x 0.4 mm is used. These
18 shallow liquid levels used in this study and capture all flow characteristics without
significantly increasing simulation run time. Time stepping in this code is explicit and is
limited by the Courant condition modified for the presence of viscosity, presented in
Appendix 1. The time step used for integration is 10-6 s. The total real time is 25 seconds for
all simulations. The length of simulation time is irrelevant for the reliability of the
predictions, as statistical averages are not reported, but simple comparisons of transient
vibrations. The number of boundary particles used to model the structure and absorber
container is about 8,800. The number of fluid particles used for liquid heights 7.2 mm to 47.2
mm varied from approximately 7,800 to 26,700.
To replicate the experimental initial conditions, from Modi and Munshi (1998), the structure
is offset from 0degrees to an initial displacement amplitude from 1.25 to 16 degrees over 3
seconds. The fluid within the container is given 2 seconds to settle under gravity to reach a
state of rest (approaching 0 m/s). The structure is then released, exciting the fluid within the
container and allowing the structure to move and respond freely.
2.6 Performance Indicator
Logarithmic damping factor, δ, was the main performance indicator used by Modi and
Munshi (1998), given in Equation 2.2.
) (
) ( ln 1
nT t x
t x
n +
=
19 where n, x(t) and x(t + nT) are number of cycles, initial displacement amplitude and
amplitude after ‘n’ number of cycles, respectively. The damping factor may not give a true
representation of the cases’ effectiveness to dissipate energy as the damping factor is an
assumption of behaviour of a perfectly linear oscillator. As the displacement amplitude decay
of the controlled structure is not linear the damping factor will vary depending on where the
sample is taken. For example, the displacement history of the case without an obstruction,
with a liquid height of 8 mm, in Figure 2.4(c), has a damping factor of 1.6 for the first cycle
of oscillation. However, the second and third cycles of oscillation produce damping factors of
0 and 0.9, respectively. Determining a complete cycle of oscillation is also difficult to specify
when a distinctive beat is observed in the displacement history as of that in Figure 2.4(c) for
the case with a liquid height of 14.9 mm (blue dashed line) at around 2 s. Therefore, in this
chapter, 10 % and 5 % settling times are chosen, instead of damping factor, as the key
performance indicator. Using settling time as the performance indicator maintains
consistency when comparing results of cases with varying structural frequencies and initial
displacement amplitudes.
A 10 % (or 5 %) settling time is the time for the peak displacement of the structure to decay
within 10 % (or 5 %) of the initial displacement. 10 % and 5 % values are chosen as some
indication of performance, and they are not absolute by any measure. Of course, an effective
20 2.7 Numerical Predictions
In the following, SPH predictions using suggested optimum ratio cases, from Modi and
Munshi (1998), without and with an attached obstruction, are analysed over structural
frequencies 0.36 Hz to 0.92 Hz. Then, the performance of theoretical ‘tuned’ liquid height
cases are discussed over the same structural frequencies. Finally, an initial condition
dependence study is presented over initial displacement amplitudes of 1.25 to 16 degrees.
Liquid velocity flow field snapshots for cases of particular interest are also discussed.
2.7.1 Optimum Ratio Cases
Numerical displacement histories for cases with liquid height of 14.9 mm and 8 mm, without
and with 1 semi-circular obstruction located in the centre base of the container are displayed
in Figure 2.4. A liquid height of 8 mm is analysed as it was the most effective case, with an
obstruction height of 6 mm, at a structural frequency of 0.64 Hz, from Modi and Munshi
(1998). The case with a liquid height of 14.9 mm was the most effective without obstructions
at the same structural frequency. These cases have an initial displacement amplitude of 2.5
degrees and are analysed over structural frequencies of 0.36 Hz, 0.5 Hz, 0.64 Hz, 0.78 Hz and
0.92 Hz, displayed in Figures 2.4(a), (b), (c), (d) and (e).
Numerical predictions agree with work by Modi and Munshi (1998), where cases with a
liquid height of 14.9 mm, without an obstruction, increase energy dissipation as structural
frequency increases from 0.36 Hz to 0.64 Hz, in Figures 2.4(a), (b) and (c). This case is most
effective at a structural frequency of 0.64 Hz, in Figure 2.4(c). As structural frequencies
21 structure to cease oscillating as displayed in Figures 2.4(d) and (e) for structural frequencies
0.78 Hz and 0.92 Hz, respectively.
A distinctive beat is observed, around 2 s, in the displacement history of the case with a
liquid height of 14.9 mm, at a structural frequency of 0.64 Hz, in Figure 2.4(c). A beat in the
displacement history gives evidence that the liquid’s sloshing frequency is close to the
structural frequency. If the sloshing frequency equals the structural frequency, the liquid
moves out-of-phase with the structure producing enhanced energy dissipation at the
wave-to-wall interactions. However, as the sloshing frequency does not equal the structural frequency,
the timing of the wave-to-wall interactions are not optimal. As a result, the liquid is unable to
dissipate sufficient energy within the system. Therefore, the energy within the liquid returns
to the structure, resulting in continued structural oscillations, after 2.5 s, in Figure 2.4(c).
At a structural frequency of 0.64 Hz, for the case with a liquid height of 14.9 mm, fL/fs is
approximately 0.8. As suggested in Equation 2.1, to achieve optimal energy dissipation
through tuning, fL/fs should be approximately 1. This agrees with the observed beat at a
structural frequency of 0.64 Hz where tuning is close to being achieved, in Figure 2.4(c).
However, at a structural frequency of 0.5 Hz in Figure 2.4(b), fL/fs is about 1, but this case
becomes less effective requiring increased time to cease oscillating compared to the same
case at a structural frequency of 0.64 Hz, in Figure 2.4(c). The reduction in effectiveness for
cases with fL/fs above 0.8 was also observed by Modi and Munshi (1998). This gives
evidence that it is more important to design a shallow liquid level sloshing absorber to
enhance energy transfer and dissipation than tuning the liquid sloshing frequency to match
22 At a structural frequency of 0.5 Hz, the second wave-to-wall interaction begins as the
structure travels towards the positive peak displacement, at around 2 s, in Figure 2.4(b). The
wave-to-wall interaction, travelling in the same direction as the structure, although
dissipating energy, pushes the structure to a larger peak displacement. At a structural
frequency of 0.64 Hz, the second wave-to-wall interaction occurs at the positive peak
displacement, at about 1.8 s, in Figure 2.4(c). The interaction dissipates increased amounts of
energy as the structure has a velocity of approximately 0 m/s. As a result, the interaction
causes a beat to occur in the displacement history. However, the liquid is unable to dissipate
all the energy from the structure and structural oscillations continue from about 3 seconds, in
Figure 2.4(c).
At a liquid height of 8 mm, using the previously mentioned optimum absorber geometry
ratios, without obstructions, maximum energy dissipation occurs at a structural frequency of
0.5 Hz, as displayed in Figure 2.4(b). A beat is also observed in the displacement history at
about 2.5 s. Also, similar to the case with a liquid height of 14.9 mm, optimum energy
dissipation occurs at fL/fs of about 0.8, in Figure 2.4(c).
Attaching an obstruction to the same rectangular absorber maximum energy dissipation
occurs at a structural frequency of 0.64 Hz displayed in Figure 2.4(c). This is also the most
effective case over all the structural frequencies ceasing oscillations within four cycles.
Increased velocity gradients in the liquid are observed as the wave travels over the
23 Further analysis on how an attached obstruction increases energy dissipation within the
absorber is given later in Section 2.7.4, in the form of liquid flow field snapshots.
10 % and 5 % settling times from cases in Figure 2.4 are displayed in Figures 2.5(a) and
2.5(b). In these figures, the 10 % and 5 % settling times represent the time for the peak
displacement to decay within 10 % and 5 % of the initial displacement (2.5 degrees). Cases at
liquid heights of 14.9 mm and 8 mm without obstructions give similar trends. Both cases
produce similar 10 % settling times, at fL/fs of about 0.8, of 4.6 s and 3.2 s respectively. Also,
both cases produce increased settling times when structural frequency is varied. As
mentioned previously, this gives evidence that it is more important to enhance energy transfer
and dissipation than tuning the liquid sloshing frequency to match the frequency of the
structure (fL/fs of 1).
Attaching an obstruction to the centre of an absorber, using optimum ratios mentioned
previously, increases energy dissipation at all structural frequencies or fL/fs. This is a
significant structural design advantage as wind and earthquake vibrations can cause large
structures to oscillate at varying frequencies. Therefore, attaching an obstruction to the
absorber is recommended for structural applications.
The obstruction case is most effective at an fL/fs of about 0.6 (at the structural frequency of
0.64 Hz), producing a 10 % settling time of 2.3 s, in Figure 2.5(a). This is a substantial
improvement compared to the same case without an obstruction with a reduction in 10 %
24 significant increase, of up to 60 %, in energy dissipation capacity with the introduction of an
optimum obstruction to a liquid sloshing absorber.
As a percentage value of the settling time is not absolute, 5 % settling times for cases in
Figure 2.4 are given in Figure 2.5(b). Here, almost identical trends are observed as compared
to those of a 10 % settling time. This gives confidence that 10 % and 5 % are sufficient
values and that settling time is an accurate performance parameter.
2.7.2 ‘Tuned’ Cases
Numerical displacement histories for ‘tuned’ cases with varying liquid heights, without and
with 1 semi-circular obstruction are displayed in Figure 2.6(a) to 2.6(e). As a reminder,
tuning is achieved by varying the liquid height as the structural frequencies changes. These
cases also have an initial displacement amplitude of 2.5 degrees and are analysed over
structural frequencies of 0.36 Hz, 0.5 Hz, 0.64 Hz, 0.78 Hz and 0.92 Hz, displayed in Figures
2.6(a), (b), (c), (d) and (e). To achieve ‘tuning’ using Equation 2.1, these cases have liquid
heights of 7.2 mm, 14 mm, 22.9 mm, 34 mm and 47.2 mm. Using the optimum ratio r/hw of
0.75, from Modi and Munshi (1998), the cases with an attached obstruction therefore, have
obstruction heights of 5.4 mm, 10.5 mm, 17.2 mm, 25.5 mm and 35.4 mm.
The tuned cases without an obstruction, in Figure 2.6, produce similar effectiveness in
dissipating energy over all structural frequencies than compared to the cases without
obstructions in Figure 2.4. This is expected as each case’s liquid height was chosen to
25 an obstruction increases the frequency of structural oscillations slightly at all structural
frequencies analysed. This is most prominently observed at a structural frequency of 0.36 Hz,
in Figure 2.6(a), where a phase difference occurs during the first cycle.
At such a low structural frequency of 0.36 Hz, there is insufficient energy for the liquid to
travel over the obstruction. As a result, at the initial displacement of 2.5 degrees, the bulk of
the liquid remains compartmentalised to one side of the absorber. This significantly reduces
the structures first negative peak displacement, at approximately 1.9 s, in Figure 2.4(a), and
also increases the damped structure’s natural frequency. For structural frequencies above 0.36
Hz, energy within the system is increased and the bulk of the liquid is able to travel over the
obstruction. Slight increases in peak displacement amplitudes during the first two to three
cycles for cases with an attached obstruction are also observed at structural frequencies of 0.5
Hz to 0.92 Hz in Figures 2.6(b) to 2.6(e). However, an attached obstruction becomes most
effective after about 5 s eliminating small displacement oscillations faster than the case
without an obstruction.
10 % and 5 % settling times from cases in Figure 2.6 are displayed in Figure 2.7(a) and
2.7(b). The horizontal axis represents liquid height to free surface length (hw/L). The
horizontal axis is different to Figure 2.5, which used fL/fs, as each case, in Figure 2.7, has a
liquid height ‘tuned’ so the liquid sloshing frequency equals the structural frequency. As all
26 As mentioned previously, the tuned cases without an obstruction produce similar
effectiveness over all structural frequencies than the cases without an obstruction in Figure
2.4. The difference in 10 % settling time for the ‘tuned’ cases without an obstruction over all
structural frequencies is about 3 s in Figure 2.7(a), where the cases with a liquid height of
14.9 mm, in Figure 2.5(a), have a difference of around 12 s. Adding an obstruction to the
‘tuned’ liquid height cases reduces settling time, therefore increasing energy dissipation over
all structural frequencies or hw/L. This is also a significant design advantage as it gives
evidence that for any liquid height, attaching an obstruction to the centre of the absorber’s
base, using the optimum ratio r/hw of 0.75, increases energy dissipation significantly.
The addition of an obstruction is most effective at a hw/L of about 0.02 (at a structural
frequency of 0.36 Hz), producing a 10 % settling time of 4.2 s. The largest reduction in 10 %
settling time, for ‘tuned’ cases, through the addition of an obstruction is 35 % and occurs at
hw/L of about 0.06 (at a structural frequency of 0.64 Hz). Over the range of structural
frequencies analysed, adding the obstruction at ‘tuned’ liquid heights produces an average
reduction in 10 % settling time of about 30 %.
5 % settling times of the same cases are displayed in Figure 2.7(b) and a similar trend is also
observed as compared to the 10 % settling times in Figure 2.7(a). The only exception is at
hw/L of about 0.02, where the case with an obstruction produces a similar 5 % settling time to
the case without an obstruction. The obstruction case increases in 5 % settling time, when
compared to 10 %, due to some remnant energy which causes small oscillations at the lowest
27 energy is small enough to not indicate this discrepancy, in Figure 2.7(a). The largest
reduction in 5 % settling time through the addition of an obstruction is 45 % and occurs at
hw/L of about 0.09 (for a structural frequency of 0.78 Hz). Overall, the 10 % settling times
show good agreement with similar trends to the 5 % settling times.
2.7.3 Comparisons between Summaries of Optimum and ‘Tuned’ Cases
A summary of 10 % and 5 % settling times from cases in Figures 2.4 and 2.6 are displayed in
Figures 2.8(a) and 2.8(b). The horizontal axis represents the structural frequency, fs (Hz).
These ‘tuned’ and optimum ratio cases are presented again, to determine which case is the
most effective energy dissipater by producing the shortest settling time. The most effective
case for both 10 % and 5 % settling times, at all structural frequencies, from 0.36 Hz to 0.92
Hz, is the single obstruction case using optimum ratios from Modi and Munshi (1998). The
only exception is at a structural frequency of 0.92 Hz, for 10 % settling, in Figure 2.8(a),
where the ‘tuned’ case with an attached obstruction produces a slightly reduced settling time.
Optimum obstruction geometry ratios are used for both these cases and, therefore, results
suggest that attaching an obstruction to a liquid sloshing absorber always increases energy
dissipation.
2.7.4 Energy Dissipation Characteristics of Optimum Obstruction Case
The liquid flow field is compared for the most effective energy dissipation cases without and
with 1 obstruction, from Figure 2.4(c), in Figure 2.9(a) to (h). Left column shows the 1
obstruction case using optimum ratios with a liquid height of 8 mm and the right column