Supergalactic Structure of Multiplets with the Telescope Array Surface
Detec-tor
Jon PaulLundquist1,∗and Pierre V.Sokolsky1on behalf of the Telescope Array collaboration
1High Energy Astrophysics Institute and Department of Physics and Astronomy, University of Utah, Salt Lake City, Utah, USA
Abstract.Evidence of supergalactic structure of multiplets has been found for ultra-high energy cosmic rays (UHECR) with energies above 1019eV using 7 years of data from the Telescope Array (TA) surface detec-tor. The tested hypothesis is that UHECR sources, and intervening magnetic fields, may be correlated with the supergalactic plane, as it is a fit to the average matter density within the GZK horizon. This structure is measured by the average behavior of the strength of intermediate-scale correlations between event energy and position (multiplets). These multiplets are measured in wedge-like shapes on the spherical surface of the field-of-view to account for uniform and random magnetic fields. The evident structure found is consistent with toy-model simulations of a supergalactic magnetic sheet and the previously published Hot/Coldspot results of TA. The post-trial probability of this feature appearing by chance, on an isotropic sky, is found by Monte Carlo simulation to be∼4.5σ.
1 Introduction
The supergalactic plane (SGP) is the average matter dis-tribution of the local universe up to a distance of ∼200 Mpc (a large percentage is within the GZK cutoffof 100 Mpc) [1]. Large scale magnetic fields are known to ex-ist between some clusters of galaxies which make up the supergalactic plane such as the Coma Cluster [2]. And it has been shown that ∼90% of the baryonic mass of the universe is between galaxies of which∼40% is warm-hot protons outside gas clouds [3]. This may allow the forma-tion of intra-galactic large scale magnetic fields ([4],[5]).
The presence of large scale magnetic fields suggest that energy dependent deflection of ultra-high energy cos-mic rays (UHECR) should appear correlated with the SGP. Previous energy-position correlation studies have not had significant results ([6],[7],[8]). These multiplet searches for significant small scale magnetic deflection patterns included scanned parameters chosen by assumed mag-netic field models and compositions. This analysis uses intermediate-scale energy-position correlations to look for significant large scale magnetic structure and minimal as-sumptions are made regarding particular magnetic field models or composition.
2 Energy-Position Correlations
It is assumed that UHECR travel through uniform fields, approximated by Equation 1a, and random fields where the root mean squared deflection is approximated by Equation 1b (Zis mass number,S angular distance,Bfield strength, Eenergy, andLcis mean magnetic field coherence length).
∗e-mail: [email protected]
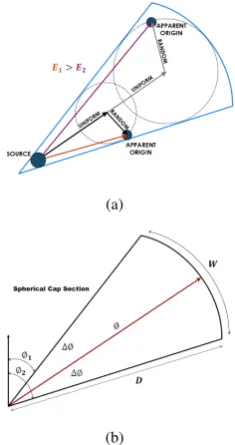
It follows trivially that lower energy cosmic ray events are deflected to larger angles from a source than those with higher energy [9]. This drift-diffusion process, where high energy events are deflected from a source less than lower energy events, is diagrammed in Figure 1.
δ≈0.5◦Z S kpc
B
µG 1020eV
E (1a)
δrms≈0.1◦Z Brms
µG
1020eV E
s
S kpc
s
Lc
100pc (1b)
2.1 Correlation
The angular distance between two points on a sphere is the great circle distance (Equation 2 for normal vectors). Cor-relations between energy and angular distance are found using Kendall’sτbranked correlation that measures mono-tonic dependence [10]. Ranked correlation removes mag-netic model and composition assumptions and also detec-tor exposure effects on the correlation strength.
δi j=arctan
|nˆi×nˆj|
ˆ
ni·njˆ (2)
The simplified τa, not taking into account duplicate values, is shown in Equation 3 for brevity. The diff er-ence between τa andτb in this analysis is small. Ranks are the ordering of a sorted variable (1st, 2nd, etc.). A pair of observed ranks (xi, yi) and (xj, yj) are concordant if xi>xjandyi > yj(or the converse). They are discordant ifxi>xjandyi< yj(or the converse).
τa=
(#concordant pairs)−(#discordant pairs)
(a)
(b)
Figure 1. Drift-diffusion deflection of UHECR from a source. (a) Two events having traveled through uniform and random magnetic fields. The purple vector represents the lower en-ergy event spherical arc and the red vector is a higher enen-ergy event. Random and uniform field components describe the av-erage magnetic field perpendicular to the surface of the field of view (FOV) sphere. Dashed circles represent possible random field deflections. (b) A spherical cap section, “wedge,” best en-compasses the likeliest positions. Pointing direction is the spher-ical arcφ, width is∆φ, andDis the maximum angular distance.
For a correlation of −1 (perfect discordance) an in-crease (dein-crease) ofxalways follows a decrease (increase) iny. For+1 (perfect concordance) an increase (decrease) ofxalways follows an increase (decrease) ofy.
The pre-trial significance of a correlation (probability ofτb=0 with infinite samples) is a function of correlation strength and sample size. This is found by permutations of the sample or the large sample limit of Equation 4 (again forτa) that follows the standard normal distribution.
z= √ τa3n(n−1)/2
n(n−1)(2n+5)/2 (4)
2.2 Correlation Filter
With the drift-diffusion picture of Figure 1 in mind, pos-sible UHECR deflections from a source are found by cal-culating energy-position correlations inside spherical cap sections, or “wedges,” on a grid of points with an equal spacing of 2◦within the field of view (FOV) [11].
These wedge bins are defined by a maximum radius
δjfrom the grid point,i, (Equation 2) and the boundaries of two azimuths (Equation 5a). The azimuths go clock-wise and a wedge pointed towards 90◦ supergalactic lat-itude (SGB) has an azimuth, φ, of zero and one pointed towards -90◦ SGB has aφof 180◦. The angular distance between the wedge pointing direction, φi, and an events azimuth is given by Equation 5b.
φi j=atan
cosBisin (Li−Lj)
cosBjsinBi−sinBjcosBicos (Li−Lj) (5a)
∆φi j =mod(|φi j−φi|+180,360)−180 (5b) With this correlation filter shape four parameters must be scanned at every grid point to maximize the pre-trial significance. Though negative correlations are physically expected from magnetic deflections; the sign of the corre-lation, and its strength, are not scanned for nor restricted. The limits on these parameters are large to account for conceivable deflection scenarios and are the following:
1. Energy Threshold,Ei: 10 to 100 EeV, 5 EeV steps. 2. Wedge Angular Distance,Di=max(δi j): 15◦to 90◦,
5◦steps.
3. Wedge Direction,φi: 0◦to 355◦, 5◦steps.
4. Wedge Width,Wi=2∗max(|∆φi j|): 10◦to 90◦, 10◦ steps (5◦on each side ofφ
i).
Events are in the wedge ifEj≥Ei&δi j≤Di&−Wi/2≤ ∆φi j ≤ Wi/2 (iis the grid point index). The parameters (Ei,Di, φi, and Wi) are chosen for the minimum energy-position correlation,corr(δi j,Ej), p-value (Equation 4).
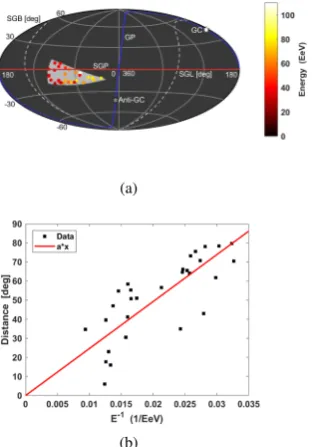
The most significant correlation is at 18.3◦ SGB, -12.9◦ SGL and shown in Figure 2(a). With 29 events (E≥30 EeV)τb=−0.675 has pre-trial significance of 5.5σ. Figure 2(b) shows a scatter plot of energy versus angular distance and a linear fit (Equation 1a withZ=1) results in an estimate ofS∗B = 49.24 kpc*µG. If the source is as-sumed to be at the distance to M82 (3.7 Mpc) the uniform magnetic field required to cause this deflection would be B=13 nG.
3 Simulations
Two Monte Carlo (MC) simulated event sets are used in this analysis. This first is an isotropic simulation assuming no specific sources or correlation with the supergalactic (or galactic) plane. The analysis is applied to isotropic simu-lations for the significance calculation of any anisotropy found as described further in Section 4. The second is a simple simulation of a supergalactic magnetic sheet result-ing in an energy dependent diffusion of events away from the supergalactic plane. This is used to motivate the statis-tic that tests the hypothesis of supergalacstatis-tic sources and magnetic fields; this test statistic is described in Section 4 and is searched for in the isotropic MC. These simulations can also be used as an estimate of the average uniform field strength between us and supergalactic sources.
3.1 Isotropic Simulation
(a)
(b)
Figure 2. (a) Supergalactic Hammer-Aitoff projection of the maximum significance “wedge” at 18.3◦SGB, -12.9◦SGL. The
correlation τb=−0.675 and with 29 data events has a pre-trial one-sided significance of 5.5σ. The energy threshold isEi≥30 EeV, wedge widthWi=30◦, angular distanceDi=80◦, and direc-tionφi=90◦. (b) Scatter plot of 1/Eversus angular distanceδin the wedge.
Energy spectrum detector biases are taken into ac-count by interpolation sampling a large set of MC recon-structed through a surface detector simulation thrown with the HiRes/TA spectrum ([12], [13]). The same cuts as data are applied to these fully simulated events and there are 386,125 with energies E≥1019.0eV. The number of events in each isotropic MC event set is the same as data in each 5 EeV bin. Each set of isotropic MC events simulates the expected data given the detector configuration and on-time with no energy anisotropies.
3.2 Supergalactic Magnetic Sheet Simulation
A simple toy-model simulation of an intervening super-galactic magnetic sheet is made by embedding event de-flections in supergalactic latitude (SGB), proportional to 1/energy, for a fraction of events in isotropic simulations. The approximate apparent deflection from the source of a charged particle in a uniform magnetic field is shown in Equation 1a [9]. A supergalactic sheet simulation, with an F = 65.7% isotropic fraction (1988 out of 3027 events) andS∗B=18.47 kpc∗µG, is shown in Figure 3.
Unlike the isotropic simulations data coordinates are not used. To take into account the TA exposure on-time is simulated by sampling the trigger times of 264,499 data events with E>1017.7eV. The azimuthal angle distribution is uniform from 0◦to 360◦and the zenith angle distribution is g(θ)=sin(θ)cos(θ) due to the flat SD array.
The deflections δj are calculated for each MC event, j, assuming proton (Z=1) and an S∗B; events with
ini-Figure 3. Toy-model supergalactic magnetic sheet simulation. Blue circles are theF=65.7% isotropic fraction of MC events. Red squares are the anisotropic MC events magnetically diffused away from the supergalactic plane with S∗B=18.47 kpc∗µG. Overall, event positions are isotropic and the energy spectrum is created according to the published HiRes/TA result.
tial positiveS GBhave a positive deflection and a negative S GBhave a negative deflection. Then the event positions, S GBj, and energies,Ek, are decoupled into separate sets. The energies,Ek, and their deflection fromS GB=0 (δk) are assigned to the closestS GBjvalue (min[δk-S GBj]) in random order.
For anyS∗Bthere will be a number of event positions that must be assigned isotropic energies due to the mini-mum deflection and the FOV. After the assignment of an S GBjthe energies,Ek, with a position-deflection error of
|S GBj−δk|>10◦are put into the isotropic proportion. This allows some random noise in the simulation.
Event positions ofS GBj<min(|δk|) (the center of Fig-ure 3), orS GBj>max(|δk|) (the edges of Figure 3), are also part of the isotropic proportion. For larger isotropic total fractions,F, a random selection of energies and positions are taken from the anisotropic portion and randomized.
4 Supergalactic Structure
(a)
(b)
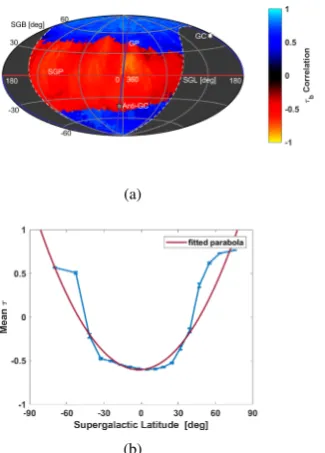
Figure 4. Supergalactic magnetic sheet simulation. (a) Projec-tion of the correlaProjec-tion strengthτbfor all grid points. Solid curves indicate the galactic plane (GP) in blue and supergalactic plane (SGP) in red. (b) Meanτbinside equal solid angle bins for the supergalactic magnetic sheet simulation. The parabola shows the curvature parameter,a, chosen as the test statistic.a=2.5×10⁻⁴.
4.1 Significance Test
The single parameter necessary to test the supergalactic structure of multiplets hypothesis is the curvature parame-ter, “a,” of a parabolic fit (ax2+bx+c) to the meanτ
bin the supergalactic latitude bins shown in Figure 4(b). Due to the boundaries of|τb|≤1 and|S GB|<90◦greater correla-tion curvature,a, corresponds to a minimum closer to the supergalactic plane as shown in Figure 5. It also means that the minimum negative correlation, and maximum pos-itive correlation, averages are larger in magnitude.
Figure 5.The correlation mean parabola fit curvature, as in Fig-ure 4(b), versus minimum for 200,000 isotropic MC sets shows that a high curvature has a tendency for a minimum near the su-pergalactic plane. The red dot is the data result.
To calculate the data significance of a supergalactic structure of multiplets the analysis described above is ap-plied, both to the data, and the isotropic MC sets. The
number of MC sets with a correlation curvature,a, greater than the data gives the probability that there is not a super-galactic structure of multiplets.
5 Data Set
SD data recorded between May 11 of 2008 and 2015 is used for this analysis. The energy of reconstructed events is determined by the SD array and renormalized by 1/1.27 to match the calorimetrically determined fluorescence de-tector energy scale ([14]). The reconstruction of these events is the same as the “Hotspot” analysis of [15]. Due to the inclusion of lower energy events, down to 1019.0eV, tighter data cuts are required for good zenith angle resolu-tion.
After cuts, there are 3027 events in the data set. Events in the data set match the following criteria:
1. E≥1019.0eV (where detection efficiency is∼100%).
2. At least four SDs triggered.
3. Zenith angle of arrival direction<55◦.
4. Reconstructed pointing direction error<5◦.
5. Shower core>1.2 km from array boundary.
6. Shower lateral distribution fitχ2/do f<10.
The additional cuts on pointing direction error and boundary distance improve the agreement between the dis-tribution of zenith angles compared to the geometrical zenith angle exposure g(θ)=sin(θ)cos(θ). The azimuthal angle distribution is in very good agreement with the the-oretical flat distribution. The energy spectrum is also in good agreement with the published spectrum ([14],[16]).
The energy resolution and zenith angle resolution of events in the data set range from∼10 to 15% and∼1.0◦to 1.5◦respectively, depending on core distance from the ar-ray boundary and improve with increasing energy. These resolutions are sufficient to search for UHECR energy anisotropies.
6 Results
The resulting data energy-position correlations are shown in Figure 6(a). Individual correlations with the highest pre-trial significance are negative which means that there is a trend for the angular distance to increase with decreasing energy. This is the expectation for a grid point that hap-pens to be near a UHECR source of magnetically scattered events. It can be seen that the negativeτbcorrelations ap-pear well correlated with the supergalactic plane.
(a)
(b)
Figure 6.Data result. (a) Projection of the correlation strengthτb for all grid points. Negative correlations expected for magnetic deflections are apparent around the supergalactic plane. Solid curves indicate the galactic plane (GP) in blue and supergalac-tic plane (SGP) in red. White and grey hexagrams indicate the Galactic center (GC) and anti-galactic center (Anti-GC) respec-tively. (b) Meanτbinside equal solid angle bins. The correlation curvature for the data isa=2.4×10⁻⁴.
6.1 Significance of Correlation Curvature
By applying this analysis to isotropic MC sets and count-ing the number of MC with ana parameter greater than data (Figure 6(b)), the post-trial significance of the super-galactic structure of multiplets can be found. The resulting a distribution of 200,000 MC sets is shown in Figure 7. The number of MC sets created was limited by the com-puting time necessary for each simulation.
Figure 7.The distribution of the correlation curvature parameter
achosen as the supergalactic structure of multiplets test statistic for 200,000 isotropic MC sets. The purple bars are the MC PDF. The red line is a Gaussian distribution fit to the MC distribution. The data curvature isa=2.4×10⁻⁴shown as a blue vertical line.
There are two MC sets with a larger curvature than data which gives a significance of 4.3±0.2σ. The area under
the Gaussian fit froma=2.4×10⁻⁴ toa=∞gives a signif-icance of 4.6σ. Therefore, the resulting significance of a supergalactic structure of multiplets is about∼4.5σ.
6.2 Scan Parameter Distributions
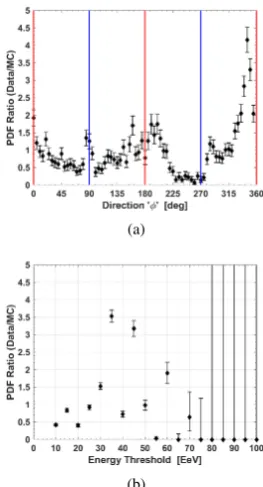
Clues about UHECR sources, and intervening fields, may be found from the maximum significance wedge scan pa-rameters of the apparent magnetic deflection multiplets. Due to the significance maximization there is a bias to-wards larger statistics so the data is compared to isotropic MC by taking the ratio of the parameter PDFs (Data/MC). PDF ratio plots for the wedge angular distance and energy threshold parameters are shown in Figure 8.
These ratios are for negative correlations at positions -40◦<S GB
i<40◦and have a linear fit to 1/Eversus angu-lar distance with anR2>0. AnR2>0 is a better fit than a horizontal line and theδ∝E model explains some of the variance. For data there are 2045 correlations used and greater than 3.99×10⁸for MC.
The data distributions of wedge angular distance, D, and width, W, do not show significant deviations from isotropy. The distribution of wedge pointing directions, Figure 8(a), indicates supergalactic structure with three deviations correlated with the supergalactic plane (SGP). Two peaks are approximately perpendicular to the SGP and one is parallel. This suggests diffusion of low energy events away from the supergalactic plane similar to the su-pergalactic magnetic sheet simulation. Three deviations of the energy threshold parameter are 35 EeV, 45 EeV, and 60 EeV. The last may correspond to the 57 EeV threshold of the TA hotspot analysis [15].
(a)
(b)
7 Summary
Intermediate-scale energy-position correlations inside spherical cap sections are shown to be correlated with the supergalactic plane. This structure has a ∼4.5σ signifi-cance using 7 years of Telescope Array SD data. This is possible evidence of large scale magnetic diffusion of ultra-high energy cosmic rays from their sources corre-lated with the local large scale structure. Confirmation of this result may be done once sufficient data is collected by the Telescope Array expansion to TAx4 [17].
References
[1] G. de Vaucouleurs, Astrophys. J.202, 610 (1975) [2] A. Bonafede, L. Feretti, M. Murgia, F. Govoni,
G. Giovannini, D. Dallacasa, K. Dolag, G.B. Taylor, Astron. Astrophys.513, A30 (2010),1002.0594 [3] F. Nicastro, J. Kaastra, Y. Krongold, S. Borgani,
E. Branchini, R. Cen, M. Dadina, C.W. Danforth, M. Elvis, F. Fiore et al., Nature558, 406 (2018) [4] P.L. Biermann, H. Kang, D. Ryu, p. 9 p (1997),
astro-ph/9709250
[5] D. Ryu, H. Kang, P.L. Biermann, Astron. Astrophys. 335, 19 (1998),astro-ph/9803275
[6] Pierre Auger Collaboration, P. Abreu, M. Agli-etta, E.J. Ahn, I.F.M. Albuquerque, D. Allard, I. Allekotte, J. Allen, P. Allison, J. Alvarez Castillo et al., Astropart. Phys.35, 354 (2012),1111.2472
[7] A. Aab, P. Abreu, M. Aglietta, E.J. Ahn, I.A. Sama-rai, I.F.M. Albuquerque, I. Allekotte, J. Allen, P. Al-lison, A. Almela et al., EPJ C 75, 269 (2015), 1410.0515
[8] H.P. Bretz, Ph.D. thesis, Rheinisch-Westphalian Technical University of Aachen (2011)
[9] P.G. Tinyakov, I.I. Tkachev, Astropart. Phys.24, 32 (2005),astro-ph/0411669
[10] M.G. Kendall, Biometrika33, 239 (1945)
[11] N.A. Teanby, Computers and Geosciences32, 1442 (2006)
[12] R.U. Abbasi et al. (HiRes), Phys. Rev. Lett. 100, 101101 (2008),astro-ph/0703099
[13] D. Ivanov, Ph.D. thesis, Rutgers, the State University of New Jersey (2012), http: //telescopearray.com/images/papers/ theses/thesis_ivanov_rev2016.pdf
[14] T. Abu-Zayyad et al. (Telescope Array), Astrophys. J.768, L1 (2013),1205.5067
[15] R.U. Abbasi et al. (Telescope Array), Astrophys. J. 790, L21 (2014),1404.5890
[16] R.U. Abbasi et al., Astropart. Phys.68, 27 (2015), 1410.3151