Land Mesa relict area, Utah. J. SAMPSON, A. W. 1919. Plant succes- Range Manage. 20: 45-49. sion in relation to range manage- NICHOL, A. A. 1952. The natural vege- ment. U. S. D. A. Agr. Bull. 791.
tation of Arizona. Arizona Agr. 76 p.
Exp. Sta. Tech. Bull. 127. p. 187- SELLERS, W. D. (Editor). 1960. Ari-
230. zona climate. Univ. Arizona Inst.
QUINNILD, C. L., AND H. E. COSBY. 1958. Relicts of climax vegetation
Atm. Phys., Univ. Arizona Press, Tucson, 60 p.
on two mesas in western North SHANTZ, H. L., AND R. ZON. 1924. Dakota. Ecology 39: 29-32. Natural vegetation of the United
8 +I%
Discovering Grazing Values1
N. K. ROBERTS Highlight
Are market forces af work in de- termining range forage values? This sfudy fesfs the hypothesis fhaf mar- ket forces are af work in spite of the facts of administered grazing fees, rationing, and grazing confrol. The evidence in the research sup- porfs the hypothesis, and ii should assist ranchers and public land agen- cies in their deliberations on adjusf- ing public land grazing policies.
Discovering range forage val- ues is a crucial step in the proc- ess of establishing a “fair” public land grazing fee. Two obvious questions confront anyone inter- ested in discovering the value and establishing the “fair” fee. The first question is: What is “fair”? The second question is: How can the value be discov- ered?
Whaf is a ‘Tair” Fee Everyone “knows” what a “fair” grazing fee is according to his own individual value system. No man’s value judgments, how- ever, are universally accepted 8s “fair”. For this research fairness is considered the value of range forage as it has been established
1 This study was financed by the Bureau of Land Management - USDI, the U.S. Forest Service- USDA, and the Utah Agricultural Experiment Station. The views and opinions are solely those of the uuthor and this paper in no way represents the official position o j either Federal agency.
2 Head, Dep. of Agric. Econ., and Di- rector, Economics Research Inst., Utah State Univ., Logan.
by the ranching community over a long period of time. It is the value of range forage that fits with all other elements of ranch- ing to provide the observable economic organization of ranches. It is not the forage value that will guarantee ranchers the best alternative rate of return on investment. Legitimate ranchers often accept a lower rate of re- turn on ranch investment than they could get on their money if invested elsewhere. Their “love for ranching” or their “fear of not ranching” is worth something to them. If ranchers will stay in business for a 27( rate of return on investment and their alterna- tive outside of ranching is 67&, then they are willing to pay 4% for their “love of ranching”.
The ranching community can provide information about what range forage is worth to ranch- ers. Economically speaking, that value will be “fair” by rancher definition because it has been established through the interac- tion of many buyers and sellers within a “range market” area.
A general h y p o t h e s i s has guided the research reported here. It is that the economic principles of supply and demand operate to establish range forage prices just as they do for prod- ucts in other market places. Of course, variations exist and lags in price changes occur as a result of shifts in supply and demand
States. In Atlas of American Agri- culture, Part I, Sec. E., U.S. Gov. Printing Office, Washington, D.C. 29 p.
U. S. WEATHER BUREAU. 1942-64. Climatological data, Arizona. U.S. Dept. Commerce, Washington, D.C.
(monthly issue).
pressures. These characteristics are evident in any market place in the real world because knowl- edge is not perfect and expecta- tions of the future are varied and uncertain. The market will clear itself, however, unless there are arbitrary and capricious restric- tions imposed on either demand, supply, or both. If administrative restrictions become institutional- ized over time in the minds of suppliers and consumers, then a new market structure will be created that will clear the mar- ket. This has happened to range forage markets as will be dem- onstrated later.
If society decides that the value for range forage as determined by the market, or that the share of the value it captures is not “fair”, then it should consider the social costs of changing either the value or the share captured. Windfall gains and windfall losses are often sustained by dif- ferent groups of people when so- ciety manipulates established economic institutions.
Ranching in the West has an economic order that has operated under a relatively stable insti- tutional environment since the creation of national forests and since the Taylor Grazing Act was implemented over 30 years ago.
How io Discover Range Values
The Models
370
ers will attempt to gain control of the low-cost forage source. In the process of shifting demand, the price of the low-cost forage will increase and the price of the high-cost forage will decrease until the differential is erased. If the fee for one forage source is fixed by administrative edict, other use costs free to adjust in the market will do so even if it means creating a new asset such as a “permit value”. In the end, market-sensitive use costs will be revised until differentials are eliminated.
The disposition of grazing per- mits on public ranges among po- tential users is not completely free. Some rationing exists; base property is required in order to obtain permits to graze; uncer- tainty of tenure on public ranges is experienced by ranchers; and, fear of permit reductions is grow- ing among ranchers. These nega- tive forces may cause the value of public ranges set by ranchers to be less than the value for the more secure but productively comparable private ranges.
The above economic model has been developed in more sophisti- cated terms several times before.3 The present research was de- signed to test the model with analysis of data obtained from range markets in Utah. Three questions were asked at the out- set.
3See: B. Delworth Gardner, Trans- fer restrictions and misallocation’ in grazing public range, Journal of Farm Economics, February 1962. Gardner, A proposal to reduce mis- aZZocation of livestock grazing per- mits, Journal of Farm Economics, February 1963. Michael F. Brewer, Public pricing cj natural resources,
Journal of Farm Economics, Febru- ary 1962. N. K. Roberts, Economic foundations for grazing use fees on public lands, Journal of Farm Eco- nomics, November 1963. Marion Clawson, Determination of sales and lease values of public and pri- vate lands, Journal of Farm Eco- nomics, 1938.
What are total rancher costs for using comparable public and private ranges?
What is forage on compar- able public and private ranges worth to ranchers at the site?
What factors are needed to predict with confidence to- tal range use costs?
Each question attacks the problem of discovering range values differ- ently. Number 1 postulates that to- tal rancher use costs for comparable public and private ranges will be equal or nearly so. Any differences will be in favor of the private range as a result of the restrictions on the model noted earlier. If the postulate is correct, then the value to ranchers of a range of a certain quality can be established by looking at the situ- ation for either public or private ranges of the same quality in each range market area. The operational questions are reduced to formulas. For public ranges:
Yi = Fl +PiC + Ei . . . . . . (1) Where:
Yi = total annual use costs per AUM for a U.S. Forest Ser- vice range.
Fr = the annual Forest Service range grazing fee per AUM. Pi = the market value per AUM for Forest Service grazing permits.
C = the capitalization rate. Ei = the total annual non-fee
use costs per AUM (El.. . . i) for a Forest Service range. Ys = FZ + P& + Es . . . (2) Where:
Y2 = total annual use costs per AUM for a Bureau of Land Management (BLM) range. Fz, Ps, C, and EZ are defined as
in formula (1) except for the BLM rather than the Forest Service.
For private ranges:
Ys = Fs + Es . . . . (3) Where:
Y3 = total annual use costs per AUM for grazing private range.
Fs = annual grazing fee p e r AUM for private range. Es = total annual non-fee use
costs per AUM (El . . . . i)
for grazing leased private range.
If the economic proposition posed earlier is correct, Yi = Y2 = Y3 for ranges of comparable quality. The P’s, E’s, and F3 are free to fluctuate as market conditions change or as Fi and Fs (the administered fees) misprice public ranges.
Formulas 1, 2, and 3 partition total rancher use costs among resource owners. El, Es, and Es pay for rancher-owned non-fee services or for services hired by ranchers. Fi and F:! are captured by so tie ty through public land management agencies. F3 is paid to private land owners. The P’s are assets owned by ranchers and are part of the capital investment in ranching just 1 i k e land, buildings, and equipment. Whether or not owners capture the full value of the contribution of their resources to livestock production is another question.
Question Number 2 attempts to discover the value of range forage at the site. The formulations are:
V1 = Fr + PIC . . . . (4) Where:
Vr = the annual value per AUM to ranchers of the forage on a U.S. Forest Service range. Fi = the annual Forest Service
grazing fee per AUM. Pi = the market value per AUM
for Forest Service permits. C = the capitalization rate. V2 = F2 + P2C . . . (5)
Where:
Vs = the annual value per AUM to ranchers of the forage on a BLM range.
Fs, Ps, and C are defined as in formula (4) except for the BLM rather than the For- est Service.
V3 =F3. . . , . (6) Where:
Vs = the annual value to ranch- ers of the forage on a pri- vate range per AUM. Fs = the annual private range
and private range values. For com- parable ranges Vi and V2 will gen-
erally be smaller than V3,
(Vi<Vs>Vs), because El and ES are larger than Es, (Ei>Ez<Ez). Private ranges are generally closer to a lessee’s base of operations and in- clude more nonforage on-site ser- vices than public ranges; thus, trans- portation, herding, and death loss costs are lower for lessees of private ranges. Range owners (public and private) do charge for the nonforage on-site services provided, but they cannot upset the Yi = Ya = Ys prop- osition for long or lessees will in- crease their effort to control the lower cost ranges.
The answer to question 3 will help predict what the market price of any range is to ranchers if appropri- ate data are available. To be useful it must explain enough of the varia- tion in the Y’s of formulas 1, 2, and 3 to make prediction possible. The general formula is:
Y = f(Xl> . . . . (7) Where:
Y = the annual total rancher use cost per AUM for any range.
f = “function of”.
Xi = the factors (Xi . . . X,) in- fluencing Y.
The concern with formula 7 is not with cause and effect but with as- sociation and prediction. If predic- tion is possible, then a logical basis for variable fees based on range quality measures can be established. The Design
Cattle and sheep ranchers, public land agencies, and credit agencies in Utah were contacted for information to satisfy the needs of the formulas introduced above. About 635 public and private range situations were studied in detail. Information cover- ing all aspects determining range use levels and costs were obtained for each range situation studied. Ob- servations were obtained from every county in the State in order to repre- sent all the possible range market areas.
Record data on actual leasing sit- uations were obtained wherever pos- sible. In some cases, however, con- tacts reported what they thought lease fees were for various range classes in their area. A mean differ- ence test was made for actual and
estimated lease fees to see if there was a difference. The statistical test indicated that there was no signifi- cant difference at the 1% level of probability between estimated and actual lease fees in the State. Thus, ranchers, public land managers, and credit agencies in Utah know what the range lease market is in their areas.
Control over important variables was introduced by stratifying the ranges on the basis of three variables possessing definite class indicators. The first was to determine if the range was grazed by sheep or cattle. Because of the vegetation some ranges are classed as cattle ranges and some as sheep ranges. Even if the vegetation does not determine the class of livestock grazing the land, sheep and cattle ranges have become institutionalized to the point that a sheep range does not easily enter the cattle range market and the opposite is also true. A mean dif- ference test indicated that a sig- nificant difference did exist between total sheep and cattle range use costs per AUM.
The second stratifying variable was season of use. Natural phenom- ena determine to a large extent the season a range will be grazed. The clearest distinction is between sum- mer and winter ranges. Spring and fall grazing is usually transitional. Actual season of use, like class of livestock, has become institutional- ized. Even where season of use is ecologically improper, a s u m m e r range does not easily enter the win- ter range market.
Third, data were gathered for pub- lic and private ranges which, of course, constitutes the comparison of primary interest in the research.
The Analysis
Comparisons are made between public and private ranges where- ever data were available. First, total range use costs (Y’s) are analyzed; second, forage site val- ues (V’s) are presented; and third, methods of predicting range val- ues are developed.
Total Rancher Use Costs (Y’s) In this section total range use costs are presented and analyzed for the state of Utah. Also, the
differences among the means for comparable ranges but differing ownership situations were sta- tistically tested to determine if they are real.
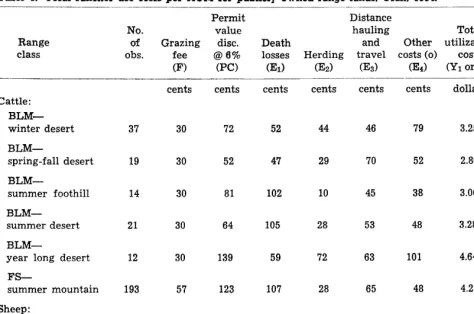
Obviously, not all possible “quality” combinations of public and private ranges in Utah are important enough to include in the analysis. Most of the high summer ranges are controlled by the U.S. Forest Service. Much of the winter, desert ranges are con- trolled by the BLM. Not much privately owned winter range is leased. Only those combinations where private range and one or the other public range situations could be compared are included. Public land use costs per AUM (YI or Y2) were composed of the following (Table 1):
F = the grazing fee.
PC = the permit value dis- counted at 6 percent. El = death losses.
E2 = herding.
Es = hauling and traveling. E4 = other costs such as wa-
tering, fencing, and graz- ing association fees. Two major types of leasing are recognized for privately owned range. The first system requires the landlord to assume the costs of supporting the lessee’s live- stock. In the second system the lessee takes over the range and assumes the costs of maintaining the range and the livestock. The components of total rancher uti- lization c o s t s are different in each case. Since the first leasing system was by far the most often used in Utah in 1964 and since no significant difference at the 1% level was found between to- tal use costs for the two over the state, only the first is in- cluded here (Table 2). The com- ponent costs per AUM were:
F = the grazing fee. El = death losses.
E2 = travel and livestock trans- portation.
ROBERTS
Table 1. Total rancher use costs per AUM for publicly owned range lands, Uiah, 1964.
Permit Distance
value hauling Total Permit
disc. Death and Other utilization values @6% losses Herding travel costs (0) costs per AUM
(PC> (El) (E2) (x3) (E4) 05 or Y2) (PI Range
class
No. of
obs. Grazing fee (F)
cents cents cents cents cents cents dollars dollars Cattle:
BLM-
winter desert 37
19
14
21
12
193
30 72 52 44 46 79 3.25 12.08
47
102
105
59
107
29 70 52 2.80 8.52
10 45 38 3.06 13.51
28 53 48 3.28 10.61
72 63 101 4.64 23.32
28 65 48 4.28 20.15
BLM-
spring-fall desert BLM-
summer foothill
30 52
30 81
BLM-
summer desert 30 64
30 BLM-
year long desert FS-
summer mountain
139
57 123
Sheep: BLM- winter desert FS-
summer mountain
4.30 11.75
6.55 26.15
42 30 70 60 145 55
48 55 155 145 185 60
70
55 (0) Includes watering, fencing, and grazing association fees.
U.S. Forest Service ranges. In the case of the Forest Ser- vice range used by cattle in the summer, the difference between public and private use costs is not great. but it is significant at the 5% level and it might be real. Possibly the difference is the re- sult of the uncertainty of forest grazing permit control that has built up over a number of years in some parts of Utah. The pres- sure of extensive recreation is certainly greater on the moun- tain areas than on the relatively larger areas of desert controlled by the BLM. Also, permit cuts that have taken place on forests generally have been cuts in ac- tual use, where as ranchers have tended to use BLM ranges below their permitted number for years and recent adjustments have mainly eliminated the historical non-use. Thus, the fear of per- mit cuts probably depresses the Table 2. Total rancher use costs per AUM when leasing privately owned
range, Utah, 1964.
Travel to and Death from losses site (e> (El) ($1 (E2) Range
class
Number
of Grazing obs. fee
($>(F)
Total util. Herding costs
($1 (E3) ($1 Ws) Cattle:
Winter desert 8 Spring-fall desert 13 Summer mountain 68 Summer desert 7 Sheep:
Summer mountain 25
2.07 2.30 3.51 3.12 3.40
42 47 41 3.37
34 40 36 3.40
52 54 22 4.79
37 32 22 4.03
70 60 155 6.25
GRAZING VALUES
market for Forest Service per- mits in the study area.
Value of Range Forage at the Site (V’s)
Since it has been established that statistically speaking Y1 = Y3 = Y2 in the Utah range mar- ket, then the annual value of the forage (V) can be estimated by subtracting out of Y the non- forage costs. For Forest Service ranges (YI) and BLM ranges (Y2) this annual value per AUM (Vl and V2) is composed of the fee (F) plus the discounted permit value (PC). In other words, F + PC is what ranchers are willing to pay for public range forage consistent with the cost of com- peting sources and other utiliza- tion costs. For private ranges, the fee (F) reflects what ranchers are willing to pay for forage con- sistent with o t h e r comparable sources and non-forage utiliza- tion costs (V3). Of course, the fees cover the forage plus forage- related on-site services provided by the landlords of both public and private ranges. The lessee of a private range does not own an asset comparable to the permit value associated with use of pub- lic range. Because non-forage use costs differ between public and private ranges, Vl <v3 >v2 (Table 4).
The fact that El >E3 <Ez veri- fies the hypothesis that public range forage under present man- agement is worth less to ranchers than comparable private range forage. Because of this situation, public grazing fees high enough to reduce permit values to zero should still be less than private grazing fees for comparable ranges.
Who, after all these years of federal range administration, should capture the value of the public grazing resources (VI or V2) is not the same question as, what is the value of public range forage. The second question has been answered; the first question has not. To answer it policy makers must decide whether or
Table 3. Private vs. public range comparisons of total use costs ($/AUM), Ufah, 1964.
Range class
Number of
observations Average use costs
Satistically significant differences at the 5%
level of Public Private BLM FS Private probability Cattle:
Winter desert 37 8 3.25 3.37 no
Spring-fall desert 19 13 2.80 3.40 no
Summer mountain 193 68 4.28 4.79 yes
Summer desert 21 7 3.28 4.03 no
Sheep:
Summer mountain 48 25 6.55 6.25 no
Table 4. Annual value fo ranchers of range forage and related services ($/AUM) for comparable public and private sources, Utah, 1664.
Range class
Number Differences
of Average annual significant
observations values (V’s) at the 5% level of Private Public’ FSO BLMO Private00 _ probability Cattle:
Winter desert 8 37 1.02 2.07 yes
Spring-fall desert 13 19 .82 2.30 yes
Summer mountain 68 193 1.80 3.51 yes
Summer desert 7 21 .94 3.12 yes
Sheep:
Summer mountain 25 48 2.10 3.40 yes
OVi or VZ = F + PC and C = 6%.
00 V3 =F. Remember that the Y’s, total use costs, are not significantly different (Table 3).
not the consequences of captur- ing the full value of the range (F + PC) are worth it.
The consequence on the one hand is that society would cap- ture the full value of its resource. The consequences on the other hand are first, that rancher fixed costs would be reduced and an- nual cash operating costs would increase; thus, increasing the eco- nomic risk in ranching. Second, the loss of the permit asset would result in a transfer of income from ranchers to society, aggra- vating poverty problems already found in ranching communities.
Predicting Use Costs (Y=f(Xl) )
A number of variables con-
tribute to the variation in ranch- er total range use costs (Y). The purpose of this analysis is to identify the minimum number of variables required to predict Y with confidence. Since the previous analyses have indicated that economic laws are opera- tive in pricing range land with similar characteristics regardless of ownership, then the Y pre- dicted for one ownership class should also predict the Y’s for all other ownership classes. Land administrators could then look at the range source where data are most conveniently located.
common enough to warrant study. Thqse important in Utah
Table 5. Mulfiple regression summary for fofal user costs on public range lands, Ufqh, 1964.
are:
1. Cattle grazing U.S. Forest Service mountain range in the summer.
Sheep grazing U.S. Forest Service mountain range in the summer.
Cattle grazing BLM desert range in the winter.
Cattle grazing BLM desert range in the summer. Sheep grazing BLM desert range in the winter.
Some factors that influence an- nual use costs are evident in all range classes. These are the ones that ca.n help predict Y. The variables (X’s) considered f o r public ranges were:
1.
2. 3.
4. 5.
6.
7.
8.
9.
10.
Carrying capacity in acres per AUM.
Length of grazing period. Percent of the range im- proved or reseeded.
Death losses per AUM. Distance traveled to utilize the range per AUM. Range improvement p e r AUM.
Herding per AUM during the season.
Miscellaneous c o s t s per AUNI: including w ate r, fence, and association fees. Gra&g fees chr;lrged per AUM.
Discounted permit values per AUM.
Not 311 10 of the variables were significantly (added more than 8% to the explaining ability of the multiple coefficient of de- termination, R2) associated with variations in the Y’s for public ranges. Only 4, 5, 6, 8, and 10 proved to be important in this linear a_Dalysis, and not all of them i-n each case (Table 5). Death losses (X4) were impor- tant in all public land cases. Mis- cella.neous costs (XR) were impor- tant in all but the cattle-sum- mer class.
Privately-owned ranges were leased two ways. The first placed much of t-he re_spoqsibility for
Regression coefficients (b’s) 00 ~____~~ -~-~
Coef. of deter-
Range Death Dist. Impr. Misc. Permit mina-
class Obs. loss costs costs costs0 values, tionoo
x4 x5 X6 x8 x10 R=
- __ ~__ __~__ ~~____~~~ - __~_~__ ._~
Cattle:
Mountain summer 192 .87 1.15 -2.03 .94 1.04 .71 .8925 Desert winter 37 1.00 .98 ______ .90 __._._ .20 .9075 Desert summer 21 1.07 _.__.- ___.-- 1.12 .91 .67 .9572 Sheep:
Mountain summer 48 1.06 _____. ______ 1.08 .99 .20 .9075 Desert winter 42 1.04 .91 _.__._ .98 ______ .24 .9206
-___ ~~ ~ __
0 Includks drinking water, fence maintenance, association fees, salt, supple- mental feed, and incidental expenses.
00 AH significant at the 1% level of probability.
TahZe 6. BJuJ#ip!e regression gummary far toial user c~sfs gn leased private range lands, Utah. 1964.
Regression coefficient (b’s)”
Range class
Lease Type 1: Cattle summer
valley Cattle summer
mt.
Nu_m-
ber Death Graz- FIerd-
of loss Distance ing ing Coef. obs. cQsts costs fee costs a of det.”
Xl x2 x3 x4 _____-- R2
58 1.17 .15 .77 .88 .8248
55 1.35 1.03 .02 .9375
Lease Type 2: Sheep spring
fall mt. Sheep summer
mt.
D All significant at the 1 percent level of probability.
the lessee’s livestock on the land- lord. The second placed much of the responsibility for the range upon the lessee. Total use costs were not significantly different at the 1 percent level for the two types of lease arrangements for comparable ranges.
Lease type 1 was found most often during the survey. T w o range classes had enough obser- vation for study:
1. Cattle grazing summer val- ley ranges.
2. Cattle grazing summer mountain ranges.
In the c_ase of lease type 2, two
range classes had enough obser- vations to warrant study.
4. Sheep grazing spring or fall mountain ranges. 5. Sheep grazing summer
mountain ranges.
Ten variables (X’s) were iden- tified 8s influencing lessee use costs (Us) f 0 r 1 e as e type 1, whereas, 17 were suggested for lease type 2. Not all the X’s proved to be necessary to pre- dict Y3. Only three were needed to provide a strong predictive formula for either lease type (Table 6).
375
and effect relationship intended from the analysis. It is enough for this study that three to five “bits” of information m a k e i t possible to predict total rancher utilization costs for grazing land with s i m i 1 a r livestock-season characteristics.
Conclusions
This research has verified sev- eral hypotheses concerning range markets in Utah:
1. Range markets do exist. 2. Ranchers and others know
prices in their range market areas.
3. Total use costs for compar-
4.
5.
6.
able ranges are statistically equal for public and private sources or f a v 0 r private sources w h e n uncertainty increases.
The value of forage and re- lated on-site services to ranchers at the site is lower for public than for privately owned ranges of compar- able productivity because non&i%ge use c 0 s t s are h@h@r on public ranges. The fee plus the discounted
7.
use costs for both public and private ranges with a relatively few pieces of data that are available.
Increasing fees will affect ranches two ways. First, it will increase cash costs, de- crease net ranch income, and increase risk in ranch- ing. Second, increasing fees to the point where society captures the full value of the forage will effect an in- come transfer from ranch- value of the permit is a
good estimate of the value of public forage at the site.
ing to society by eliminat- ing the rancher-owned in- vestment in his permit as- It is possible to predict total sets.
Profitability and Flexibility
-
_
Two Range Cattle Systems in the
Rolling Plains of Texas
CALVIN C. BOYKINFarm Production Economics Division, Eco- nomic Research Service, U.S.D.A., sta- tioned at Texas A&M University, College Station.
of
Highlight
Adjusfing caffle invenfories fo changes in range for- age supply is a major problem in ranching. A cosfs and income analysis of a cow-calf system and of a cow- yearling sysfem over a IO-year period of changing prices and range forage supplies revealed liitie difference in relafive -profkbilify- between fhe fwo systems when addifional replacemenfs were purchased in response fo increases in range forage supply. When additional re- placemenfs were raised, fhe cow-yearling system proved to be more profitabJe and more flexible ihan fhe cow- calf sysiem. In shifkngto a cowyearling sysfem. breed- ing cow numbers must bh reduced in proportion fo fhe increase in yearlings if overgrazing is fo be avoided.
Livestock ranching occurs in an environment of low and highly variable rainfall, heterogenous soils, topography and vegetation, and low per- acre production of forage.- The two main sources of uncertainty that affect the likelihood of earn- ing profits in ranching are weather variations, and the subsequent effects on range forage produc- tion, and fluctuations of livestock prices.
Considering that information about future range forage supply and livestock prices is uncer- tain, ranchmen often prefer situations which per- mit them to readjust to improved information that comes with the passage of time. Such situations are flexible, and the ability to readjust is referred to as flexibility (Bradford and Johnson, 1953).
The length of the livestock production period and the difficulty of buying or raising replacements on short notice result in a high degree of inflexibility that frequently hinders ranchmen in attempting to adjust their operations quickly in response to changing range forage supply. Holding livestock too long waiting for rains to increase range forage supply may result in overgrazing that eventually would lower future forage production. Increasing livestock inventories to utilize increases in range forage supply is difficult, for replacements and stocker animals of the desired quality and quan- tity are sometimes unavailable to buy, and they require considerable time to raise.
The purpose of this paper is to compare the ‘&ofitability and flexibility over the lo-year period
l%:‘th ou $$
h the same r
1964 of two range cattle systems on l;pc$+ located in the Rolling Plains Land Resource Area of Texas. one is a cow-calf system; the other is a cow-yearling sys&n. Eati system is given 2 options; number 1 is to byy replace:, ments as range forage supply increases; number 2 is to grow t-he additional replacements needed t$ utilize increased forage supplies. Both systems. in- clude the selling of additional cattle as range for- age supply declines.
Procedures
The ranch used in this analysis was synthe- sized from data obtained during a 1964 ranch economic survey in the Rolling Plains; the as- sumptions and procedures followed in construct-
ing the ranch budgets follow closely those of Co-