Volume 8, No. 3, March – April 2017
International Journal of Advanced Research in Computer Science RESEARCH PAPER
Available Online at www.ijarcs.info
Parameterized Reliable Trust Model in Grid Computing using Regression
G Mahesh Kumar Assistant Professor, Department of Computer Science,
Bhavan’s Vivekananda College, Sainikpuri, Secunderabad, Telangana, India
Dr. S Ramachandram Professor,
Department of Computer Science & Engineering, University College of Engineering, Osmania University, Hyderabad, Telangana, India Dr. Jayadev Gyani
Professor,
Department of Computer Science & Engineering, Jayamukhi Institute of Technological Sciences,
Narsampet, Warangal, Telangana, India
Abstract: Grid computing technology is a technique to share various resources like memory, storage, processor that are idle, to solve very huge and complex problems. These resources are shared among various heterogeneous computers, which form a virtual organization. The computers involved in communication for sharing resources might be from the same domain or from different domains. The risk is more in communication among computers from different domains since they are unknown to each other and there are more chances to misuse the resources. To avoid the above mentioned problems, various trust models are prepared to assess the computers for their trustworthiness in communication. This paper proposes a trust model, which uses a regression model to predict the behavior of client and service provider for further communication in a more secure manner. This regression model is developed based on the data collected through a survey; also, a reliability test was conducted to check the consistency of collected data, which was found to be good. This paper alsoshows the usage of randomized algorithm for trust model in grid computing proposed by us, based on the various parameter values collected through the survey.
Keywords: Grid Computing, Trust, Resource, Regression, Reliability.
I. INTRODUCTION
Grid computing environment is an open distributed system in which various heterogeneous participants make communication for sharing resources. Applications like healthcare, defence, robotics, research and development, need very huge computation power. A single computer will have limited resources, which cannot solve very complex problems. Grid computing collects various resources required to solve complex problems from computers, which are available throughout the globe. The resources are extracted from systems, which are idle without any processing and shared with the systems that are in requirement.
Every computer in a grid may be from same or different domains. The computers from various domains might create problems in using resources. The computers involved in interaction need to be a trusted entity. The confidence has to be built by all the computers involved in interaction, so that the utilization of resources will be appropriate and accurate. The computers involved in a grid needs to follow the policies, service level agreements while sharing resources for communication. All entities need to do fair transactions in-order to carry out further transactions with other entities for a very long time. Every computer need to be an authenticated entity for sharing resources to solve very complex problems.
This paper proposes a trust model that allows us to predict the behavior of client and service provider using regression model to establish trust among the computers participating in
communication. This paper also shows the implementation of randomized algorithm for trust model in grid computing.
II. TRUST
In grid computing, the resources need to be shared among various heterogeneous entities. The entities in the grid are dynamic in nature i.e., an entity can join or leave the grid at any point of time. It is very expensive to maintain the entities in the grid. The initiator and the service provider are the two entities involved in communication, where the initiator requests the services and the service provider provides the services. The entities involved in the communication may be from different domains and there are more chances to misuse the allocated resources.
The trust is the main factor to be built among the initiator and service provider to use the resources in the best manner. Before the start of the transaction, the initiator and service provider will bind with the service level agreements and each one need to strictly follow these agreements. The trust can be direct or indirect. The direct trust is established between the initiator and service provider when they are well-known to each other and no third party entity is required. The indirect trust is established between the initiator and service provider based on recommendations by the third party entity. The reputation is built based on the past transactions when the entities have done their transactions in fair manner.
III. RELATEDWORK
model both direct trust and indirect trust is considered. Direct trust is calculated from transactions done between client and service provider. Indirect trust is calculated by receiving feedbacks from neighbours of client and service provider. This model calculates the credibility of the feedback based on the parameters like activity, similarity, idleness, specificity. This model measures the trust from both the sides i.e., user and resource provider. If both the trust values are greater than the threshold value, only then the transaction is permitted otherwise it is not.
Safieh Siadat et al. [2] proposed platform for improving grid security by trust management system. In this paper a new trust management system is proposed based on two levels i.e., to add new domain in grid system and to select one service provider which can adapt itself closely with user request. In the new model there are components namely security management component responsible for measuring security level of different domains in grid system; demand trust evaluation component selects one service provider which adapts very easily to the user requests. The other components existing in this model like trust negotiation is used to add new domain into grid systems, to register the properties of new domain Registration component is used. Propagation component is used to pass the information of new domain properties to all other domains in grid system. Trust evaluation component is used to evaluate the trust value from the feedback. Feedback evaluation component is used to evaluate and update the received feedback from providers.
M Ashok et al. [3] proposed a linear regression analysis of trust computation in grid resource broker. In this paper, linear regression is used to forecast the status of trust if the numbers of resources are increased. Most of the trust models use the parameters like system availability, latency, network bandwidth, failure rate of the resources to calculate the trust of a resource. This paper uses one more parameter called hack rate to find the frequency of hacking the resources since every resource is accessed through the internet. In this model, hack rate and failure rate values are removed from the other parameters after calculating each and every parameter individually to identify the actual trust value of a resource.
Hongmei Liao et al. [4] proposed a fuzzy logic-based trust model in Grid. This paper focus on the behavior trust that changes with respect to time. Due to this fuzziness nature of trust, the fuzzy logic is used for the computation of trust. In this model, direct trust can be extracted by using variable weighted fuzzy comprehensive evaluation and reputation can be extracted from derivation and combination of trust. To simplify fuzzy rules, the expert’s experience is used and the malicious recommendations are also removed.
Olusanya O.O et al. [5] proposed a reputation based fuzzy logic framework for virtual enrolment in grid computing environments. In this paper, fuzzy logic approach is used to find the trust ratings of the members in a virtual organization by handling the incomplete information. This approach identifies the trustworthiness of the organizations applied for membership in the virtual organization. A Mamdani fuzzy logic system is built to select the organization with good ratings and helps in determining whether the organization
should be granted membership or not in the virtual organization.
Shaik Naseera et al. [6] proposed a trust based load distribution in a data grid environment. This paper focuses on selecting the trusted resources instead of distributing the workload to all the nodes present in the grid for load balancing process. The grid is dynamic in nature; the resources may join and leave the grid very frequently. It is very expensive to re-allocate the resources to the entities in the grid and also time is wasted.
Srivaramangai P, Rengaramanujam Srinivasan [7] proposed enhancements to reputation based trust models for improved reliability in grid computing. This paper focuses on two new reputation trust models. The model 1 highlights a compatibility factor based on Spearman’s rank correlation along with other parameters i.e., popularity, similarity and activity. The model 2 focuses on other factors called context and size, which is an improvement over model 1. The model 2 considers three types of trust i.e., direct trust 1, direct trust 2 and indirect trust. The model 2 shows that the reputation values are different for different kinds of transactions. This model also shows that reputation values will decrease when the user and service provider do not do any transaction.
IV. PROPOSEDMODEL
The proposed model has undergone a reliability test of the data collected through the survey conducted, to check the consistency among the parameters taken for client and service provider. The result of this test was good enough to use this data for statistical analysis. This model applies the regression model to predict the behavior of client and service provider for further communication. This paper also uses randomized algorithm to check trust establishment between the client and service provider based on the feedback values on the parameters collected through the survey conducted.
Reliability Test:
Cronbach Alpha is used as an estimate of the reliability of a psychometric test. Cronbach is a function of the number of items in a test. Reliability refers to the context to which responses are consistent. It will help to measure the internal consistency of data to study for further analysis. If the value is > 0.7, then, such data can be acceptable for further study. In the present study, Croanbach is computed for data of clients’ and service providers’ responses using SPSS.
Reliability Statistics Cronbach's
Alpha
Cronbach's Alpha Based on Standardized Items
.981 .982
Source: From primary data - survey (Using SPSS)
1. It indicates the significant relationships between dependent variable and independent variable.
Regression Model:
In statistical modelling, regression analysis is a statistical process for estimating the relationships among variables. It includes many techniques for modeling and analyzing several variables, when the focus is on the relationship between a dependent variable and one or more independent variables (or 'predictors').
Regression analysis is a form of predictive modeling technique, which investigates the relationship between a dependent (target) and independent variables (predictor).
Regression analysis is an important tool for modeling and analyzing data. Here, we fit a curve / line to the data points, in such a manner that the differences between the distances of data points from the curve or line is minimized.
There are multiple benefits of using regression analysis. They are as follows:
2. It indicates the strength of impact of
multiple independent variables on a dependent variable.
R-squared is a statistical measure of how close the data are to the fitted regression line. It is also known as the coefficient of determination, or the coefficient of multiple determination for multiple regression.
The definition of R-squared is straightforward; it is the percentage of the response variable variation that is explained by a linear model. In some fields, it is entirely expected that your R-squared values will be low. For example, any field that attempts to predict human behavior, such as psychology, typically has R-squared values lower than 50%.
The coefficient of determination, denoted as R2 or r2 and pronounced "R squared", is a number that indicates the proportion of the variance in the dependent variable that is predictable from the independent variable.
The below mentioned Chart 1 gives the regression model where, the X-axis denotes the 34 parameters for which the clients had to rate. The Y-axis denotes the scores given by the clients depending on the performance of the provider on those parameters. The regression line is, y = -0.0057x + 3.6503. ⇒ If none of the parameters existed, then, the average score for the provider would be 3.6503.
R2 = 0.0323 ⇒ 3.23% of the variation is explained by the response variables. Our data attempts to predict human psychology behavior; hence, probably R-squared value is low.
[image:3.595.306.555.55.238.2]Source: From primary data - survey
Figure 1: Clients rating Service Providers for individual parameters (on an average)
The parameters mentioned in chart 1 are as follows respectively:
20-a)Accuracy, 20-b)Functionality, 20-c)Interoperability, 20-d)Service Response Time, 21-a)Accessibility, 21-b)Installability, 21-c)Transparency, 22-a)Adaptability, 22-b)Elasticity, 22-c)Extensibility, 22-d)Flexibility, 22-e)Portability, 22-f)Scalability, 23-a)Availability, 23-b)Maintainability, 22-c)Recoverability, 22-d)Reliability, 23-e)Resiliency/Fault Tolerance, 23-f)Service Stability, 24-a)Serviceability, 24-b)Access Control & Privilege Management, 24-c)Data Integrity, 24-d)Data Privacy, 24-e)Physical and Environmental Security, 24-f)Threat & Vulnerability Management, 24-g)Retention/Disposition, 24-h)Exit Arrangements, 25-a)Security Management, 25-b)Auditability, 25-c)Compliance, 25-d)Governance, 25-e) Ownership, 25-f)Sustainability, 25-g)SLA Verification.
Source: From primary data – survey
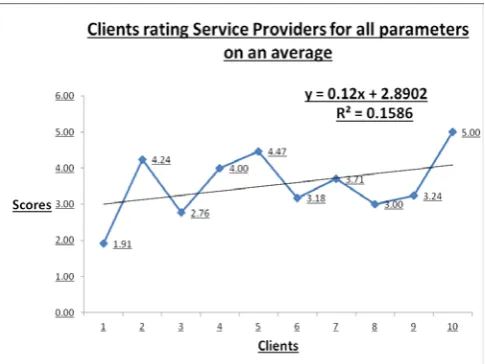
Figure 2: Clients rating Service Providers for all parameters (on an average)
The above Chart 2 gives the regression model where, the X-axis denotes the 10 clients who have rated all the 34 parameters as an average value. The Y-axis denotes the average scores given by the clients depending on the
[image:3.595.308.551.489.671.2]⇒ If none of the clients rated, then, the average score for the performance would be 2.8902.
R2 = 0.1586 ⇒ 15.86% of the variation is explained by the response variables.
[image:4.595.303.560.71.261.2]Source: From primary data - survey
Figure 3: Service Providers rating the Clients for individual parameters (on an average)
The above Chart 3, gives the regression model where, the X-axis denotes the 27 parameters for which the service providers had to rate the clients. The Y-axis denotes the scores given by the service providers depending on the performance of the client on those parameters. The regression line is, y = -0.0523x + 2.3353
⇒ If none of the parameters existed, then, the average score for the provider would be 2.3353.
R2 = 0.3948 ⇒ 39.48% of the variation is explained by the response variables.
The 27 parameters mentioned in Chart 3 belong to the following broad categories.
Regularity with respective to payments,
Customer knowledge in utilization of grid services, Customer interaction with provider,
Feedback Frequency, Security and Privacy.
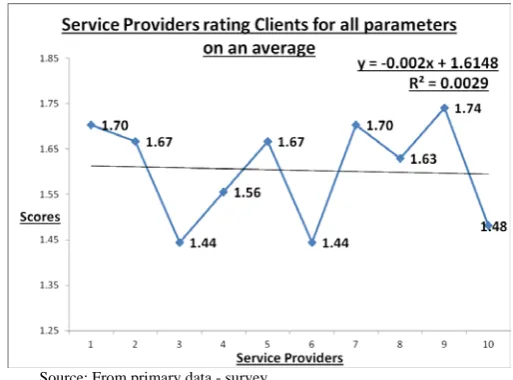
The below mentioned Chart 4, gives the regression model where, the X-axis denotes 10 service providers who have rated all the 27 parameters as an average value. The Y-axis denotes the average scores given by the service providers depending on the performance of the client. The regression line is, y = -0.002x + 1.6148
⇒ If none of the clients rated, then, the average score for the performance would be 1.6148.
R2 = 0.0029 ⇒ 0.29% of the variation is explained by the response variables. Our data attempts to predict human psychology behavior; hence, probably R-squared value is low.
Source: From primary data - survey
Figure 4: Service Providers rating the Clients for all parameters (on an average)
Compatibility and Similarity :
Spearman’s Rank correlation coefficient is used to identify and test the strength of a relationship between two sets of data.
Source: From primary survey data
sim(x,y) = 1-
Compatibility = 1 -
sim(x,y) = 0.56863055
Compatibility = 0.012121
By Similarity or Compatibility, we mean ‘likeness’/ ‘correspondence’/ ‘parallel’ of the ratings given by the clients and the service providers.
Here, both the expressions of similarity and compatibility work well as both are positive, with compatibility factor being a better indication.
[image:4.595.36.286.123.306.2]threshold value i.e., 2.5 otherwise they need to apply after 45 days.
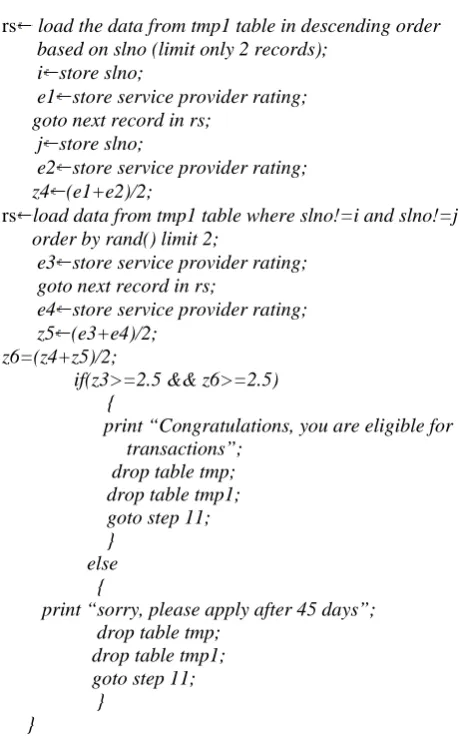
The psuedocode for the randomized algorithm is mentioned below which satisfies all 4 criteria’s mentioned in our earlier paper and algorithm is named as TEGC.
Algorithm Randomization-TEGC(clientid, serviceproviderid) // tmp transfer data from client feedback table based on input parameters
// tmp1 transfer data from service provider feedback table based on input parameters
// resultset(rs,rs1) is a temporary memory which stores the selected data from database
1: cid clientid ;
2: spid serviceproviderid; 3: connect to database;
4: rs load data from tmp table in descending order based on slno;
5: rs1 load data from service provider feedback table based on input parameters;
6: if(rs.count()==0) {
print “ No Data Exist”; drop table tmp; goto step 11; }
7: if(rs.count()==1) {
x store client rating;
y store service provider rating from rs1; if(x>=2.5 && y>=2.5)
{
print “Congratulations, you are eligible for transactions”; drop table tmp;
goto step 11; }
else {
print “ sorry, please apply after 45 days”;
drop table tmp; goto step 11;
} }
8: if(rs.count()==2) {
x1 store client rating; goto next record in rs; y1 store client rating;
z1 (x1+y1)/2;
rs load data from tmp1 table in descending order based on slno (limit only 2 records);
x2 store service provider rating; goto next record in rs;
y2 store service provider rating; z2 (x2+y2)/2;
if(z1>=2.5 && z2>=2.5) {
print “Congratulations, you are eligible for
transactions”; drop table tmp; drop table tmp1; goto step 11; }
else {
print “sorry, please apply after 45 days”; drop table tmp;
drop table tmp1; goto step 11; }
}
9: if(rs.count()==3) {
d store slno;
x1 store client rating; goto next record in rs; d1 store slno; y1 store client rating; z1 (x1+y1)/2;
rs load data from tmp table where slno!=d and slno!=d1;
e1 store client rating; z2 (z1+e1)/2;
rs load the data from tmp1 table in descending order based
on slno (limit only 2 records); i store slno;
x2 store service provider rating; goto next record in rs;
j store slno;
y2 store service provider rating; z3 (x2+y2)/2;
rs load data from tmp1 table where slno!=i and slno!=j;
e2 store service provider rating; z4 (z3+e2)/2;
if(z2>=2.5 && z4>=2.5) {
print “Congratulations, you are eligible for transactions”;
drop table tmp; drop table tmp1; goto step 11; }
else {
print “sorry, please apply after 45 days”; drop table tmp;
drop table tmp1; goto step 11; }
}
10: otherwise: {
d store slno;
x1 store client rating; goto next record in rs; d1 store slno; y1 store client rating; z1 (x1+y1)/2;
rs load data from tmp table where slno!=d and slno!=d1
x2 store client rating; goto next record in rs; y2 store client rating; z2 (x2+y2)/2;
z3=(z1+z2)/2;
rs load the data from tmp1 table in descending order based on slno (limit only 2 records);
i store slno;
e1 store service provider rating; goto next record in rs;
j store slno;
e2 store service provider rating; z4 (e1+e2)/2;
rs load data from tmp1 table where slno!=i and slno!=j
order by rand() limit 2;
e3 store service provider rating; goto next record in rs;
e4 store service provider rating; z5 (e3+e4)/2;
z6=(z4+z5)/2;
if(z3>=2.5 && z6>=2.5) {
print “Congratulations, you are eligible for transactions”;
drop table tmp; drop table tmp1; goto step 11; }
else {
print “sorry, please apply after 45 days”; drop table tmp;
drop table tmp1; goto step 11; }
}
11: stop;
[image:6.595.35.265.118.495.2]The Reputation Server contains Clients feedback table and Service Providers feedback table:
Table 1: Clients Feedback Table Client
Name SP1 SP2 SP3 SP4
C1 1.91 X X X
C2 X X 4.24 X
C3 X 2.76 X X
C1 4.00 X X X
C3 X 4.47 X X
C1 3.18 X X X
C2 X X 3.71 X
C1 3.00 X X X
C2 X X 3.24 X
C4 X X X 5.00
[image:6.595.306.528.138.320.2]Source: From primary data - survey
Table 2: Service Provider’s Feedback Table Service
Provider Name
C1 C2 C3 C4
SP1 1.70 X X X
SP3 X 1.67 X X
SP2 X X 1.44 X
SP1 1.56 X X X
SP2 X X 1.67 X
SP1 1.44 X X X
SP3 X 1.70 X X
SP1 1.63 X X X
SP3 X 1.74 X X
SP4 X X X 4.30
Source: From primary data - survey
[C1, C2, C3, C4] – Clients
[SP1, SP2, SP3, SP4] –Service Providers X – No Transaction
FB – FeedBack
The above Table 1 and Table 2 values are the average values taken based on the parameters of clients and service providers mentioned with respective to Chart 1 and Chart 3.
Example for one transaction in feedback tables:
Client = C4, Service Provider = SP4 from Table 1 and Table 2 respectively:
In this example, client C4 and service provider SP4 has only one record in the tables i.e., they both have done only one transaction. Therefore, the existing feedback values are taken as they are from the table and compared with threshold value of 2.5.
From Table 1, the value of C4=5.00 against SP4 and from Table 2, the value of SP4=4.30 against C4. Since both client and service provider feedback value is more than 2.5, they are allowed for further communication.
Example for two transactions in feedback tables:
Client = C3, Service Provider = SP2 from Table 1 and Table 2 respectively:
In this example, client C3 and service provider SP2 have only two records in the tables i.e., they both have done only two transactions.
Calculation procedure for Service Provider’s Feedback:
[image:6.595.36.251.581.743.2]SP2-FB=--- 2
(1.67+1.44) 3.11 = --- = --- = 1.555 2 2
Calculation procedure for Clients Feedback:
Sum of two feedback values given by client with respective service provider
C3-FB=--- 2
(4.47+2.76) 7.23 = --- = --- = 3.615 2 2
Based on the above results, the service provider’s and client’s feedback respectively i.e., SP3-FB=1.555 and C3-FB=3.615, are both not greater than 2.5. Hence, the resource broker rejects the communication.
Example for three transactions in feedback tables:
[image:7.595.305.534.403.748.2]Client = C2, Service Provider = SP3 from Table 1 and Table 2 respectively:
In this example, client C2 and service provider SP3 has three records in the tables i.e., they both have done three transactions.
Calculation procedure for Service Provider’s Feedback:
Sum of two recent feedback values given by service provider to respective client SP3-FB=---
2
(1.74+1.70) 3.44 = --- = --- = 1.72 2 2
The third record of SP3-FB value is taken as it is, apart from two recent transactions given by service provider with respect to client = 1.67. The final rating of SP3 is got by taking the average of the above average (1.72) and the third record of SP3(1.67).
(1.72+1.67) 3.39 Final SP3-FB =--- = --- = 1.695
2 2
Calculation procedure for Clients Feedback:
Sum of two recent feedback values given by client with respective to service provider
C2-FB=--- 2
(3.24+3.71) 6.95 = --- = --- = 3.475 2 2
The third record of C2-FB value is taken as it is, apart from two recent transactions given by client with respect to service provider = 4.24. The final rating of C2 is got by taking the average of the above average (3.475) and the third record of C2 (4.24).
(3.475+4.24) 7.715
Final C2-FB=--- = --- = 3.857 2 2
Based on the above results, the service provider’s and client’s feedback respectively are, Final SP3-FB=1.695 and Final C2-FB=3.857, where both are not greater than 2.5. Hence, the resource broker rejects the communication.
(1) + (2)
Example for four or more than four transactions in feedback tables:
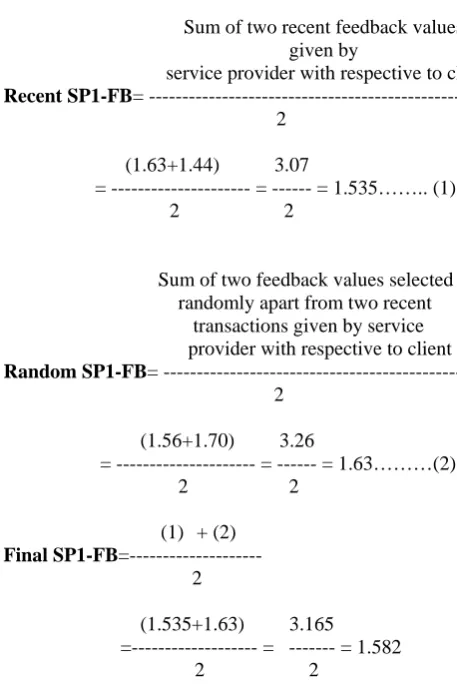
Client = C1, Service Provider = SP1 from Table 1 and Table 2 respectively:
In this example, client C1 and service provider SP1 has four or more than four records in the tables.
Calculation procedure for Service Provider’s Feedback:
Sum of two recent feedback values given by
service provider with respective to client Recent SP1-FB= ---
2 (1.63+1.44) 3.07
= --- = --- = 1.535…….. (1) 2 2
Sum of two feedback values selected randomly apart from two recent transactions given by service provider with respective to client Random SP1-FB= ---
2 (1.56+1.70) 3.26
= --- = --- = 1.63………(2) 2 2
Final SP1-FB=--- 2
(1.535+1.63) 3.165
=--- = --- = 1.582 2 2
Sum of two recent feedback values given by client with respective to service provider Recent C1-FB= ---
2 (3.00+3.1) 6.18
= --- = --- = 3.9…………(1) 2 2
Sum of two feedback values selected randomly apart from two recent transactions given by client with respective to service provider Random C1-FB= ---
2 (4.00+1.91) 5.91
= --- = --- = 2.955……..(2) 2 2
(1) + (2) Final C1-FB=---
2
(3.9+2.955) 6.045
=--- = --- = 3.022 2 2
Based on the above results, the service provider’s and client’s feedback respectively are, Final SP1-FB=1.582 and Final C1-FB=3.022, where both are not greater than 2.5. Hence, the resource broker rejects the communication.
V. CONCLUSION
This paper gives the result of the useof SPSS software to conduct the reliability test on the data collected with the help of the survey, which resulted that the data was consistent for further statistical analysis. This paper highlights a regression model based on the actual data collected through survey, which
helps the client and service provider to predict the behavior of each other for further transactions. This model also helps the entities to find out which parameters are given less feedback values so that they can improve those parameters to provider better services for further transactions. This paper also shown the usage of randomized algorithm on the data collected for various parameters.
VI. REFERENCES
[1] Biswajit Upadhyay, Abhishek Bandyopadhyay, Avijit Bhowmick, “Proposed a Robust Trust Model for Reliable and Secure Transactions in Grid Computing”, International Journal of Computer Science and Information Technologies, Volume 3 (3), 2012, Page(s):4362-4365.
[2] Safieh Siadat, Amir Masoud Rahmani, Mehran Mohsenzadeh, “Proposed Platform for Improving Grid Security by Trust Management System”, International Journal of Computer Science and Information Security, Volume 6, No.1, 2009, Page(s):143-148.
[3] M Ashok, S Sathiyan, “A Linear Regression Analysis of Trust Computation in Grid Resource Broker”, International Conference on EGovernance & Cloud Computing Services(EGov ’12).
[4] Hongmei Liao, Qianping Wang, Guoxin Li, “A Fuzzy Logic-Based Trust Model in Grid”, International Conference on Networks Security, Wireless Communications and Trusted Computing, Volume 1, 2009, Page(s): 608-614.
[5] Olusanya O.O., Olaojoyetan M.C., Longe, O.B, Adeyemi, A.S., “A Reputation Based Fuzzy Logic Framework for Virtual Enrollment in Grid Computing Environments”, Computing, Information Systems, Development informatics & Allied Research Journal, Volume 6, No. 1, September 2015, Page(s): 31-34.
[6] Shaik Naseera, Dr. K.V.Madhu Murthy, “Trust Based Load Distribution in a Data Grid Environment”, International Journal on Computer Science and Engineering, Volume 2, No.01S, 2010, Page(s): 24-29.
[7] Srivaramangai P, Rengaramanujam Srinivasan, “Enhancements to Reputation based Trust Models for Improved Reliability in Grid Computing”, WSEAS TRANSACTIONS ON COMPUTERS, Volume 10, July 2011, Page(s): 220-233.