Fife, KY16 9SX, Scotland [email protected]
Abstract
We present the first extension of the Data-Oriented Parsing paradigm (Bod 1998a) to Natural Language Generation: Unmediated Data-Oriented Generation, or UDOG. It is “unmediated” because instead of using a logic-like amodal representation of mean-ing as a basis for semantics (Van den Berg et al 1994), it exploits direct connections between exemplars in linguistic and non-linguistic (in this case visual) modalities as the basis for meaning.
1 Introduction
Since Data-Oriented Parsing (DOP) was first pro-posed (Scha 1990) and implemented (Bod 1992) as a method for statistical parsing by directly exploit-ing the statistical regularities present in a trainexploit-ing corpus without requiring any abstract representa-tions to be generated, no equivalent system for language generation has been developed. This pa-per presents the first Data-Oriented Generation algorithm: Unmediated Data-Oriented Generation, or UDOG. Whereas previous attempts to represent meaning in DOP models have relied on node-label annotations in a formal language, such as First Or-der Predicate Logic (Bod et al 1996), or the OVIS Update Language (Veldhuijzen van Zanten 1996; Bod 1998b) to provide amodal representations of meaning, UDOG exploits direct connections be-tween exemplars in linguistic and non-linguistic (in
this case visual) modalities as the basis for mean-ing.
The model presented here offers a very simple first pass at UDOG, using a toy corpus and an ex-tremely simple set of visual stimuli consisting of one-dimensional arrangements of lines and dots. Section 2 gives background information on the DOP paradigm, and Section 3 describes the task the present implementation of UDOG was de-signed to perform. The algorithm itself is described in Section 4, and the evaluation criteria are de-scribed and evaluation results given in Section 5. In Section 6, some cognitive implications of the results are considered and the overall significance of the model is assessed.
2 Background
2.1 Data-Oriented Parsing
The simplest manifestation of DOP is DOP1, as described in Bod (1998a pp 12-23 and 40-50), though more sophisticated versions exist. The parser uses a large parsed corpus divided into a training corpus and a smaller corpus against which the parser is tested. The parser breaks every tree in the training corpus down into all its possible sub-trees, according to the wellformedness rules below.
• Every subtree must be of at least depth 1.
• Every connection must have a node on ei-ther end.
• Sister relationships must be preserved.
The parser is given test corpus strings and builds up new parse-trees for these using fragments of arbitrary depth extracted from the training corpus, starting with a fragment with an S-node at the top, and then, for each nonterminal leaf-node, working rightwards, substituting in additional subtrees, the topmost node of which must carry the same label as the node to be substituted. (see fig. 1).
In DOP research it is necessary to distinguish between parses and derivations. A parse is the tree structure expressed over a string, and a derivation is the particular sequence of subtree substitutions by which it was constructed. When parsing with probabilistic context-free grammars (PCFG’s, see Manning and Schütze (1999, pp.381-405). Note that a PCFG is equivalent to a DOP grammar in which subtree depth has been restricted to 1), there is a one-to-one mapping between parses and deri-vations, because all non-terminal nodes must be substitution sites. In DOP, subtrees can be of any depth, and so in any given derivation, any subset of the non-terminal nodes could have been substitu-tion sites, while the remainder will not have been. As such, if a parse contains N many non-terminal nodes, it will have 2N many derivations.
For each subtree substitution t, its probability P(t) is calculated as its total frequency of occur-rence |t| in the training corpus over the summed corpus frequency of subtrees with the same root node; P(t) = |t| / Σ{t':r(t')=r(t)}|t'|, where r(t) and r(t')
are the node-labels on the root-nodes of subtrees t and t'. The probability of a derivation is the prod-uct of the probabilities of its subtrees, P(t1 o … o tn)
= Πi P(ti): And the probability of a parse T is the
sum of the probabilities of its possible derivations D, P(T) = Σ{D:D derives T} P(D).
The output of the parser is, in theory, the most probable parse. In practice, there are issues of computational complexity that prevent this from being calculated directly; instead, Monte-Carlo sampling may be employed to approximate the most probable parse (Bod 1993)
Bod (1998a p.54) reports accuracies of 85% on the ATIS1 corpus for DOP1. Bod (2005) reports accuracies of 91.1% for a more sophisticated form of DOP, DOP+.
3 The Task
3.1 Training Data
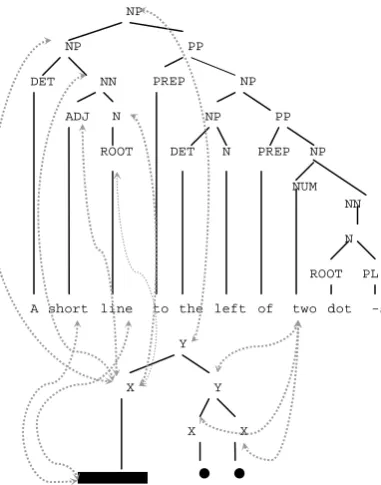
[image:2.595.85.298.168.285.2]UDOG differs from existing DOP algorithms in that the items in the training data are not single trees over a string, but pairs of trees, one over a linguistic string, the other over content in some other cognitive modality, connected at particular nodes by crossmodal linkages. Figure 2 shows an example of a tree pair used in the present simula-tions: both the visual and verbal content are anno-tated with labeled tree-structures, and additionally a few of the crossmodals are shown.
Figure 2: Paired image and description trees, with crossmodal connections; note that some
crossmo-dals have been omitted for clarity.
1 Air Transport Information System – part of the Penn
Tree-bank. N
V NP
VP
NP
N S
John
likes
N V
NP VP
NP
N S
John likes Mary
VP Mary
[image:2.595.318.509.442.685.2]N o o =
Figure 1: A derivation of “John likes Mary”. “o” is the tree-substitution operator.
NP
NP
PP
NN DET
DET N PREP NP ADJ N
PREP NP
PP NP
NUM NN
N
ROOT
A
Y
X
X Y
X
A training corpus of image-description pairs such as this was generated from templates using a script, “CorpusMonkey”. CorpusMonkey gener-ated all 120 possibilities for images consisting of either one group of one, two or three dots, dashes, short lines or long lines2, paired with a description of the form “X”, “two X-s” or “three X-s”; or two such groups, provided each group is comprised of different types of basic object, paired with descrip-tions of either the form “X to the left of Y”, or “Y to the right of X”. Which form of description was employed was selected at random, with equal probabilities.
3.2 Tests
[image:3.595.100.225.520.625.2]Two tests were used to evaluate UDOG’s performance. The General Test was run in six parts; the CorpusMonkey training data was divided into six blocks, and in each part a different block was selected to be test data, while the rest was used as training data, so that it was only ever tested on unseen data. The test data was presented as unparsed visual stimuli alone, of which the system was required to produce descriptions. In the second test, the Wug Test, the complete CorpusMonkey corpus was presented, plus twelve identical tokens of the form shown in Figure 33, introducing a new type of object (a seven-pixel line) and a new vocabulary item, a “wug”.
Figure 3: A novel item of vocabulary
2
A dot was always a single pixel, a dash was a three-pixel line, a short line five pixels, and a long line ten.
3
The decision to use twelve tokens was arbitrary, but it was felt that in order to cut down the noise in the Monte Carlo sample, the prevalence of wugs in the corpus should be in the same order of magnitude as that of other basic objects. As it was there were a quarter as many wugs as any other basic object.
The system was then tested using images com-prising a group of one, two, or three wugs to the left or right of one, two or three dots, dashes, short lines or long lines. Thus, UDOG was required to extract syntactic patterns from the CorpusMonkey data, and redeploy them with a vocabulary item that it had not encountered in such contexts; this was therefore A direct test of UDOG’s ability to generalize syntactic patterns beyond the training data.
4 The UDOG algorithm
4.1 Substitutions
Like DOP1, UDOG derivations are constructed from arbitrary-depth fragments extracted from the training data; unlike DOP, the fragments are in fact groups of crossmodally connected subtrees (ex-actly one non-linguistic (visual) and one or more linguistic), which, if possible, should be connected at their root nodes, and correspondingly, the substi-tution sites are not single nodes, but groups of nodes, (again, one non-linguistic and one or more linguistic), which should also, if possible, be crossmodally connected.
Thus, at each step of the derivation, exactly one substitution site on the image tree is chosen at ran-dom; if this substitution site is crossmodally con-nected to any of the potential substitution sites on the verbal tree4, it can in theory substitute subtrees at all of these sites. The wellformedness criteria are as follows:
1) All of the component unimodal subtrees are well-formed by the normal standards of DOP1. 2) All unimodal subtrees should originate from
the same tree-pair P.
3) Each verbal subtree should contain only nodes which either:
a) Have no crossmodal connections at all, or b) Have crossmodal connections, at least one
of which is to a node in the visual subtree. 4) The root node of each verbal subtree should be
crossmodally connected to the root node of the visual subtree.
4
In the case of the first substitution in a derivation, a substitu-tion site of a crossmodally connected NP node and Y node is assumed. All tree pairs in the training data are rooted in crossmodally connected NP and Y nodes.
a wug N DET
ROOT NP
NN
5) No root node of a verbal subtree can be an an-cestor or descendant of the root node of any other: that is to say, if nodes n1 and n2 are in an
ancestor-descendant relationship in the verbal tree W of the originating corpus tree-pair, they cannot both be selected to be the head-nodes of subtrees in the same bimodal subtree.
6) The set of verbal subtrees in a well-formed bimodal subtree cannot be a proper subset of the set of verbal subtrees in any other well-formed subtree.
7) For each node-label L represented x many times in the set of possible substitution sites, there should be no more than x many verbal subtrees in the bimodal subtree with root-nodes labelled L.
The algorithm exhaustively checks all possible subsets of the set of nodes in the verbal tree con-nected to the root node of the visual subtree for validity, according to the standards of (5), (6) and (7). A subset is chosen at random, at a probability modelled by the equation:
( )
∑ ∑
∑
∈ ∈
∈
=
V S node S
node S
node
node
i j i
j i
i
subtrees subtrees S
P (1)
Where S and Si are sets of nodes, V is the set of
valid sets of nodes according to criteria (5), (6) and (7) above, and subtreesnodex is the total number of
subtrees rooted in nodex. The total number of
sub-trees of any node node can be found using equation 2:
(
)
( ) {
∏
≡ }+ =
i i
i
node mother node node
node
node subtrees
subtrees
:
1 (2)
For each node n in the chosen set, a subtree t for which n = root(t) is chosen at a probability mod-eled by equation 3 below:
) (
1 )
(
root t
subtrees t
P = (3)
If it is either not possible to find a substitution site, or a bimodal subtree, that meets the above criteria, the system backs off to a simpler system, whereby a well-formed exemplar fragment com-prises one visual and one verbal tree, and must otherwise only meet criteria (1)-(3) of the normal wellformedness criteria.
4.2 From derivations to final outputs
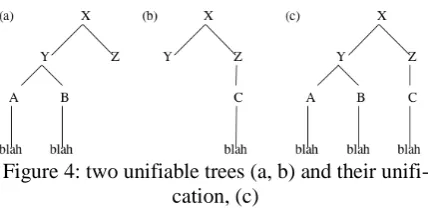
[image:4.595.318.533.466.570.2]Substitutions continue until either the visual or the verbal tree is completed: that is to say, has no non-terminal leaf nodes. There is no guarantee that the two trees will be completed together, and indeed, since the verbal trees in the training data have far more nodes than the visual trees, it almost always happens that the visual tree is completed first. Thus, because of the high prevalence of incomplete verbal trees in the output from derivations, instead of simply gathering the outputs of many deriva-tions and polling them as a Monte-Carlo set for the most frequent output, an algorithm, the details of which are not relevant here, was used to find the largest unifiable subset of the trees in the sample. Two trees are taken to be unifiable if there is at least one possible (not necessarily complete) tree of which both trees are co-racinous5 legal subtrees according to the unimodal wellformedness criteria of DOP1. The unification of the two trees, then, is the smallest tree that meets this description, if any tree can. Two unifiable trees and their unification are shown in Figure 4. The system’s output, then, is the unification of the largest unifiable subset of the sample.
Figure 4: two unifiable trees (a, b) and their unifi-cation, (c)
The working assumption here is that, although the trees output by UDOG are incomplete, they will tend, if the algorithm is working, to be frag-ments of correct outputs: therefore unifying them allows complete (or at least, closer to complete) trees to be made. If fragments of correct trees are indeed the most frequent output, the largest unifi-able set should unify into a correct complete output
4.3 Naïve UDOG
For comparison, a naïve version of the algorithm was also tested; this version used the “backoff” behaviour described at the end of §4.1 as it’s
fault behaviour. Thus the full version of UDOG (“Smart” UDOG) used wellformedness criteria (4)-(7) as a way of “binding” meaningfully related subparts of paired trees, whereas Naïve UDOG relies on frequency of co-occurrence alone.
5 Results and Discussion
5.1 Evaluating the outputs
In both tests the output for each stimulus of both models was manually scored as the average of four measures: Object (O), Number (N), Relation (R) and Grammaticality (G). The measures used are tabulated in Table 1. All measures were taken as percentages.
(O) Judged on the identification of the cor-rect type or types of basic object6 in the stimulus. Because, in some outputs, the number of types named did not match with the number of types present in the stimulus, this was judged as an F1-score: that is to say, as the harmonic mean7 of precision (the proportion of correct elements in the output) and re-call (the proportion of elements in the input correctly named in the output). (N) Judged according to whether the named
objects were correctly numbered. Again, this was expressed as an F1-score.
(R) If the image contained only one group of same-type basic objects, or a single basic object, full marks on this measure were awarded for naming only one ob-ject type, and no “to the left of” or “to the right of” term, and zero marks are awarded otherwise. If two types of ba-sic object are present in the stimulus, full marks are awarded if only the two types are named and the left/right rela-tionship between them is correctly de-scribed. Partial marks are given if a cor-rect relationship description is present but more than two tokens of
6
“Dot”, “dash”, etc…
7 The harmonic mean or x and y is given by the equation
y x
xy M
+
= 2
group namings are present, because in this case the system has in such a case had extra chances to get it right.
(G) A purely subjective measure of gram-maticality and intelligibility.
Table 1: scoring criteria
5.2 General Test
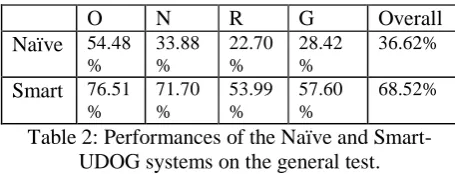
The results of the general test on both systems are summarised in Table 2 below.
O N R G Overall
Naïve 54.48 %
33.88 %
22.70 %
28.42 %
36.62%
Smart 76.51 %
71.70 %
53.99 %
57.60 %
[image:5.595.288.516.278.365.2]68.52%
Table 2: Performances of the Naïve and Smart-UDOG systems on the general test.
Eyeballing the data, the overwhelming impres-sion is that the smart system far outperforms the naïve system on all measures; overall, the smart performance is almost double the naïve, and on individual measures the smart system more than doubles the naïve score on all counts except Ob-ject, where it is still approximately 40% better. It is notable that Object is the only metric for the most part not dependent on word-ordering considera-tions. It is also of interest that, in comparing the three non-subjective scoring criteria (Object, Number and Relation), for both systems, the easi-est, Object, was that which depended on the short-est-distance syntactic/semantic relations (between noun and adjective within an NN group, if any syn-tactic relation was present at all), and the hardest was that which depended on the longest-distance syntactic/semantic relationship, spanning the whole noun phrase. A 2x4 mixed-design ANOVA was conducted to test the significance of the differ-ences in Table 3.
F Sig. at p
System 67.71 <0.001
System * Scoring Criterion 11.31 <0.001 Scoring Criterion 93.79 <0.001
Table 3: 2x4 mixed design ANOVA
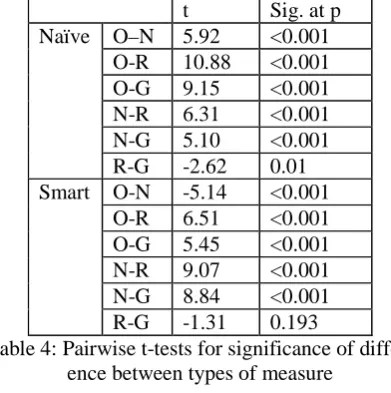
the individual scoring criteria (within systems) us-ing pairwise t-tests (Table 4) and the systems per-formance on each scoring criterion individually using independent samples t-tests (Table 5).
t Sig. at p
O–N 5.92 <0.001 O-R 10.88 <0.001 O-G 9.15 <0.001 N-R 6.31 <0.001 N-G 5.10 <0.001 Naïve
R-G -2.62 0.01 O-N -5.14 <0.001 O-R 6.51 <0.001 O-G 5.45 <0.001 N-R 9.07 <0.001 N-G 8.84 <0.001 Smart
[image:6.595.91.287.217.414.2]R-G -1.31 0.193
Table 4: Pairwise t-tests for significance of differ-ence between types of measure
t Sig. at p
O 7.143 <0.001 N 11.124 <0.001 R 5.656 <0.001 G 5.489 <0.001
Table 5: Independent samples t-tests, for signifi-cance of difference between systems
All differences between types of measure proved highly significant, at p<0.001, except for between Relation and Grammaticality, which remains sig-nificant at p<0.05 for Naïve UDOG, and does not attain significance for Smart-UDOG. All these re-sults were double-checked using non-parametric tests (Friedman tests for the pairwise t-tests, a Kruskal-Wallis test for the independent samples t-test).
5.3 Wug Test
The results of the Wug test on both systems are summarised in Table 6 below
O N R G Overall
Naïve 50.6 5%
29.3 1%
8.01 %
14.5 4%
25.62%
Smart 79.4 5%
94.6 2%
69.0 6%
66.0 0%
[image:6.595.322.529.438.609.2]77.28%
Table 6: Results from the Wugs test
Eyeballing the data, the difference between the two systems seems to be even more marked, most notably in Relation, where Naïve UDOG performs at a fraction of its score on the general test, whereas Smart-UDOG has actually improved. In-deed, the pattern is found across the board, that Naïve UDOG becomes less accurate faced with a vocabulary item for which it has no context, whereas Smart-UDOG performs better than in the general test.
Theoretically speaking, what is of greatest inter-est here is effect of the “wug” condition on per-formance, as compared to the general test (or, here, the “no-wug” condition), in relation to the Relation score, since the binding of elements into correct semantic relations was quite explicitly what the smart system was formulated to do, and to the Overall score. A 72-item random sample was taken at random from the general test dataset, so that 2x2 mixed ANOVAs could be performed, between “system” and “wugs/no-wugs”, for the Relation score (Table 7), and the Overall score (Table 8).
F Sig. at p
System 237.861 <0.001
System * Wugs 6.422 0.12
Wugs 0.483 0.488
Table 7: 2x2 mixed design ANOVA on Overall scores
F Sig. at p
System 124.054 <0.001
System * Wugs 0.194 0.047
Wugs 93.79 0.66
Table 8: 2x2 mixed design ANOVA on Relation scores
[image:6.595.82.301.694.761.2]t Sig. at p Naïve 3.446 0.01
Rela-tion Smart -2.217 0.028
Naïve 3.15 0.002
Overall
Smart 168.395 0.027 Table 9: independent t-tests on the effect of the “wugs” condition on relation scores and overall
scores for both models.
In all cases, the effect of the Wugs parameter is found to be significant at p<0.05. It is no surprise that the naïve version suffered in the wug test; it relies wholly on the contexts given in exemplars to bind syntactic elements within semantic relations, which it was expressly denied in the wug test. The surprising result is that the improvement in per-formance in Smart-UDOG also proved significant.
6 Discussion & Conclusions
First of all, Smart-UDOG shows, for the first time, that the Data-Oriented approach can be applied to generation tasks, and that a Data-Oriented model can integrate more than one cognitive modality.
6.1 Why did Wugs help Smart UDOG?
One outcome of the tests performed on the two UDOG systems was that Smart UDOG would ac-tually perform better on the Wug Test than on the General Test; I had instead expected that it would either show no significant effect, or that its per-formance would be decremented, either to the same degree as the Naïve system, indicating that the “Smart” welformedness conditions should be seen as a technological fix for sparse data, or to a significantly less degree, indicating that they should be seen as essential to the success of the algorithm. However, it is easy to figure out just how the Wug condition helped Smart-UDOG along. One common type of error is illustrated in a real example taken from Smart-UDOG’s perform-ance on the General Test:
Input =
Output = a dot *PL* to the right *PREP* a short line to the line of two *NN*
A correct output here would have been “Three dots to the right of a short line” or “A short line to the left of three dots”.
What has happened here is that structure for the relation expression has been imported into the
out-put from two separate sources: one coming with material contributing to the description of the sin-gle short line, the other coming with the what I presume to be an abortive attempt at describing two of the three dots. In both cases, the object-and-number describing material came bound up with relation-describing material, and these together caused a confused and ill-formed output. In the Wug Test, the description of the wug cannot come with such extraneous material, since the only ex-emplars associating the word “wug” with images of wugs contain nothing more than a single wug, described as “a wug” (see Figure 3).
This suggests an interesting hypothesis regard-ing First Language Acquisition, to be followed up if further work on UDOG proves successful. Smart-UDOG benefits notably from having access to isolated examples of words paired with their referents. Bates et al (1988) outline a “two-strand” theory of individual differences in First Language Acquisition, wherein two main learning strategies employed by infant language learners: “Strand two” is characterised by slow vocabulary growth and a tendency towards holophrases in which multi-word utterances are used as unanalysed wholes, but of greater interest here is “Strand one”. Below is Bates et al’s (ibid.) full tabulation of the key features of “Strand one” semantic learning:
• High proportion of nouns in first 50 words
• Single words in early speech
• Imitates object names
• Greater variety within lexical categories
• Meaningful elements only
• High adjective use
• Context-flexible use of names
• Rapid vocabulary growth
Bates et al, ibid.
exemplars in the Wug Test in §§5.2 and 6.3, which are then available to the child as part of her exem-plar-base. This suggests a direction for the empiri-cal testing of the UDOG model against human sub-jects.
6.2 Conclusion
The achievement of the model itself is small, but what it has shown to be possible – generation and the integration of multiple cognitive modalities under a Data-Oriented framework, represent con-siderable advances for Data-Oriented approaches to Cognitive Science and Artificial Intelligence. On the webpage for the new Cognitive Systems research group at the University of St. Andrews, Bod (2006) proposes the goal of the new group to be “to develop one system that unifies different modalities” (author’s emphasis): certainly the models of language, music and reasoning in Bod (2005) show that unimodal DOP models can be used to unify cognitive modalities under a single formalism; but the programme of multimodal Data-Oriented research that the present work warrants, offers a potential way to integrate different mo-dalities within a single model.
Acknowledgements
Thanks to Rens Bod, Hannah Cornish, and several anonymous reviewers for helpful comments and discussion, and especially to Simon Kirby, who had several very good reasons not supervise for this project, but did anyway, and to great effect. This work was supported by the AHRC.
References
Elizabeth Bates, Inge Bretherton, and Lynn Snyder. 1988. From first words to grammar: Individual
dif-ferences and dissociable mechanisms. Cambridge
University Press. New York, NY.
Rens Bod. 1992. A Computational Model of Language Performance; Data-Oriented Parsing. Proceedings
COLING-92, Nantes, France.
- 1993. Applying Monte Carlo Techniques to Data Ori-ented Parsing. Computational Linguistics in the
Netherlands, Tilburg, The Netherlands.
- 1998a. Beyond Grammar; An Experience-Based
The-ory of Language. Centre for the Study of Language
and Information, Stanford, CA.
- 1998b. Spoken Dialogue Interpretation with the DOP Model. Proceedings COLING-ACL-98, Montreal, Canada.
- 2005. Towards Unifying Perception and Cognition: The Ubiquity of Trees. Prepublication.
- 2006. Cognitive Systems Group: The DOP Approach to Language and Cognition. http://cogsys.dcs.st-and.ac.uk/ (Accessed 28th August 2006).
Rens Bod, Remco Bonnema and Remco Scha. 1996. A Data-Oriented Approach to Semantic Interpretation.
Proceedings Workshop on Corpus-Oriented Seman-tic Analysis, ECAI-96, Budapest, Hungary.
Chris Manning and Hinrich Schütze. 1999. Foundations
of Statistical Natural Language Processing. The MIT
Press. Cambridge MA.
Remco Scha. 1990. Taaltheorie en Taaltechnologie: Competence en Performance. In Q. de Kort and G. Leerdam (eds.), Computertoepassingen in de
Neer-landistiek, Landelijke Vereniging van Neerlandici
(LVVN-jaarboek). Almere, The Netherlands.
Van den Berg, M., R. Bod, and R. Scha. (1994). A Cor-pus-Based Approach to Semantic Interpretation.
Pro-ceedings Ninth Amsterdam Colloquium, Amsterdam,
the Netherlands.