An Experimental Study on Laterite Soil
Stabilization Using Bitumen Emulsion
M.Udaya Sri1, P.M.S.S.Kumar2
PG Scholar, Dept of Civil Engineering, Sanketika Institute of Technology and Management, P.M.Palem,
Visakhapatnam, Andhra Pradesh, India. 1
Assistant Professor, Dept of Civil Engineering, Sanketika Institute of Technology and Management , P.M.Palem,
Visakhapatnam, Andhra Pradesh, India. 2
ABSTRACT: Soil is a major component of the Earth’s ecosystem. It is one of nature’s most superabundant
construction materials. Every structure- building, bridge, highway, tunnel, canal or dam is founded in or on the soil surface of the earth. The soil sub grade plays the most important role in road pavements as this has to ultimately support all pavement layers laid above along the anticipated traffic load. If the strength of the soil is not up to its grade, then stabilization is needed. If the locally available soil is found to be unstable as a sub grade material for construction then it should be stabilized or replaced with stronger soil material to improve its strength characteristics. This stabilization method is economical both in terms of cost and energy in structural thickness of pavement. The very commonly used materials for stabilization are Lime , cement , fibers ,fly ash.
The main intent of this experimental study is to improve the properties of the laterite soil by adding bitumen emulsion. An attempt has been made to use bitumen emulsion for improving the strength of laterite soil expressed in terms of California Bearing Ratio (CBR) values which may prove to be economical. In this research, the whole laboratory work revolves around the basic properties of soil and its strength in terms of CBR. A little Fly ash is added to improve soil strength. It is observed that excellent soil strength results by using cationic bitumen emulsion (CMS) with little quantity of fly ash used as filler. The appropriate mixing conditions for laterite soil with CMS Bitumen emulsion have been first attempted. This is followed by deciding four specific material conditions to show the variation in dry density and CBR value to achieve the best feasible strength properties of laterite soil.
KEYWORDS: Laterite soil, CBR, Bitumen Stabilization, bitumen emulsion
I. INTRODUCTION
Modifying the properties of a soil to improve its engineering performance is referred to as soil stabilization. Methods of stabilization may be grouped under two main types : (a) modification or improvement of a soil property of the existing soil without any admixtures. Examples for this kind of stabilization are compaction and drainage which improve the inherent shear strength of soil (b)modification of the properties with the help of admixtures Examples for second type stabilization are Mechanical stabilization, stabilization with cement, lime and chemicals etc… .Soil is the un aggregated or un cemented deposits of mineral and/or organic particles or fragments covering large portions of the earth’s crust. Sub grade is a native material underneath a constructed road. Soil underneath the pavement without interruption is called regular soil sub grade. Sub grade which is commonly compacted by inhibited development of distinctive sorts of substantial compactors is defined as compacted sub grade
Currently every pavement construction projects are using either one or both of these stabilization procedures.The most familiar type of mechanical soil stabilization is compaction of the soil, while the addition of lime, cement, fibres, bituminous or alternate executors is suggested to as a synthetic or added substance procedure for stabilization of soil. American Association of State Highway and Transportation Officials (AASHTO) classification system is a soil classification system specially designed for the construction of roads and highways used by transportation engineers. This organization uses Atterberg limits, such as Liquid Limits and Plasticity Index and the grain-size distribution to categorize the soil properties. Generally an additive is a substance which is added in small quantities to a specific material to improve its properties. Moreover it’s used to act as a binder,after the effect of moisture, increase the soil density. Some of the most widely used additives: Portland cement, Fly Ash,Quicklime or Hydrated Lime,Bitumen Calcium Chloride, etc. But, mechanical soil stabilization implies to either compaction or the introduction of well built and other non-biodegradable reinforcement of soil. This practice does not constrain compound change of the soil and it is efficient to utilize both mechanical and concoction intends to achieve detailed stabilization. There are a few more practices used to accomplish mechanical stabilization like compaction, soil reinforcement, combining, expansion of graded aggregate materials and mechanical remediation.
II. MATERIALS AND METHODS
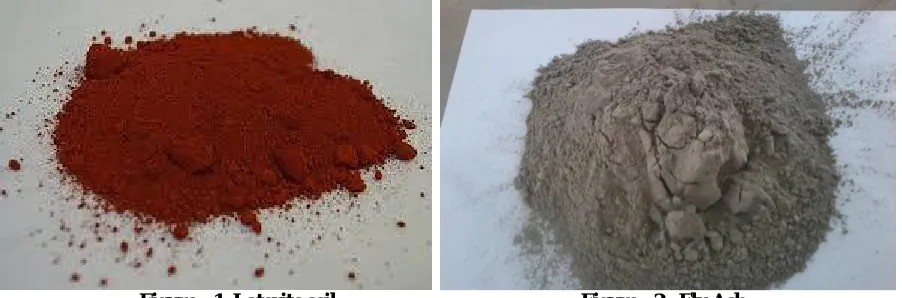
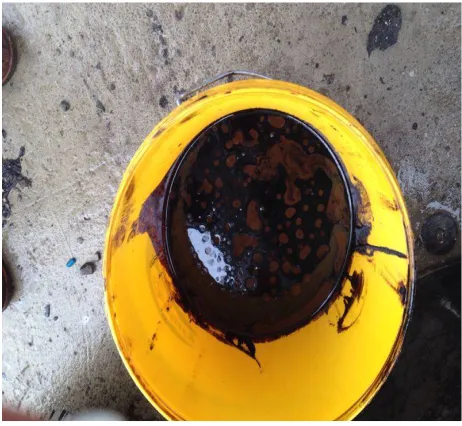
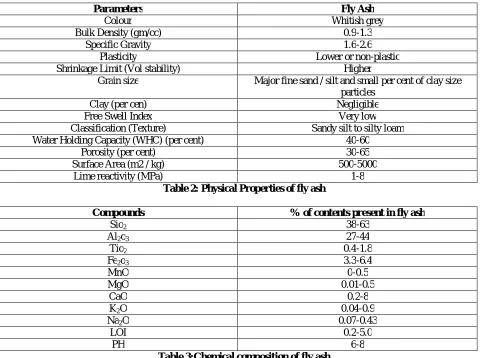
The materials used for this study are: Laterite soils, Bitumen emulsion, Fly ash and water.The soil samples used for this study were obtained from local road routes in Anandhapuram village, Visakhapatnam District. The fly ash used as a filler material was procured in a 1 kg bag were purchased from National Thermal Power Corporation (NTPC), Visakhapatnam and stored in a dry place away from weather effects. Bitumen emulsion of viscosity gradient -40 (VG-40) were purchased from M.S KA Prasad Raju hot mix plant, Chinnapuram, Vizianagaram. Potable water treated in the laboratory was used for the test carried out during the study.
Figure : 3, Bitumen Emulsion
III. EXPERIMENT PROGRAMME
Specific gravity test
Specific gravity G is defined as the ratio of the weight of a given volume of soil solids at a given temperature to the weight of an equal volume of distilled water at that temperature.
Table 1:Standard Specific Gravity
Type of soil Specific gravity
Sand 2.63 to 2.67
Silt 2.65 to 2.7
Clay and silty soil 2.67 to 2.9
Fly Ash :
Fly ash , comes primarily from coal-fired, electricity-generating power plants. These power plants grind coal to powder fineness before it is burned. It is the mineral residue produced by burning coal – is captured from the power plant’s exhaust gases and collected for use.
Fly ash particles are almost totally spherical in shape, allowing them to flow and blend freely in mixtures. That capability is one of the properties making fly ash a desirable admixture for concrete.
Fly ash particles are generally spherical in shape and range in size from 0.5 µm to 300 µm. Fly ash typically costs approximately 1/2 to 2/3 that of Portland cement
Parameters Fly Ash
Colour Whitish grey
Bulk Density (gm/cc) 0.9-1.3
Specific Gravity 1.6-2.6
Plasticity Lower or non-plastic
Shrinkage Limit (Vol stability) Higher
Grain size Major fine sand / silt and small per cent of clay size particles
Clay (per cen) Negligible
Free Swell Index Very low
Classification (Texture) Sandy silt to silty loam Water Holding Capacity (WHC) (per cent) 40-60
Porosity (per cent) 30-65
Surface Area (m2 / kg) 500-5000
Lime reactivity (MPa) 1-8
Table 2: Physical Properties of fly ash
Compounds % of contents present in fly ash
Sio2 38-63
Al2o3 27-44
Tio2 0.4-1.8
Fe2o3 3.3-6.4
MnO 0-0.5
MgO 0.01-0.5
CaO 0.2-8
K2O 0.04-0.9
Na2O 0.07-0.43
LOI 0.2-5.0
PH 6-8
Table 3:Chemical composition of fly ash
California Bearing Ratio Test
Fig. 4: California Bearing Ratio Testing Machine
California Bearing Ratio(CBR) value is calculated by using the formula:
C.B.R. = (Test load /Standard load) 100 %
The following table gives the standard loads adopted for different penetrations for the standard material with a C.B.R. value of 100%
Penetration of plunger (mm) Standard load (kg)
2.5 1370
5 2055
7.5 2630
10 3180
Table 4: Standard load in different penetration
The CBR apparatus consists of a mould 150mm diameter with a base plate and a collar, a loading frame with the cylindrical plunger of 50mm diameter and dial gauges for measuring the expansion on soaking and the penetration values. Minimum number of two surcharge weights is issued which sets an example. The specimen used in the mould is compacted by 30 blows to a dry density corresponding to the minimum state of compaction likely to be achieved in practice. The specimen is subjected to four days soaking and the swelling and the water absorption values are noted. The surcharge weight of diameter 147mm and weight 2.5 kg is placed on the top of the specimen in the mould and the assembly is placed under the plunger. The load values are noted corresponding to penetration values of 0.0, 0.5, 1.0, 2.0, 2.5, 3.0, 4.0, 5.0, 7.5, 10.0 and 12.5mm.The uttermost load and penetration is recorded in the event that it happened for a penetration of 13 mm.
The normal curve obtained is with convexity upwards corresponding to 2.5 and 5.0 mm penetration values. Sometimes a curve with initial upward concavity is obtained, indicating the necessity of correction. In such cases, the corrected origin is established by drawing a tangent from the steepest point on the curve to obtain a corrected region.
The causes for initial concavity of the load penetration curve are
(ii) The top surface of the soil is not even
Normally CBR value at 2.5mm penetration is higher than that at 5.0mm and the higher value is reported as the CBR value of the material. However if the CBR value obtained at 5.0mm penetration is higher than that obtained at 2.5mm, then the test is to be repeated for testing.This CBR test denotes a measure of resistance to penetration of a soil or flexible pavement material, of standard plunger under controlled test conditions. If by chance the indistinguishable results take after, the bearing ratio relating to 5mm penetration is taken for design process.
IV. RESULTS AND DISCUSSIONS
The following test results are obtained by conducting the different laboratory tests
Specific gravity test
Specific gravity of soil is one of the foremost engineering properties to find out the degree of saturation at unit weight of moisture. As previously mentioned here M1 is empty bottle weight, M2 is mass of bottle and dry soil, M3 is weight of bottle, dry soil and water and M4 is weight of bottle with water.
Table 5: Specific gravity test result
Sample no. M1(gm) M2(gm) M3(gm) M4(gm) Sp. gravity
1. 16.94 32.43 83.57 75.62 2.07
2. 16.94 41.36 88.63 75.62 2.40
3. 16.94 36.41 87.67 75.62 3.60
The following soil sample is tested three times. The average specific gravity value comes 2.692. But here no temperature correction is done. This test have been done in room temperature nearly 25*C.
Grain size distribution (sieve analysis)
Index properties are termed as which by defining various physical and engineering properties by which soil can be properly identified. Soil grain property depends to individual solid grain and remains unaffected by the state in which a particular soil exists in nature.
Here the soil which we collected is in natural granular in structure and are possessed of low plasticity and excellent durability .By the following D10,D30,D60 values,
Co efficient of uniformity, (Cu) :D60/D10 =11.90
Co efficient of curvature , (Cc) : D302/(D60*D10) = 1.95
By the above values the following sample comes under well graded gravels.
Liquid limit and Plastic limit Test
The Laterite soil which was usedin this study are fine grained, soft moist soils was soil obtained from local routes in Anandhapuramvillage, Visakhapatnamdistrict. This soil was tested for specific gravity, liquid limit, plastic limit and grain size distribution as to know about its about physical properties of this specific soil material. From these experimental results a proper idea about the type of soil has been found.
Liquid Limit: 32.41% Plastic Limit: 22.17%
Standard Proctor Test (Compaction Test)
This compaction test is conducted by taking about 3000gms of air-dried and pulverized soil, passing a 0.75 mm sieve and is mixed thoroughly with a small quantity of water. The mixture is covered with a wet soil and left for a maturing time of about 5 to 30 minutes and it is even more for clay type soils. The test results like, maximum dry density of the specimen and Optimum moisture content of the specimen are found to be10.40 gm./cc and2.30 OMC %.
As mentioned previously in literature work ,Yuehaun et al. had been done an experimental study on foamed bitumen stabilization for Western Australian pavements. And similarly a work was developed on foam bitumen stabilization by Martin in Queensland in 2011. The common matter on both works is to provide the optimum value on bitumen content percentage 3% to 4%. After testing in different percentage 3%, 5% and 7% it is seen that maximum dry density of this soil is not so much effectively changed. In this test the mix sample is tested with 9% bitumen emulsion also to find the variation in result that where it gets drop down.
It’s already mentioned previously that very few works had done on bitumen soil stabilization. The only code which is available is bitumen sand stabilization IS code. So, how to mix the late rite soil with emulsion is the crucial problem. So, in this case four particular conditions for testing are used here to check the variation of maximum dry density of this laterite soil mixing with emulsion.
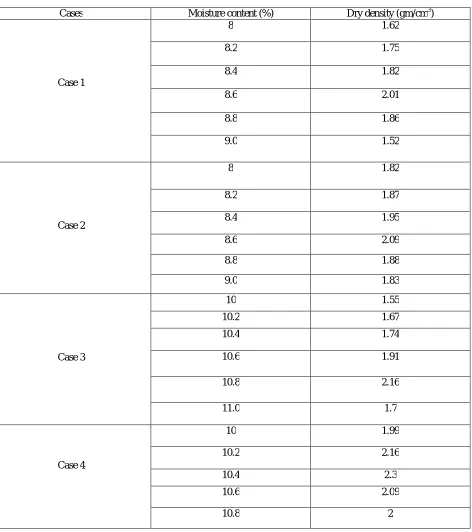
Case 1:Normal available tested soil is used for testing
Case 2 :Normal available soil tested with 5% MS emulsion added
Case 3:Normal available soil tested with 5% MS emulsion and 5% fly ash added
Case 4 :Normal available soils tested mixing with 5% of emulsion and 5% of fly ash is added and wait 5 hour before testing
Case 1:Normal available tested soil is used for testing
Figure 5, test with normal available soil
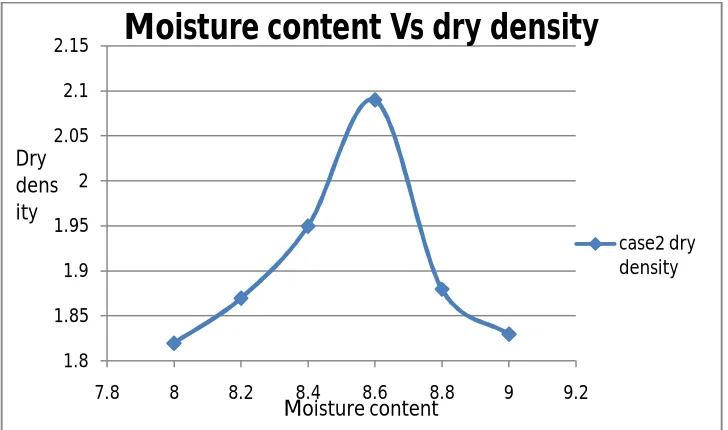
Case 2:Normal available soil tested with 5% MS emulsion added
Figure 6, test with soil + 5% bitumen
1.8 1.85 1.9 1.95 2 2.05 2.1 2.15
7.8 8 8.2 8.4 8.6 8.8 9 9.2
Moisture content Vs dry density
case2 dry density
Moisture content Dry
dens ity
0 0.5 1 1.5 2 2.5
7.8 8 8.2 8.4 8.6 8.8 9 9.2
Moisture content Vs dry density
dry density
Moisture content Dry
Case 3:Normal available soil tested with 5% MS emulsion and 5% fly ash added
Figure 7, test with soil + 5% bitumen+ Fly ash
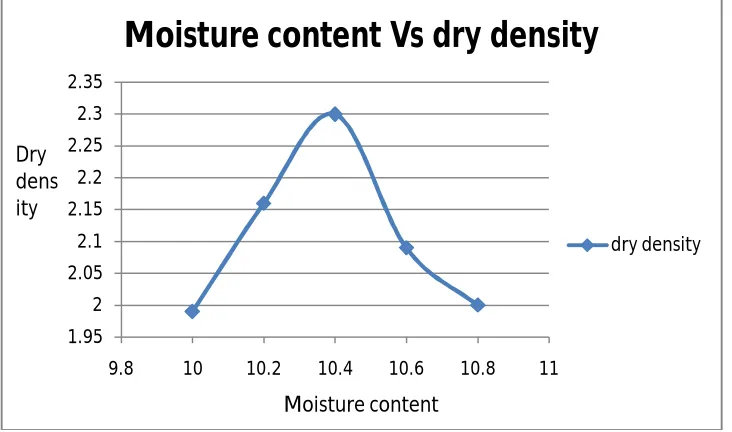
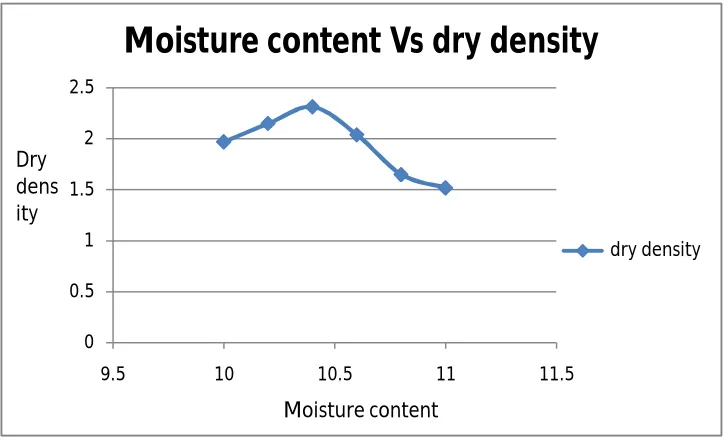
Case 4 :Normal available soils tested mixing with 5% of emulsion and 5% of fly ash is added and wait 5 hour before testing
Figure 8, test with soil + 5% bitumen+ Fly ash, kept undisturbed for 5 hours
0 0.5 1 1.5 2 2.5
9.5 10 10.5 11 11.5
Moisture content Vs dry density
dry density
Moisture content Dry
dens ity
1.95 2 2.05 2.1 2.15 2.2 2.25 2.3 2.35
9.8 10 10.2 10.4 10.6 10.8 11
Moisture content Vs dry density
dry density
Moisture content Dry
Cases Moisture content (%) Dry density (gm/cm3)
Case 1
8 1.62
8.2 1.75
8.4 1.82
8.6 2.01
8.8 1.86
9.0 1.52
Case 2
8 1.82
8.2 1.87
8.4 1.95
8.6 2.09
8.8 1.88
9.0 1.83
Case 3
10 1.55
10.2 1.67
10.4 1.74
10.6 1.91
10.8 2.16
11.0 1.7
Case 4
10 1.99
10.2 2.16
10.4 2.3
10.6 2.09
10.8 2
Here, from the previous results of modified proctor test, it is strictly showing that how the dry density value for the same material is going to increase from case 1 to case 4, which is the change of maximum dry density value from 2.01 gm/cc up to 2.3 gm/cc. A little bit vatiationin optimum moisture content value in different cases. This dry density, (Yd
) value is a very important physical property in case of stability of sub grade soil. Below the variation of maximum dry density in those special cases are shown bar wise.
Figure 9,Variation of maximum dry density value
There may be a chance to question that at how this maximum dry density is depending upon mixing bitumen quantity and whether it is the optimum point or not. So again modified proctor test is done varying the bitumen content 3%, 5% ,7% and 9% following mixing procedure D. This result gives us a clear idea about used 5% bitumen content
Case 5:Normal available soils tested mixing with 3% of emulsion and 5% of fly ash is added and wait 5 hour before testing
Figure10, test with soil + 3% bitumen+ Fly ash, kept undisturbed for 5 hours
1.85 1.9 1.95 2 2.05 2.1 2.15 2.2 2.25 2.3 2.35
case 1 case 2 case 3 case 4
Series1
Different cases Dry
density
1.9 1.95 2 2.05 2.1 2.15 2.2 2.25 2.3
9.8 10 10.2 10.4 10.6 10.8 11
Moisture content Vs dry density
dry density
Moisture content Dry
Case 6 :Normal available soils tested mixing with 7% of emulsion and 5% of fly ash is added and wait 5 hour before testing
Figure11 ,test with soil + 7% bitumen+ Fly ash, kept undisturbed for 5 hours
Case 7 :Normal available soils tested mixing with 9% of emulsion and 5% of fly ash is added and wait 5 hour before testing
Figure 12, test with soil + 9% bitumen+ Fly ash, kept undisturbed for 5 hours
0 0.5 1 1.5 2 2.5
9.8 10 10.2 10.4 10.6 10.8 11 11.2
Moisture content Vs dry density
dry density
Moisture content Dry
dens ity
0 0.5 1 1.5 2 2.5
9.5 10 10.5 11 11.5
Moisture content Vs dry density
dry density
Moisture content Dry
Cases Moisture content (%) Dry density (gm/cm3)
Case 5
10 1.96
10.2 2.16
10.4 2.28
10.6 2.22
10.8 1.94
Case 6
10 1.97
10.2 2.15
10.4 2.31
10.6 2.04
10.8 1.65
11.0 1.52
Case 7
10 1.93
10.2 2.17
10.4 2.22
10.6 1.86
10.8 1.66
11.0 1.51
Table 7: Standard proctor test results for different cases
Figure13, Comparative graph with different % emulsions
2.28
2.3
2.31
2.22
2.2 2.22 2.24 2.26 2.28 2.3 2.32
0 2 4 6 8 10
Comparitive graph
dry densities
% of bitumen emulsion Dry
California Bearing Ratio Test
The California bearing ratio test is penetration test meant for the evaluation of sub grade strength of roads and pavements. The results obtained by these tests are used with the empirical curves to determine the thickness of pavement and its component layers. This is the most widely used method for the design of flexible pavement. This test has been researched for the design and construction of flexible pavements. The basic thing of this test is that it is carried out taking after IS: 2720 (Part 16). The fundamental principle in CBR test is by causing a cylindrical plunger of 50mm diameter to penetrate into the specimen of soil or pavement component material at a rate of 1.25mm per minute. The following load values corresponding to penetration values of 0.0, 0.5, 1.0, 1.5, 2.0, 2.5, 3.0, 4.0, 5.0, 7.5, 10.0, 12.5 mm are noted in every 0.5mm of gaping.. A graph is drawn by plotting Penetration in mm in X axis and load expressed in kg with corresponding points in Y axis and prepared for different specimen.
The CBR value at 2.5 mm penetration must be higher compared to CBR value at 5.0 mm. If not in that case the test is to be repeated for checking. CBR ,it is the ratio between the test load sustained by the penetration at 2.5 or 5.0mm penetration to the load sustained by standard aggregates at the corresponding penetration level and it is expressed in percentage.
This test is done on two different conditions on previously four cases. So from this test total twelve number of CBR value is measured by moulding eight different specimens, two different type of specimen for each case.. In this comparative experimental study it is shown that how bitumen content and mixing procedure effect on CBR value of a particular soil. CBR value and the CBR graph are case wise shown below.
Case 1:
Mould size: standard volume 2250 cc
Case 1: Normal available tested soil is used for testing in this case Used proctor test result of Case 1.
Maximum Dry Density value: 2.01 gm./cc Optimum Moisture Content: 8.6%
CBR test is done in two conditions. First one is in un-soaked condition, secondly in four days of soaking condition in CBR value at 2.5mm penetration and 5mm penetration is calculated
Figure14 : case 1
100 300 500 700 900 1100 1300
0 10 20 30
case 1 ,at un soaked condition
case 1 ,at un soaked …
CBR2.5= 36.49 CBR5.0= 36.00
Figure 15: case 1
Case 2:
Mould size: standard volume 2250 cc
Case 1: Normal available tested soil is used for testing in this case Used proctor test result of Case 2.
Maximum Dry Density value: 2.09 gm./cc Optimum Moisture Content: 10.6%
CBR test is done in two conditions. First one is in un-soaked condition, secondly in four days of soaking condition in CBR value at 2.5mm penetration and 5mm penetration is calculated
Figure 16 :case 2
10 20 30 40 50 60 70 80 90 100
0 5 10 15 20 25 30
Case 1, soaked for 4 days
Case 1, soaked for 4 days
CBR2.5= 2.48 CBR5.0= 2.43
penetration(mm) load
100 300 500 700 900 1100 1300 1500
0 10 20 30
Case 2, unsaoked condition
Case 2 unsaoked …
CBR2.5= 45.25 CBR5.0= 45.06
Figure 17 :case 2
Case 3:
Mould size: standard volume 2250 cc
Case 1: Normal available tested soil is used for testing in this case Used proctor test result of Case 3.
Maximum Dry Density value: 2.16 gm./cc Optimum Moisture Content: 10.8%
CBR test is done in two conditions. First one is in un-soaked condition, secondly in four days of soaking condition in CBR value at 2.5mm penetration and 5mm penetration is calculated
Figure 18 :case 3
10 60 110 160 210
0 10 20 30
Case 2 , soaked for 4 days
Case 2 , soaked for 4 days
CBR2.5= 4.30 CBR5.0= 4.37
penetration(mm) load
100 300 500 700 900 1100 1300 1500
0 5 10 15 20 25 30
Case 3, unsoaked condition
Case
3, unsoaked …
CBR2.5= 46.72 CBR5.0= 46.91
Figure 19 :case 3
Case 4:
Mould size: standard volume 2250 cc
Case 1: Normal available tested soil is used for testing in this case Used proctor test result of Case 4.
Maximum Dry Density value: 2.3 gm./cc Optimum Moisture Content: 10.4%
CBR test is done in two conditions. First one is in un-soaked condition, secondly in four days of soaking condition in CBR value at 2.5mm penetration and 5mm penetration is calculated
Figure 20 : case 4
10 30 50 70 90 110 130 150 170 190
0 5 10 15 20 25 30
Case 3, soaked condition
Case 3, soaked condition
CBR2.5= 5.10 CBR5.0= 4.86
penetration(mm) load
100 300 500 700 900 1100 1300 1500 1700
0 5 10 15 20 25 30
Case 4, unsoaked
Case 4, unsoaked
CBR2.5= 56.93 CBR5.0= 56.44
Figure 21 : case 4
The soil sub grade is a layer of natural or selected soil from identified borrow pits fulfilling the specified requirements and well compacted in layers to the desired density to required thickness just below the pavement crust.This sub grade provides an appropriate foundation for the pavement and this is the reason behind to upgrade the strength of sub grade soil that may be done by replacing the weak soil with good soil or by stabilization of existing soil. For surveying the sub grade soil stability CBR test is very generally used test. Here all CBR results are plotted in a bar to scrutinize whether the improvement of CBR is done or not and if done then what would be that condition where CBR value become maximum. Following bar gives about a clear idea on this.
FIGURE 22 :CBR value comparison bar chart 10
60 110 160 210 260 310 360
0 5 10 15 20 25 30
Case 4, soaked condition
Case 4, soaked condition
CBR2.5= 8.97 CBR5.0= 8.90
penetration(mm) load
0 10 20 30 40 50 60
CBR2.5 CBR5.0 CBR2.5 CBR5.0 CBR2.5 CBR5.0 CBR2.5 CBR5.0
case 1 Case 2 Case 3 Case 4
unsoaked
V. CONCLUSION
So, from the following study it is comprehensible that there is a significant improvement in California Bearing Ratio (CBR) of sub-grade due to the usage of MS bitumen emulsion if proper mixing is done. Here it is also observed that it furnished best results under the condition that soil emulsion mix is left for about five and half hours after mixing. In every state of condition it was clearly found that CBR value has increased accordingly from Case 1 to Case 4. Therefore in this particular experimental study CBR value has increased up to fifty percent of the unmodified soil CBR. By considering its economic cost and quality of stabilization improvement, hence it is clear that this type of bitumen emulsion stabilization may be applicable in laterite soil road or in shoulder portion of highways.
REFERENCES
1. Alayaki, F. M., Bajomo, O. S. (2011), Effect of Moisture Variation on the StrengthCharacteristics of Laterite soil. Proceedings of the Environmental Management Conference, Federal University of Agriculture, Abeokuta, Nigeria.
2. Humbert, R. P. , "The Genesis of Laterite," Soil Science, 65, 281- 290, 1948.
3. Hodgkinson., A.T. Visser (2004), University of Pretoria and Concor Roads (Pty) Ltd, Therole of fillers and cementitious binders when recycling with foamed bitumen or bitumen emulsion.
4. Cokca.E.,Erol,O., Armangil. (2004), “Effects of compaction moisture content on the shearstrength of an unsaturated clay”, Geotechnical and Geological Engineering
5. Chauhan.(2010),” a laboratory study on effect of test conditions on subgrade strength”.UnpublishedB.Tech Thesis, N.I.T Rourkela.
6. Consoli, N. C., Prietto, P. D. M., Carroro, J. A. H., and Heineck, K. S.(2001). “Behavior ofcompacted soil-fly ash-carbide lime mixture.”J. Geotech. Geoenviron. Eng., 127(9), 774–782.
7. KemalovAF,KemalovRA. Practical aspects of Development of Universal Emulsifiers for Aqueous Bituminous Emulsions
8. D. Jones., A. Rahim., S. Saadeh., and J.T. Harvey (2012), Guide lines for the Stabilization ofSubgrade Soils In California, Guideline:
UCPRC-GL-2010-01Gregory Paul Makusa. (2012), Department of Civil, Environmental and Natural resourcesengineering, Luleå University of
Technology, Sweden.
9. Jaleel,Z.T.(2011), Effect of Soaking on the CBR-Value of Subbase Soil. Eng. and Tech.journal, vol.29.
10. Μouratidis A.(2004), Stabilization of pavements with fly-ash, Proceedings of the Conferenceon Use of industrial by-products in road construction, Thessaloniki, 47-57.
11. Nugroho,S.A., Hendri,A., Ningsih,S.R.(2012), Correlation between index properties andcalifornia bearing ratio test of pekanbaru soils with and without soaked. Canadian Journalon Environmental, Construction and Civil Engineering Vol. 3,Indonesia
12. Punmia B.C., Jain A.K, Jain A.K (2004), Soil Mechanics and Foundation, LaxmiPublications, New Delhi 16th edition.
13. Tomar and Mallick.(2011), “a study on variation of test conditions on CBR determination”Unpublished B.Tech Thesis, N.I.T Rourkela.
14. Tom V. Mathew, (2009), Entitled “Pavement materials: Soil Lecture notes in TransportationSystems Engineering”