ABSTRACT
VANN, LUCAS RICHARD. Near Infrared Spectroscopy (NIRS) as a Process Analytical Technology (PAT) Tool to Enable Golden Batch Performance Using a Novel MIDUS Control Automation Platform. (Under the direction of John Sheppard).
Developing a process with a quality by design approach must begin with the
appropriate identification of both Critical Quality Attributes (CQAs) and Critical Process
Parameters (CPPs). This holistic approach is required to realize maximum process
understanding and knowledge, increase potential for regulatory approval and equip
manufacturers to evaluate changes and implement change control procedures. Establishing a
robust control strategy during process development that can be scaled up and transferred to a
manufacturing process is crucial to ensure product quality throughout the product lifecycle.
Implementation of a strategy that can not only accurately monitor CPPs but also the
interdependencies between them is key to enable the advanced control required to ensure
consistent ideal or “golden” batch performance. This is specifically true in the case of large
molecules where there are thousands of metabolic pathways that can be altered based on
minute environmental changes that are often extremely synergistic in nature. To fully
develop a design space that characterizes acceptable performance, multivariate tools are
necessary. This is clear from a process development standpoint where DOE is routinely
utilized; however, there is a disconnect when transitioning to manufacturing where
monitoring and control is simplistic and primarily univariate. Multivariate tools such as
predictive models to create soft sensors are a requirement to maintain the level of
characterization of the process that enables advanced control. Currently the
from control systems (DCS, SCADA, PLC), advanced in-line monitoring from tools such as
near infrared spectroscopy (NIRS), at-line monitoring from sample analysis, offline data
from laboratory systems (LIMS) and multivariate (MVA) models to elucidate the
interdependencies of the various CPPs requires a platform that enables full integration that
has not been fully realized to date. The current research is aimed at overcoming these
challenges to bridge the gaps that currently exist in the industry.
The first study demonstrates the novel application of NIRS in a mammalian cell
culture process for feedback control of optimal harvest time in an influenza virus production
process. The second expands on the use of NIRS in a novel application for feedforward
control in beer fermentation. The final study culminates in demonstrating a novel platform,
MIDUS Control, that bridges the current automation gaps which exist in the industry thereby
© Copyright 2018 Lucas Richard Vann
Near Infrared Spectroscopy (NIRS) as a Process Analytical Technology (PAT) Tool to Enable Golden Batch Performance Using a Novel MIDUS Control
Automation Platform
by
Lucas Richard Vann
A dissertation submitted to the Graduate Faculty of North Carolina State University
in partial fulfillment of the requirements for the degree of
Doctor of Philosophy
Food Science
Raleigh, North Carolina
2018
APPROVED BY:
_______________________________ _______________________________
John Sheppard Tyre Lanier
Committee Chair
DEDICATION
This dissertation is dedicated to the love of my life, my best friend and companion through
BIOGRAPHY
Lucas Vann was born in Montreal Canada and is the second of 4 children of Rick and Donna
Vann. He received a Bachelors (2000) and Masters (2002) from McGill University in
Biosystems Engineering under the direction of Dr. John Sheppard. Lucas began working for
the Biomanufacturing Training and Education center at North Carolina State University in
2008. In 2009 he started to pursue a Ph.D, part time, in Bioprocessing in the Food Science
ACKNOWLEDGMENTS “
I can do all things through Christ who strengthens me” Philippians 4:13.
I am nothing without my Lord and Savior, Jesus Christ, with whom all things are possible
and I must first acknowledge His awesome grace and mercy.
I want to thank my beautiful wife (Ilse Zainos Vann) for her love, patience and support
during this time. I would be lost without you. Thanks to my family as well for all you have
done and continue to do for us.
I need to thank Dr. Sheppard not only for my Ph. D. but also for my job at NCSU and (a
“little” ways back in time) my Masters at McGill. You have played such a large role in who I
am professionally today and I thank you for your guidance as well as for your friendship that
I value highly.
Thanks to the Sheppard lab and especially Blake Layfield and John Durham (honorary
labmate). You guys helped me get through some tough times and I will always consider you
brothers.
I would lastly like to acknowledge all my professors and also my coworkers at BTEC who
have helped me grow and learn both professionally and personally. NCSU is an awesome
TABLE OF CONTENTS
LIST OF TABLES ... ix
LIST OF FIGURES... x
LIST OF ABBREVIATIONS ... xvii
CHAPTER 1: LITERATURE REVIEW. Historical Overview of Biomanufacturing and the Regulatory Evolution that has Resulted in the Current State of Process Understanding and Control ... 1
Introduction ... 2
Quality by design (QbD) ... 7
Process Analytical Technology (PAT) ... 9
Multivariate Analysis ... 10
Analytical Tools for Monitoring and Control ... 11
Optical / Spectroscopic Sensors ... 13
Raman Spectroscopy ... 13
Near Infrared Spectroscopy (NIRS) ... 14
Chemometrics ... 15
Chemometric Model Building Methodology... 17
Current Industry Limitations ... 21
Novel Approach ... 23
MANUSCRIPT 1. Evaluation of Near-Infrared Spectroscopy (NIRS) for On-line Determination of Virus Titers in Cell Culture Influenza Vaccine Manufacturing ... 25
Abstract ... 26
Introduction ... 27
Process Development and Optimization Strategies ... 30
Use of NIR for Monitoring Cell Metabolism and Virus Production ... 32
Chemometrics ... 32
Materials and Methods ... 34
Near Infrared Spectroscopy (NIRS) ... 35
Hemagglutination (HA) Assay ... 36
Chemometrics ... 37
Hemagglutination (HA) Assay Development ... 38
2 L Bioreactor Runs and Virus Model Validation ... 39
Results and Discussion ... 40
Shake Flask Study and Chemometric Modeling ... 40
Hemagglutination HA Reference Method and Model development... 48
2 L Bioreactor Validation Batch ... 51
Conclusions... 53
MANUSCRIPT 2. The Application of Near-Infrared Spectroscopy (NIRS) in Beer Fermentation for On-line Monitoring of Critical Process Parameters and their Integration into a Novel Feedforward Control Strategy... 54
Abstract ... 55
Introduction ... 56
Materials and Methods ... 64
Yeast Strains ... 64
Wort Production ... 65
Propagation and IPA Pilot-Scale Fermentation ... 66
FAN Analysis... 67
IPA Calibration Batches for NIR Models ... 67
IPA 300 L Validation Batch ... 68
Blonde Ale 300 L Validation Batch ... 69
IPA Bench Scale Batches for Repitching ... 70
Near Infrared Spectroscopy Fermentation Analysis ... 71
Chemometrics ... 72
Results and Discussion ... 73
Model Building ... 73
Blonde Ale Validation Batch ... 85
Feed Forward Control Strategy ... 86
Conclusions ... 92
MANUSCRIPT 3. Use of Near-Infrared Spectroscopy (NIRs) in the Biopharmaceutical Industry for Real-Time Determination of Critical Process Parameters and Integration of Advanced Feedback Control Strategies using MIDUS Control ... 94
Abstract ... 95
Introduction ... 96
Monitoring ... 98
Data Analysis and Integration ... 100
Advanced Control Implementation ... 102
Materials and Methods ... 105
Scale-down 2 L Bioreactor Study ... 105
Batch Monitoring ... 106
Data Analytics ... 107
Scale-up to 300 L Manufacturing batches ... 109
Spectroscopy ... 110
Chemometrics ... 110
Additional 30 L Batch Runs ... 111
Advanced Control Strategy Designer ... 113
Results and Discussion ... 114
Scale-down 2 L Bioreactor Study ... 116
Scale-up to 300 L for NIR Model Building ... 120
B Vitamin Analysis ... 124
Advanced Control Strategy... 127
Conclusions ... 133
SUMMARY AND CONCLUSIONS ... 136
APPENDICES ... 149 Appendix A. Record of Invention 1: Cell Separator and Repitcher... 140
LIST OF TABLES
MANUSCRIPT 2 ... 54 Table 1. Four consecutive re-pitches used to determine limits on
performance parameters based on process capability ... 89
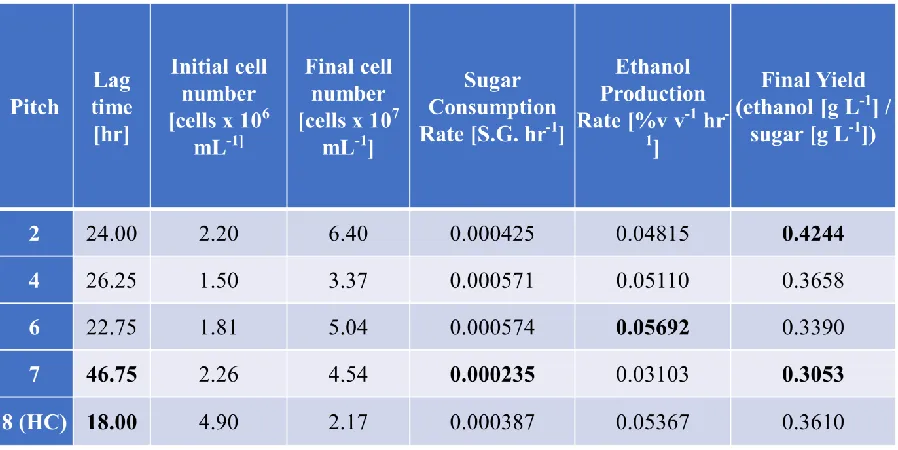
Table 2. Data from selected batches of 7 consecutive re-pitches indicating a reduction in population performance in pitch 7 and the result of an
increased pitch rate in batch 8. Data entries in bold signify values
LIST OF FIGURES
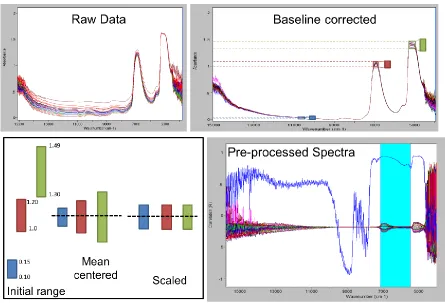
MANUSCRIPT 1 ... 25 Figure 1. Common pre-processing and data transformation techniques used
for spectra prior to building models. The raw spectra are shown on
the top left that have been base-line corrected on the top right to
eliminate drift. Data must be mean centered and scaled as shown
on the bottom left which results in the spectra as seen on the
bottom right ... 41
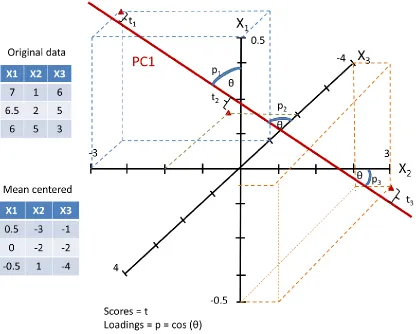
Figure 2. A simplified graphical example showing one principle component axis (PC1) derived from three variables X1, X2 and X3. The data
points are mean centered and scaled prior to plotting and the best
fit plane (PC1) is drawn. Scores (t) are related to the projection of
each point onto the plane and loadings (p) refer to how closely
related the original axis was to the new plane ... 43
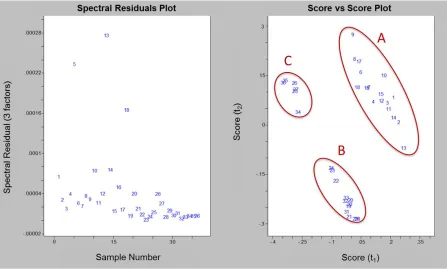
Figure 3. Two plots used to evaluate a principle component analysis model. The left plot shows the amount of residuals of the spectra produced
from the model compared to the original spectra when 3 factors or
principle components are used. The right plot shows the comparison
of scores for the first and second principle components which are
orthogonal to each other ... 44
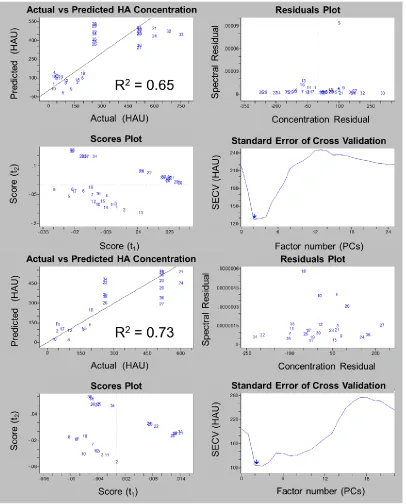
Figure 4. Common evaluation plots from 2 Partial Least Square (PLS) prediction models. The top 4 plots are an initial model and the
bottom a refined model. Cross validation is used to evaluate
prediction accuracy while residuals look at which samples are not
well described on a spectral level. The scores plots are beneficial at
evaluating outliers or clusters and the standard error helps to
identify the required number of principle components required to
Figure 5. Cross validated results (one sample out at a time) for Glucose (R2 = 0.97), Lactate (R2 = 0.99), Ammonia (R2 = 0.98),
Glutamine (R2 = 0.99) and Total Cell Count (R2 = 0.98). Results
indicate that near infrared spectroscopy is well suited for these
cell culture applications ... 47
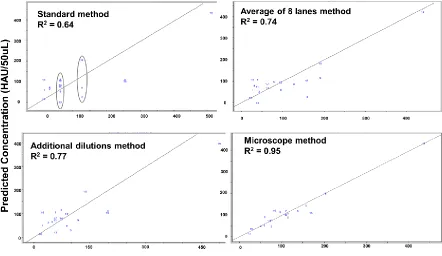
Figure 6. Four variations of the same PLS model. In each case a different reference method was used to generate the actual concentrations.
The standard method (top left) shows spectral variation in samples
with the same actual concentration result. Averaging multiples
assays (top right) or performing additional dilutions (bottom left)
show improvement however, the best results are shown using a
novel microscope method (bottom right) ... 49
Figure 7. Representation of the standard Hemagglutination Assay (HA) used to determine hemoglutanin concentration. The measurements (in
millimeters) were performed using a microscope. The standard
assay result yields a value of 32 however, it is evident additional
virus is present which was calculated based on the resulting area of
the intermediate blood spot formed ... 50
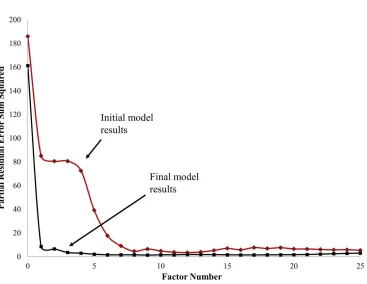
Figure 8. The final model evaluation results indicating 3 factors or Principle components are required to describe most of the variation.
Concentration and spectral residuals were reduced by a factor of 5
and 10 respectively and the R2 increased from 0.64 to 0.95 ... 51
Figure 9. Validation batch results. The left plot shows the evolution of HA concentration over time in real-time (solid line) including the off-
line assay results (●) from samples taken during the run. The right
plot indicates the prediction residuals of each scan for determination
MANUSCRIPT 2 ... 54 Figure 1. Principle Component Analysis score plot of scans taken from 3
IPA calibration batches to determine relative factor weighting. All
3 batches predominantly reside in the same general area as indicated
by the elliptical outline. Arrows indicate 7 potential outliers solely
based on spectral variation which help identify samples that may
introduce calibration model error ... 74
Figure 2. Partial Residual Error Sum Squared (PRESS) plots of initial (♦) and final (■) calibration models for ethanol ... 75
Figure 3. Actual vs predicted concentration plots for each constituent
calibration model indicating best fit line and R2 values. Free Amino
Nitrogen (●), Total Cell Count (▲), Specific Gravity (♦), and
Ethanol (■) ... 76
Figure 4. Residual concentration plots for each constituent to determine bias for low or high concentrations based on the absence of inherent
trends. Free Amino Nitrogen (●), Total Cell Count (▲), Specific Gravity (♦), and Ethanol (■). All samples are ordered from low to
high "actual" concentration with the x axis indicating sample
number. Only Total Cell count displays an upward trend indicating
a concentration bias ... 77
Figure 5. Predicted on-line NIR data for Specific Gravity (♦) and ethanol (■) as well as off-line measurements of Specific Gravity (●) and ethanol
(▲) concentrations in a 300 L IPA fermentation batch. The arrow
indicates the time point at which glucose was totally depleted and
the yeast began to metabolize maltose as the main carbon source ... 79
Figure 6. Sugar profiles determined using HPLC over the fermentation of a 300L pilot scale batch of IPA. Maltose (♦), Glucose (■) and
Figure 7. Prediction residual plots for Specific Gravity (♦) and Ethanol (■). Residuals were determined based on segmented linear regressions
of prediction plots and used as an indicator of variability in
prediction ... 81
Figure 8. On-line NIR predictions (●) and off-line spectrophotometric
measurements (■) of FAN levels in a 300 L IPA batch ... 82
Figure 9. On-line NIR predictions (▲) and off-line automated cell counter measurements (■) of TCC concentrations in a 300 L IPA
fermentation batch ... 83
Figure 10. Predicted on-line NIR data for Specific Gravity (♦) and ethanol (■) as well as off-line measurements of Specific Gravity (●) and ethanol
(▲) concentrations in a 300 L Blonde Ale fermentation batch using
models generated from IPA calibration batches... 86
Figure 11. On-line NIR predictions (●) and off-line spectrophotometric measurements (■) of FAN in a 300 L Blonde Ale fermentation
batch using models generated from IPA calibration batches ... 86
Figure 12. Four consecutive re-pitches used to determine process specification limits based on inherent batch variability. Pitch 1 (■), pitch 2 (♦),
pitch 3 (●) and pitch 4 (▲) ... 88
Figure 13. SG (top) and ethanol (bottom) data for 5 batches identified as pitch 2 (♦), pitch 4 (■), pitch 6 (▲), pitch 7 (●) and pitch 8 (×) and taken
from 8 consecutive batches (7 re-pitches). The plots indicate
reduced population performance in pitch 7 which is corrected by an
increased pitch rate in the subsequent batch ... 90
MANUSCRIPT 3 ... 94 Figure 1. The relationship between Critical Process Parameters (CPPs) and
Critical Quality Attributes (CQAs). Cell environment (CPPs)
critical parameters that can be controlled within the bioreactor
(CCPs) therefore have a direct impact on cell performance as
measured by KPAs which are directly linked to final product
quality. The lists shown for each group is not comprehensive but
serves as an example of possibilities ... 97
Figure 2. Examples of in-line, on-line, at-line and off-line monitoring. These are variable data types that are often stored in different locations
making integration a common challenge. Standard parameter
control and data storage can accomplished using Distributed
Control Systems (DCS), Supervisory Control and Data Acquisition
(SCADA) systems as well as simple Programmable Logic
Controllers (PLC) ... 100
Figure 3. Trends of “good” (left) and “bad” (right) batches. Failed batches were identified based on an abnormal reduction in growth rate near
the end of the batch and that the main carbon source (glucose) was
not totally consumed during the total batch time of 6 hours ... 115
Figure 4. Amino acid percent weight comparison between two lots of yeast extract (YE) from the same supplier and manufacturer. The old lot
with acceptable performance is represented by solid bars and the
new lot with poor performance by light textured bars ... 116
Figure 5. Averaged glucose (decreasing trend lines) and optical density (increasing trend lines) data for 3 batches at each media condition.
Yeast Extract new lot at 12 gL-1 (♦), YE new lot at 16 gL-1(●) and YE old lot at 12 gL-1 (▲). Error bars are plus and minus one
standard deviation ... 117
Figure 6. Scores plot of data points from all 9 batches. The black ellipse to the bottom left represents all points from batches with the original
Figure 7. The three main contributors to variation between good and bad batches (isolated from all the sources shown in the embedded top
left plot) based on a PLS Batch Level Model (BLM) relating in-
line, at-line and off-line data to Key Performance Attributes (KPA).
Shown is the time range of 4 to 6 hours where the metabolic shift
occurred, alanine (♦), agitation (●) and methionine (▲) ... 119
Figure 8. NIR model calibrations for 3 constituents, alanine (top left), methionine (top right) and glucose (bottom left). All cross
validated (one sample out at a time) R2 values were above 0.95
which indicates a relatively good fit for each model. The final plot
(bottom right) shows the reduction in error as additional factors are
added to the glucose model with a final recommendation of 5
factors based on the predicted residual error sum squared (PRESS)
values ... 121
Figure 9. 300 L validation batch data with NIR scans (average of 128 scans taken every 15 minutes) for the following models: glucose (♦),
methionine (×) and alanine (+) as well as at-line YSI measurements
for glucose (▪) and offline UPLC measurements for methionine (▲) and alanine (●) determined from manual samples taken at periodic
intervals ... 123
Figure 10. Comparison of various B vitamin concentrations, determined by HPLC, in 2 lots of yeast extract at 12 g L-1. The solid bars represent
the old lot with acceptable performance and the textured bars
represent the new lot with poor performance. (Pantothenic values
are shown divided by a factor of 10 for scaling purposes) ... 125
Figure 11. Top: Glucose (decreasing trend lines) and optical density (increasing trend lines) data for three 30 L batches at identical
4.75 hours (▲). The bottom plot shows the real time agitation
speed for each batch, 12 gL-1 YE (bottom trend line) 12 gL-1 with addition of B vitamins at 4.75 hours (middle trend line) and 16 gL-1 YE (top trend line). Agitation was in cascade control and
automatically changed based on oxygen demands of the culture
(increased respiration rate requires higher agitation speeds) ... 126
Figure 12. Unique strategy designer for advanced process control that initiates at the start of every batch. Three control workflows are shown
including a univariate model monitoring abnormal depletion rate
of alanine (1), a set of rules implemented using a case block (taken
from the menu on the bottom left and easily configured as shown
on the bottom right) that when satisfied trigger induction (2), and a
complex control strategy that predicts a filter clog will occur using
a multivariate model and closes the loop to effect changes to save
the filter and the batch (3) ... 129
Figure 13. Trend data of a run that exhibited a filter clog resulting in over pressurization causing a lost batch. Bioreactor pressure is shown in
red with the pressure set-point in orange. The light blue is the
backpressure control output and dark blue is the airflow rate ... 131
Figure 14. Continuous process verification (CPV) control charts from an E. coli fermentation of a Univariate Analysis of pressure
differential between set-point and current value (top) and a soft
sensor multivariate analysis PCA model characterizing
backpressure control (bottom). Pressure deviates outside of
specification limits (± 3 sigma) at 9.1 hours while the multivariate
model exceeds warning limits (2 sigma) at 5.7 hours and exceeds
specification limits (3 sigma) at 5.8 hours essentially predicting
Figure 15. Schematic of the novel Monitoring, Integration, Data analysis, Understanding, Strategy & Control (MIDUS Control) platform
LIST OF ABBREVIATIONS
A&C: Analytics & Control
ABE: Acetone, Butanol, and Ethanol
AEP: Average Error of Predictions
APC: Advanced Process Control
AVP: Average Variability in Prediction
BEM: Batch Evolution Model
BLM: Batch Level Model
CCPs: Critical Control Parameters
CIP: Clean-In-Place
Cp: Process Capability
CPPs: Critical Process Parameters
CPV: Continuous Process Verification
CQAs: Critical Quality Attributes
CUs: Concentration Units
CV: Coefficient of Variation
DCS: Distributed Control Systems
DNA: Deoxyribonucleic Acid
DO: Dissolved Oxygen
DOE: Design of Experiment
EPR: Ethanol Production Rate
FAN: Free Amino Nitrogen
FDA: Food and Drug Administration
FT-NIR: Fourier Transforms- Near Infrared
GFP: Green Fluorescent Protein
HA: Hemagglutination Assay
HPLC: High-performance liquid chromatography
HWE: Hot Water Extract
ICH: International Conference on Harmonization
IPA: Indian Pale Ale
IPTG: Isopropyl β-D-1-thiogalactopyranosid
IR: Infrared
KPAs: Key Performance Attributes
LIMS: Laboratory Information Management System
LSL: Lower Specification Limit
LT: Lag Time
MDCK: Madin-Darby Canine Kidney
MIDUS: Monitoring, Integration, Data analytics, Understanding, Strategy design
MIR: Mid-Infrared
MOI: Multiplicity of Infection
MSC: Multiplicative Scatter Correction
MVA: Multi Variate Analysis
MVDA: Multivariate Data Analysis
NA: Neuraminidase
NIRS: Near Infrared Spectroscopy
OPA: O-phthaldialdehyde
OPC: Object Linking and Embedding for Process Control
PAT: Process Analytical Technology
PBS: Phosphate Buffer Solution
PC: Principle Component
PCA: Principle Component Analysis
PDA: Photo Diode Array
PID: Proportional, Integral, Derivative
PLC: Programmable Logic Controllers
PLS: Partial Least Squares
QbD: Quality by Design
QTPP: Quality Target Product Profile
RI: Refractive Index
SCADA: Supervisory Control and Data Acquisition
SCR: Sugar Consumption Rate
SECV: Standard Error of Cross Validation
SG: Specific Gravity
SIP: Steam In Place
SNV: Standard Normal Variate
SPC: Statistical Process Control
TC: Total Carbohydrates
TCC: Total Cell Count
TCID 50:Tissue Culture Infectious Dose 50%
UPLC:Ultra performance liquid chromatography
USL: Upper Specification Limit
UVA FD: Univariate Analysis Fault Detection
WHO: World Health Organization
CHAPTER 1. LITERATURE REVIEW
INTRODUCTION
Biomanufacturing in its simplest definition refers to the use of a living organism to
manufacture a product. It arguably has the potential to be a defining technology of this
century. The field of Biomanufacturing is vast and interdisciplinary incorporating
biotechnology, bioengineering, biochemistry and microbiology, among others, in the
production of various products from fermented foods such as yogurt and beer to therapeutic
proteins such as monoclonal antibodies. There are numerous other examples which include
vaccines, amino acids, industrial enzymes, biochemicals and biofuels to name a few. Based
on the products mentioned it is clear that Biomanufacturing is both a very old as well as a
very new science with advances being made continually. Regulations, based primarily on
patient safety, have evolved alongside Biomanufacturing in a unique fashion. At first this
occurred primarily in response to major tragedies; however the focus has changed over the
past 15 years due to the observation that the very regulations that were in place to increase
safety were also deterring innovation, process understanding and advancements in
automation and control. This realization led to the introduction of Quality by Design (QbD)
and Process Analytical Technology (PAT) guidelines which encouraged manufacturers to
incorporate additional analyzers that would lead to increased understanding of their process.
Demonstration of this understanding to the FDA would then allow for flexibility in
manufacturing to effect more advanced control and achieve increased consistency and
quality. While the concept is sound the implementation has been limited and a major gap
still exists in the integration of advanced process control (APC) in biomanufacturing.
manner due to advanced control challenges. The following chapters will outline 3 novel
applications of APC utilizing near infrared spectroscopy (NIRS) as a PAT tool integrated in a
systems based approach. The results show the versatility and effectiveness of NIR
spectroscopy combined with other PAT tools such as multivariate models and soft sensor
technology in a platform approach that can be used as a template for manufacturers on a
global scale. The platform developed and shown here enables manufactures to achieve more
consistent ideal batch or, so called, “golden-batch” results and can only be described as
MIDUS Control.
While the term “biomanufacturing” may not have been used thousands of years ago,
even by today’s definition it was being employed. Production relied on microorgamnisms
(primarily bacteria and yeast) that were naturally found on, or were associated with, the raw
materials involved in the process. These organisms were used to make products for human
consumption such as bread, beer (documented Egyptian evidence as early as 2300 BC), wine,
cheese, pickles, yogurt, kimchee and soy sauce in what we now refer to as fermentation
processes. The first significant mention of bio-therapeutic production was in China around
500 BC where boils were reportedly treated with antibiotics from moldy soybean curds.
However, it was not until the 1900s that the microbial industrial revolution began for the
production of primary metabolites such as ethanol, butanol and acetone. In fact, Clostridial
fermentation of carbohydrates to acetone, butanol, and ethanol (ABE) was one of the first
large-scale biotechnological processes developed during the early part of the 20th century, ranking second in importance only to ethanol fermentation by yeast [1]. After World War I,
dramatic increase in car production and a subsequent increase in demand for a solvent that
would produce quick drying lacquers. Previously amyl-acetate had served this purpose which
was a by-product of alcoholic fermentation by yeast. However, Prohibition came into effect
in 1920, which meant this solvent was no longer available and automakers had to turn to
butyl acetate from butanol fermentation. Up to 1950, 66% of butanol used worldwide was
derived through fermentation and plants were located around the world in the USA, Canada,
South Africa, China, and the Soviet Union [2]. Biotechnological production of ethanol,
acetone and butanol gave way to synthetic chemical processes beginning in the 1950s due to
two main factors. Primarily, the petrochemical industry grew at an unprecedented rate,
quickly satisfying the demand for these solvents and forcing the decline of the fermentation
industry. Secondly, the low cost of crude oil for chemical synthesis compared with the
escalation in price of substrates for the fermentation process meant the fermentation process
was no longer economically feasible [3]. Renewed interest in alternative methods of
obtaining fuels through microbial conversion occurred in the 1970s due to the abrupt increase
in petroleum prices. This led to intensified research into the fermentative production of
biofuels directed at improving overall process yields and productivity which is still ongoing.
Biomanufaturing from a therapeudic or medicinal perspective began around 1940
where Howard Florey, Ernst Chain and Norman Heatly began studying penicillin, which had
been discovered by Alexander Fleming in 1928 when he observed that a blue green mold had
caused bacterial growth to diminish on a contaminated petri dish [4]. Penicillin’s lack of
toxcicity as well as efficacy to treat bacterial infections opened the door to a new type of
project which forced the researchers to pursue alternative avenues with American companies
[5]. Antibiotics are usually produced once the cells have exhausted primary nutrients and
have entered into a stationary phase of growth and are therefore referred to as secondary
metabolites. Attempts at increasing production of such compounds began with selection and
employment of mutant strains with high yields. Numerous techniques aimed at discovering
“superproducers” were employed up to and through the 1970s with the most common,
primarily due to low cost, being the use of well-defined chemical media to isolate mutants
grown in smaller colonies [5]. These activities produced strains which were unstable and
prone to further mutation and further improvement was desired. The key to solving this
dilemma lay with molecular biology and genetic engineering. The advent of recombinant
DNA technology in 1973 by S. Cohen and H. Boyer enabled researchers to make controlled
modifications of a microorganism’s genomes to create new higher antibiotic producing
strains as well as strains capable of producing completely foreign proteins. Insulin, which
prior to recombinant DNA technology had to be purified from animals and/or cadavers, was
the first such human recombinant protein to be produced in 1978. However, it was not until
1982 that it was approved by the FDA as the first biotech drug produced in genetically
modified bacteria. In 1986 the first anticancer drug, interferon, was produced through
biomanufacturing as was the first recombinant vaccine for humans targeting hepatitis B [6].
To date, methods in this field have continued to advance and recombinant DNA
techniques are common practice for host development and improvement in most
biopharmaceutical companies. However, as with any manufacturing process, quality and
consumer. It must be made clear that safety of the end consumer is the primary objective and
all efforts to increase quality and consistency are to ensure that main purpose. Specifically,
this is critical in the case of manufacturing biopharmaceuticals which are often injected and
can have dire and life threatening consequences if standards are not met. Regulation of the
manufacture of these drugs became increasingly crucial as a result of, and in response to,
poor and unsafe practices. One well known example occurred in 1902 when the Biologics
control act was instituted after several deaths were caused when patients received diphtheria
vaccines that had been contaminated with tetanus. However, the evolution of these
regulations caused several undesirable consequences as well [7].
By the year 2000 drug regulations seemed effective in ensuring that product quality
was sufficient. However, companies were extremely hesitant to implement new technologies
because of past regulatory hurdles and the uncertain response of regulators and how they
would perceive such innovations. The traditional manufacturing approach was based on end
product testing and adherence to defined process specifications to deliver acceptable product
quality. Emphasis was placed on empirical data for validation as well as manufacturing and
there was little understanding as to the cause of deviations or failures. As such, there was a
high amount of product waste (reported to be as much as 50%), poor control, inability to
predict scale-up effects and low manufacturing efficiencies [7]. In response to these issues
the FDA launched a new initiative in 2002 to modernize the biomanufacturing industry
Quality by Design (QbD)
Quality by Design is a risk- and science-based approach to process development and
manufacturing that ensures quality through a clear understanding of all components and key
process parameters and their effect on final product quality. Since the FDA’s first Risk Based
Approach publication in 2002 there have been 4 major parts to the QbD initiative. 1) the
International Council on Harmonization (ICH) guidance Q8(R2): Pharmaceutical
Development, 2) ICH guidance Q9: Quality risk management, 3) ICH guidance Q10:
Pharmaceutical Quality System, and 4) an FDA guidance on Process Analytical Technology
(PAT) [8], [9]. While the main objectives of these guidances are clear, interpretation of these
initiatives by industry has been an ongoing process. The main overall objective is to develop
a process that consistently maintains the quality attributes of the product such as “identity,
strength, purity, and other quality characteristics designed to ensure the required levels of
safety and effectiveness” (ICH Q8). To accomplish this there are a number of actions that
must be taken. The first is to accurately define quality specifications that are performance
based. This can be termed as defining the product design goal where the quality target
product profile (QTPP) is determined. The QTPP provides an understanding of what will
ensure the quality, safety, and efficacy of a specific product [10]. Once a clear definition of
quality is understood the next step involves determining critical quality attributes (CQAs) for
the product. A CQA is defined in ICH Q8(R2) as “ A physical, chemical, biological, or
microbiological property or characteristic that should be within an appropriate limit, range, or
distribution to ensure the desired product quality”. Examples may include moisture content,
provides the framework for true process understanding and is crucial in enhancing root cause
analysis and post approval change management. The ability to determine which attributes
are in fact critical lies with effective risk assessment. There are a number of risk assessment
tools that can be utilized and are described in ICH Q9 which include the following: Basic risk
management facilitation methods (flowcharts, check sheets, etc.), Fault tree analysis, Risk
ranking and filtering, Preliminary hazard analysis, Hazard analysis and critical control points,
Failure mode effects analysis, Failure mode, effects, and criticality analysis and Hazard
operability analysis [10]. Therefore the attribute is determined to be critical based on the
probability of occurrence and the potential severity to the patient if the attribute were to
deviate outside specified ranges. It is important to note however that while detectability does
not in itself impact the criticality of an attribute it does have an impact on overall risk. One
such example is a tool described by Martin-Moe et al, 2011[9] that was developed for risk
ranking where a criticality score can be determined for each attribute. The degree of impact
to safety or efficacy is multiplied by the degree of confidence that the impact is known
(criticality = impact x uncertainty) which results in scores ranging from 2 (low risk) and 140
(high risk).
Once the CQAs have been identified the next step is to discover the process design
space. This step demonstrates that there is a clear understanding of the process by identifying
critical process parameters (CPPs) and linking them to CQAs. ICH Q8(R2) defines design
space as the multidimensional combination and interaction of input variables and process
parameters that have been demonstrated to provide assurance of quality. Therefore CPPs are
of the product. This is effected through the application of design of experiment (DOE)
activities to ensure all synergistic interactions are captured and optimal operating conditions
can be determined. A well-defined design space examines all possible iterations of parameter
variations and their resulting impact on quality attributes and provides the framework for
effective process control. Therefore a control space, which is a subsection of the design
space, can be determined based on the manufacture’s desired operation range. In essence,
while the CQAs are directly related to the product, they are in fact dependent on how the
product is manufactured. As such, if the CPPs are correctly identified and controlled, the
ideal CQAs will be achieved [11]. This is best accomplished through process analytical
technology (PAT).
Process Analytical Technology (PAT)
PAT is defined by the FDA as “a system for designing, analyzing, and controlling
manufacturing through timely measurements (i.e., during processing) of critical quality and
performance attributes of raw and in-process materials and processes, with the goal of
ensuring final product quality”. PAT effects control of CPPs that affect CQAs and is the
framework for enhancing process understanding and providing process robustness. The
ability to monitor these critical parameters fosters increased understanding and allows for
more efficient control and the ability to deliver acceptable quality products in the midst of
variable process parameters and raw materials which in turn has the effect of increasing
process robustness. It is important to realize the significance of the terminology used in the
based approach to increased understanding. An individual can purchase the latest tools to
repair a car engine but if that person does not know how an engine operates there is no hope
that those tools will be used effectively. True process understanding occurs when all critical
sources of variability are identified and explained and that variability is then managed by the
process. Understanding implies that product quality attributes can be predicted by monitoring
all relevant process parameters. In effect, a well-integrated PAT system enables quality to be
built into the process instead of the traditional methods of testing quality into the product.
When it comes to application of PAT there are three key components including multivariate
analysis, analytical tools for monitoring and control and finally, knowledge management and
continuous optimization tools [12].
Multivariate Analysis
Biomanufacturing processes are extremely complex and present a unique set of
challenges. These are predominantly cell-based systems that are extremely sensitive to
minute environmental variations. A cell population establishes a complex dynamic
relationship with its environment where changes in this environment can have both positive
and negative metabolic consequences. The immediate environment surrounding a cell
includes parameters such as temperature, pH, dissolved oxygen, nutrients (which often
include variable complex raw materials), products and by-products. In addition,
contamination and impurities are always a concern especially when present at levels that fall
below detection limits. As such, collecting real-time data of all critical variables during
batches creates an even larger challenge which requires multivariate statistical analysis.
Multivariate data analysis (MVDA) relates raw information from process variables (which
can include PAT analyzers) to CQAs which generates understanding and allows for effective
process control. Predictive mathematical models are determined that describe relationships
between CPPs and CQAs using various software tools which allow users to employ
multivariate techniques and integrate empirical models (without expert knowledge) and / or
mechanistic models (requiring expert knowledge) [8], [11], [13]. This type of analysis relies
on the availability of accurate and reliable analytical results in the required time frame to
make necessary changes that ensure quality.
Analytical Tools for Monitoring and Control
Effective process control depends on timely, accurate, selective, sensitive, and
reliable measurements of all critical process parameters. Reliability refers to attributes such
as repeatability (consistently deliver similar results), robustness (consistent results
irrespective of process conditions) and stability (retaining selectiveness and sensitivity over
time). Accuracy relates to the degree of difference between the true and measured value
while selectivity describes the ability to measure one variable in the midst of numerous
others. Sensitivity refers to the detection or quantification level of the sensor. Without such
measurement there is no method for the precise feedback control required for efficient
processing. Measurements must be taken in real-time and be stable and reproducible so to be
able to ensure high-quality products. Real-time measurements can be accomplished in two
1) On-line: A sample stream is diverted from the process for measurement and
subsequently returned to the process or discarded to waste.
2) In-line: A measurement where there is no need for a sample to be removed from the
process such as with a probe incorporated into the system.
The two other types of measurements are:
1) At-line: A sample is removed (in an automated or manual fashion) and analyzed in
close proximity to the process which can make it effective for process control
decisions and is often considered “almost” real-time.
2) Off-line: A sample is taken (in an automated or manual fashion) and is sent off to a
lab for analysis. Results are often obtained days after the sample is taken and
therefore can not be used for process control purposes.
While there are basic parameters which are routinely monitored by in-lineprobes such as
temperature, pH, cell density and dissolved oxygen there are a very high number of
parameters that are currently monitored by time consuming off-line analysis which is not
suitable for effective process control. Bioreactor applications pose additional challenges in
that sensors must be able to withstand sterilization temperatures and harsh cleaning
chemicals. These Bioprocesses are also three phase systems where cells are dispersed as a
solid phase in a liquid medium phase being aerated by a gas phase. These complex
hydrodynamics create increased difficulty in reliable monitoring especially if the vessel is not
homogenous. For a probe to be functional it must also be non-invasive and have no
of sensors available, only optical and spectroscopic meet the aforementioned criteria and can
be used in the liquid phase for biomanufacturing applications. These sensors are unique in
that they offer the possibility of measuring various analytes simultaneously and actual
sampling is only required for initial calibration and model building purposes. The most
popular and relied upon technique is Near-Infrared Spectroscopy (NIRS) which will be
focused upon in this dissertation however Raman will also be discussed since it is also a
highly used tool for in-line applications. Infrared (IR), Mid-Infrared (MIR), UV/Vis, and
Fluoresence spectroscopy will not be covered due to their saturation properties resulting in
limitations to be used real time as a true in-line PAT tool [13].
Optical / Spectroscopic Sensors
Spectroscopic analyzers are based on the interaction and subsequent absorbance or
scattering of varying frequencies of light energy by specific molecular bond vibrations.
Chemometric data analysis is required to extract relevant information from complex
overlapping spectral scans and will be covered in more detail in reference to NIRS.
Raman Spectroscopy
Raman spectroscopy deals with the ability to detect molecule vibrations based on
light scattering. In general, Raman has historically been used less than NIRS due to sample
degradation and fluorescence problems. However, with recent advances in instrument
technology these issues have diminished. The underlying principle is that photon energy will
related to the molecule of interest based on the angle of incidence. Only one in every 106-108 photons will be related to Raman scattering and as such the signal is extremely weak. This
causes the requirement for very long exposure times of photon energy to the sample (up to 15
minutes) which makes application to fast growing cultures somewhat limited. Conversely,
NIRS requires scan times of less than a minute to obtain the required information which is
another reason why it dominates with in-line applications [14], [15].
Near Infrared Spectroscopy (NIRS)
Near Infrared Spectroscopy (NIRS) deals with wave numbers between 12000 - 4000
cm-1and operates based on the principle that the atoms of molecules are in constant motion and vibrate at specific frequencies. The type and frequency of each vibration is molecule
specific and directly dependent upon the mass of each atom in the molecule and the strength
of the chemical bond between atoms. Light frequencies that correspond to molecular
vibrations are absorbed by the sample and the resulting infrared spectrum comprises peaks of
well-defined frequencies, band shapes and heights that correlate to molecule concentrations
present in the sample. The technology has increasingly been used, over the past decade, in
the pharmaceutical industry where it has served to monitor solid dosage forms [16] as well as
process variables involved in monitoring drying, granulating, powder blending and online
conformity testing [17]–[19]. More recently research has focused on implementing NIR
spectroscopy in the fermentation and cell culture stages of bioprocesses for
biopharmaceutical process optimization and control. The most significant NIR in situ
rates as are found with bacterial, aerobic yeast and fungal bioprocesses. In these cases, most
often NIRS is incorporated at-line as a rapid detection method for specific substrates or
products. Mammalian cell culture provides a relatively simple spectroscopic challenge as
agitation and aeration rates are generally low and media is usually homogeneous, non viscous
and Newtonian. A great deal of work has been done at-line which does not offer the optimal
level of control, however, use of in situ probes has also been studied. Riley M. and
colleagues [20] have used at-line NIRS to monitor pyruvate and 14 other amino acids,
quantifying in total 19 cellular nutrients and waste products in culture medium with
concentrations as low as 0.3mM. The most common key analytes that have been monitored
in situ using NIRS are glucose, glutamine, glutamate, lactate and ammonia. However, pH ,
viable cells and recombinant proteins have also been monitored [21]. The ability to monitor
constituents using NIR spectroscopy hinges on the advanced mathematical modeling,
referred to as chemometrics, that must be done to develop calibration models relating spectral
properties to quantitative results.
Chemometrics
Chemometrics refers to the discipline that applies multivariate empirical models to
data in order to extract meaningful results. The term was coined by a Swedish scientist,
Svante Wold, in 1971 where he used it to describe the application of mathematical and
statistical methods to analytical chemical measurements [22]. Chemometrics is a practical
application of mathematics and has evolved to play a major role in analytical chemistry. This
of multiple responses from a single analysis) creating complex and large data sets, as well as
with increased computer processing speed and data storage capabilities. The increased
process monitoring has not only created challenges related to data management but
integration (of the sensors as well as the data coming from them) as well. Spectroscopy based
analytical methods are extremely suited to chemometric applications due to the nature of the
spectra that often contain pertinent information which is very difficult to interpret. NIRS in
particular suffers from broad and overlapping peaks that create complex data matrices which
require chemometrics in order to extract essential information. Chemometrics is based on the
larger discipline of multivariate data analysis and therefore the same mathematical tools are
applied. However, instead of analyzing relationships between a number of process variables
with different units of measure (such as pH, temperature, dissolved oxygen etc.) the analysis
is normally applied to variables with identical units of measure (such as absorbance at
different wavelengths). To further clarify, MVDA would be applied to various sensor values
over the duration of a process where one of those sensors might be a NIRS measurement.
The value from a NIRS probe would be determined based on a chemometric model that
predicts the concentration of a constituent of interest. Chemometric models are strictly
empirical (often referred to as soft) and are generated from a limited set of available data.
Therefore, extrapolation is not advisable and it is critical that the model contains all possible
data variation which might be observed in the process. These models must also be validated
with data sets that were not used to create the model in order to test their true effectiveness
and functionality [23]. In general, there is a standard methodology that should be employed
Chemeometric Model Building Methodology
In order to construct calibration models a matrix must be built relating constituent
concentrations to spectral properties. Initially, samples are taken at the time of spectra
acquisition and constituents in the samples are determined using a primary reference method.
The calibration model relates these two matrices to each other so that constituent
concentrations can be predicted from future unknown spectra. The first step in this process is
to ensure that the model data is good and that there is sufficient data that represents all the
process variation over which the model will be expected to perform. Data can be described as
the combination of information and noise and the old adage remains true that “garbage in
equals garbage out”. When taking scans it is crucial that the proper reference be used and that
the probe and optics are in good working condition. However, defining good data is not
always straight forward. Initially the spectra are analyzed using principal component analysis
(PCA) without relationship to any reference data. This is referred to as unsupervised
classification since no sample information is provided and classification only occurs based on
the spectra itself without any prior expectations [24]. PCA reduces the large number of initial
variables (in this case absorbance at various wavelengths for a number of samples) by
projecting them onto a few latent variables (or principal components) that should describe
most of the variation of the original variables. The first PC describes the greatest amount of
the original data with each additional PC containing less than the previous [25]. The general
equation for a PCA model is the following:
X represents the entire matrix of data which is often extremely large. T and P’ are the scores
and loadings of each principal component and E represents the residual matrix of the
information that was not described by the model. Scores and loadings will be described
further in Chapter 2. In layman terms the equation can be described as the following:
Data = Model + Error (2)
If too many PCs are selected then the model begins to describe the error itself and noise
becomes incorporated which is detrimental [25]. The removal of noise from the models
becomes a critical step in PCA and is therefore done prior to building the model by
performing pre-processing to the spectra. Spectra in the NIR region are influenced by
non-linearity’s arising from light scatter effects. Light scattering occurs due to particles in the
sample media such as cells and insoluble compounds (which causes base-line shifts) as well
as bubbles and density fluctuations to name a few. However, these effects can be eliminated
by applying the correct pre-processing techniques. These techniques are employed to reduce
the variability between samples that are a result of scattering effects. The main scatter
correction methods are Multiplicative Scatter Correction (MSC), Standard Normal Variate
(SNV) and normalization which all estimate correction coefficients and apply them in
slightly different ways. In addition, derivatives are commonly used as well as straight
forward baseline correction. The challenge is to not apply too severe of a technique that will
result in removing valuable information as well [26]. Most often, in addition to
is mean centered, where the mean of the observations is subtracted from each individual
observation to reduce the effect of high and low offsets, and then scaled or transformed by
dividing each observation by their standard deviations [27]. Thankfully, these transformation
and pre-processing techniques are applied with simple selections in the software package that
is being used to perform the modeling. With the PCA model built it is then possible to
visualize the multivariate data based on the main PCs using a scatter plot of each sample’s
scores or loadings. This helps to identify outliers or clusters. Clusters can be identified
visually or by using techniques based on geometric properties of the scatter plots such as
Mahalanobis distances or nearest neighbor classifications where, for example, points that are
of a certain distance to 3 other points in a cluster are considered members of that cluster.
Identifying clusters in this way is referred to as supervised classification and additional
context can be added to help describe the clusters. Another supervised technique is to link
the qualitative PCA model to specific properties of the sample using Partial Least Squares
(PLS) thereby developing a quantitative prediction model.
PLS modeling is the next step in the overall process where reference data is added to
the data matrix. Here the multivariate data now is associated with one specific variable. This
correlation can be made for a number of different variables since each spectral scan contains
information about a range of constituents in the sample. PLS is very effective at analyzing
collinear and noisy data with numerous independent X variables (such as a spectra data
matrix) and modeling these to one or several dependent Y variables. The same PCs are
Y = X.W(PT.W)-1.CT + G (3)
X = T.PT + E (4)
Where W is defined as weight, PT is the loading matrix for the X data set, CT is the loading matrix for the Y space, G is the residuals matrix of the PLS model and E is the residual
matrix of the X data set as described previously for equation (1) [24], [28].
Building the PLS model is an iterative procedure and often specific wavelength
regions of the spectra are selected based on correlations to the reference data or previous
knowledge of where the primary molecular bonds associated with the constituent of interest
will adsorb photon energy. Since future spectral scans will be used to predict concentrations
of constituents it is critical that the reference method be accurate and precise. It must be
noted that the calibration model will not perform better than the reference method used in its
construction. Verification of the model is initially performed through cross validation. Cross
validation is the process of removing one sample, a number of samples or even one batch
from the original data set and using the remaining data to build the model and predict the
sample(s) that were removed. The final step is to validate the model by analyzing spectra
from a batch or batches that were not used in the original construction of the model. The
question is always raised concerning the required number of batches or samples. This
depends on the process, total number of samples including range of analysis, and the medium
from 3-4 different batches can provide the basis for good calibration models as long as those
batches span the inherent variability of the process.
Current Industry Limitations
It has been identified that the entire Pharmaceutical industry is in dire need of
innovative technological solutions which includes advanced process control [29]. The
advancement in real-time monitoring has exposed a critical limitation in the ability to
integrate the data with the modeling tools in a complete package that enables advanced
process control. This holistic approach is required to realize maximum process understanding
and knowledge, increase potential for regulatory approval and equip manufacturers to
evaluate changes and implement change control procedures. Establishing a robust control
strategy during process development that can be scaled up and transferred to a manufacturing
process is crucial to ensure product quality throughout the product lifecycle. Implementation
of a strategy that can not only accurately monitor CPPS but also the interdependencies
between them is key to enable the advanced control required to ensure consistent
performance. This is specifically true in the case of large molecules where there are
thousands of metabolic pathways that can be altered based on minute environmental changes
that are often extremely synergistic in nature. To fully develop a design space that
characterizes acceptable performance multivariate tools are necessary. This is clear from a
process development standpoint where DOE is routinely utilized. However, there is a
disconnect when transitioning to manufacturing where monitoring and control is primarily
requirement to maintain the level of characterization of the process that enables advanced
control. The ideal advanced control platform should also have the capability of improving
throughout the lifecycle of the product. While the main control strategy is developed and
validated as a part of the overall regulatory approval of the product there should be room for
continual improvement. This is especially true in the case where multivariate techniques are
being employed. This full characterization that incorporates standard inline monitoring from
control systems (DCS, SCADA, PLC), advanced monitoring from sensors such as NIRS,
at-line monitoring from sample analysis, offat-line data from laboratory systems (LIMS) and
MVA models to elucidate the interdependencies of the various CPPs requires a platform that
enables full integration. This type of control strategy platform valuable in bringing drugs to
market faster as well as ensuring greater quality throughout the lifecycle. Current automation
and control for the production of Biopharmaceuticals is well behind other highly automated
industries such as semi-conductors. This fact is understood not only by regulators but by
consortiums such as the National Institute for Innovation in Manufacturing
Biopharmaceuticals (NIIMBL). NIIMBL has identified process control as a prime area for
improvement calling out the need for more research into advanced real-time analytics for
process control, predictive modeling and increased integration of process systems.
BioPhorum Operations Group (BPOG), the world’s leading biopharmaceutical manufacturers
and suppliers partnership, is developing a Biomanufacturing Technology Roadmap which
also calls out the need for improvements in real-time monitoring and the conversion of big
data sets into “smart data”. It is very clear that routine monitoring and PID controllers do not
While advanced monitoring tools are available there is a challenge in utilizing these tools
effectively. The main reason for this is the challenge that exists integrating multiple control
systems along with various monitoring systems for effective data analytics that can be
implemented real-time for CPV, UVA FD, MVA FD and predictive functionality. There is an
essential need to have the capability of creating soft sensors and predicting what might occur
within a batch or unit operation and then act upon it. These are all aspects required for a true
advanced control solution. This must be solved using a system based approach with an
adaptive platform that is able to integrate into existing systems, perform data analytics,
design strategies to use all possible information and ultimately close the loop for advanced
control. Research must be conducted to elucidate this need and determine the optimal
platform solution to address these issues. In addition, research is required to determine the
optimal reporting interface for alerts/alarms and dashboards to ensure information is
disseminated and acted upon and alarms can be managed appropriately.
Novel Approach
The next 3 chapters highlight the novel work being done to bridge this gap and
implement PAT systems for advanced process control. First, a study focused on process
development utilizing advanced monitoring (NIRS) to not only advance process development
activities but show how these tools, specifically chemometrics, can also be used to improve
analytical assays through improved qualitative and quantitative characterization. A
selected due to the transient nature of the process from year to year and the dire need for a
strong platform to speed development times for rapid manufacturing.
The second application focused on implementation in an anaerobic fermentation
manufacturing process of alcohol production utilizing yeast. The work shows how NIRS can
be utilized in a novel feed-forward control strategy to monitor yeast performance and predict
repitching rate. The final chapter is an E.coli case study that shows PAT implementation
spanning from process development to manufacturing and culminates with a novel platform
enabling the implementation of an advanced control strategy using multivariate models,
MANUSCRIPT 1.
Evaluation of Near-Infrared Spectroscopy (NIRS) for on-line
determination of virus titers in Cell Culture based Influenza Vaccine
Manufacturing
The content of this chapter has been submitted for publication in: Biotechnology and Bioengineering
ABSTRACT
Traditional egg based influenza vaccine manufacturing processes suffer from a
number of shortcomings and limitations. Recent advances have been made in the use of cell
culture for the production of influenza vaccines. However, uncertainties exist due to the
inherent variability of cell population kinetics as well as the sensitive nature of the population
to slight environmental shifts. Therefore, it is not possible to develop a single process that
will yield similar results for every possible virus strain. Since new virus strains are
potentially selected each year and the threat of a new pandemic strain looms on the horizon it
becomes crucial to design both a process development and manufacturing platform that
would be applicable to any and every eventuality. To satisfy these criteria, such a platform
must be capable of designing robustness into the overall process while yielding acceptable
results in the shortest possible time. This work suggests the use of a novel platform
incorporating advanced process monitoring to better elucidate cause and effect relationships
as well as insuring that infection and harvest occur at optimal time points to maximize virus
titers and overall manufacturing process quality. By incorporating Near Infrared
spectroscopy (NIRS) to determine virus titers, substrate concentrations, cell turbidity and
by-product formation in real time, the design would also satisfy the PAT initiative set forth by
the FDA to increase process understanding and control. NIRS has already been shown to
effectively monitor most of these parameters with the exception of virus titer. The current
research demonstrates the effectiveness of this novel application of NIRS. Models were
validation batch. Validation predictions showed an average prediction residual of only 20.5
HAU/50uL and average percent difference between predicted and measured values of 15.5%.
Key words: NIRS, cell culture, influenza virus, HA, process development, quality, process
monitoring, control
INTRODUCTION
Over 20% of the population is infected with the influenza virus each year resulting in
250,000 to 500,000 influenza-related deaths globally and approximately 38,000 deaths in the
US alone. Of even further concern is the potential for pandemic outbreaks which pose a
severe global threat to public health [30], [31]. Vaccination has proven to be a critical tool in
controlling the spread of infectious diseases as evidenced by the eradication of polio,
smallpox and diphtheria in most parts of the world. A caveat of the influenza virus when
compared to the aforementioned viruses is that the two main surface glycoproteins,
Hemagglutinin (HA) and Neuraminidase (NA), which cause an immune response and the
resulting flu like symptoms, experience antigenic “drift” and “shift”, which enable new
mutant virons to avoid recognition by host antibodies. As such, re-occurring flu pandemics
occur and, while vaccination is the most effective means of prevention, new vaccines must be
created each year to target the most prevalent virus mutations [32]. Seasonal flu vaccines
consist of three virus strains selected by the World Health Organization (WHO) based on
surveillance data from the previous flu season. Selections are typically made in February in
order to generate a tri-valent vaccine ready for distribution in September. Therefore, it is