Effect of SLM process parameters on the quality of Al Alloy parts; Part I:
1
powder characterization, density, surface roughness, and dimensional
2
accuracy
3 4
Ahmed H. Maamoun *1), Yi F. Xue1), Mohamed A. Elbestawi 1), Stephen C. Veldhuis1) 5
6
1)McMaster University, Department of Mechanical Engineering,
7
1280 Main Street West Hamilton, ON, Canada, L8S 4L7
8
Abstract
9
Additive manufacturing (AM) of high strength Al alloys promises to enhance the 10
performance of critical components related to various aerospace and automotive applications. The 11
key advantage of AM is its ability to generate lightweight, robust, and complex shapes. However, 12
the characteristics of the as-built parts may represent an obstacle to satisfy the part quality 13
requirements. The current study investigates the influence of selective laser melting (SLM) process 14
parameters on the quality of parts fabricated from different Al alloys. A design of experiment 15
(DOE) is used to analyze relative density, porosity, surface roughness, and dimensional accuracy 16
according to the interaction effect between the SLM process parameters. The results show a range 17
of energy densities and SLM process parameters for the AlSi10Mg and Al6061 alloys needed to 18
achieve “optimum” values for each performance characteristic. A process map is developed for 19
each material by combining the optimized range of SLM process parameters for each characteristic 20
to ensure good quality of the as-built parts. The second part of this study investigates the effect of 21
SLM process parameters on the microstructure and mechanical properties of the same Al alloys. 22
This comprehensive study is also aimed at reducing the amount of post-processing needed. 23
24
Keywords: Additive Manufacturing; Selective Laser Melting; AlSi10Mg; Al6061; SLM process 25
parameters; Powder characterization; Density, Surface topology; Dimensional accuracy 26
* Corresponding author contact: [email protected]; [email protected] 27
2
1. Introduction
28
High-strength aluminum alloys (Al alloys) are typical used for the production of lightweight 29
critical components for a variety of applications in space, aerospace, automotive, military, and 30
biomedical fields [1]. Additive manufacturing (AM) offers additional flexibility in the design and 31
manufacturing of parts, particularly the ability to fabricate complex geometries without the need 32
for custom tools [2]. SLM offers superior dimensional accuracy and material quality of the 33
fabricated parts [3]. 34
SLM is a layer-by-layer process, in which the laser beam selectively melts the powder layer 35
according to slices generated from the three-dimensional designed model. SLM possesses rapid 36
melting and solidification rates, and thus is applicable for a narrow selection of materials according 37
to their coefficient of thermal expansion (CTE). In addition, optimization of SLM process 38
parameters of Al alloys is hampered by part defects due to energy loss in the laser beam projected 39
to the powder bed surface. The quality of Al alloys produced by SLM could be influenced by the 40
chemical composition and CTE of the material used. Galy et al. [4] showed that porosity, hot 41
cracking, anisotropy, and surface quality are the principal defects of Al alloy parts. They also 42
demonstrated that selection of SLM process parameters and the laser beam energy loss due to Al 43
reflectivity are the primary causes of porosity and hot crack formation. 44
Some of the SLM process parameters can be controlled, such as laser power, scan speed, 45
hatch spacing, and powder layer thickness. The energy density is a function of these parameters. 46
Optimization of the SLM process parameters is an essential step for controlling material 47
3
µm powder layer thickness could result in a higher strength and lower elongation for Inconel 718 49
than the values obtained with a 50 µm layer thickness. Nguyen et al. [6] also studied the effect of 50
the powder layer thickness within a range from 20 to 50 µm. Their results showed that as the 51
thickness of the powder layer diminishes, part density and dimensional accuracy increase. Cheng 52
et al. [7] investigated the effect of scanning strategy on the stress and deformation of parts. Their 53
results showed that minimum stress and deformation values are obtained using a layer orientation 54
strategy with an angle of 45˚ or 67˚. The powder feedstock quality also represents an essential 55
parameter that might affect part characteristics. Sutton et al. [8] reported that the powder 56
morphology, microstructure, and chemical characteristics could change depending on the 57
production method such as gas, water, or plasma atomization techniques. This could generate a 58
difference in quality between the parts produced using different feedstock powders [9,10]. 59
Various studies [11–15] utilized a design of experiment (DOE) approach to investigate the 60
effect of SLM process parameters on AlSi10Mg part quality, by evaluating their density, surface 61
roughness, and dimensional accuracy. Read et al. [12] used the response surface methodology 62
(RSM) to evaluate the influence of SLM process parameters on part porosity. Their study was 63
limited by the use of a laser power up to 200 W. The results showed that minimum porosity was 64
obtained at a critical energy density of 60 J/mm3. Abouelkhair et al. [13] used one factor at a time 65
(OFAT) method to optimize the SLM process parameters for producing dense parts. They achieved 66
an optimum combination of laser power, scan speed, and hatch spacing which resulted in a 99.77% 67
relative density. Hitzler et al. [15] demonstrated that the surface roughness of the as-built samples 68
varies according to their position on the build plate. They also concluded that the increase of energy 69
4
roughness values measured on the top surface. Calignano et al. [14] used the Taguchi method to 71
investigate the effect of the SLM process parameters on the surface roughness of the parts. They 72
found that the laser scan speed has a significant influence on the surface roughness. Lower surface 73
roughness was obtained using a scan speed of 900 mm/s, 120W laser power, and 0.1 mm hatch 74
spacing. Han et al. [16] reported that a decrease in surface roughness, combined with an increase 75
of the laser scan speed, results in better dimensional accuracy. It is worthwhile to note that the 76
previous studies used the DOE within a range of laser power up to 200 W. However, the post-77
processing treatment is also considered to be an essential stage of reducing the defects inside the 78
as-built parts. This in turn, raises the final production cost of the parts [17–19]. Consequently, 79
optimization of the SLM process parameters has a significant role in optimizing the steps of the 80
manufacturing process. This might lead to a cost-effective process for specific applications which 81
are compatible with the characteristics of the as-built parts. 82
In general, Al6061 is seldom used for SLM. Fulcher et al. [20] reported that Al6061 parts 83
have a lower dimensional accuracy compared to the AlSi10Mg parts due to higher CTE. High 84
strength Al alloys such Al6061 and Al7075 series have low Mg and Si content which might result 85
in hot cracking and formation of large columnar grains [21]. Louvis et al. [22] reported that low 86
relative density parts of Al6061 might be produced via SLM due to the effect of oxide formation 87
inside these parts. This might result from the relatively low laser power used, (100W) which may 88
not be enough to achieve complete melting. In general, more research is required to evaluate the 89
effect of SLM process parameters on the as-built Al6061 characteristics such as density, surface 90
roughness, and dimensional accuracy. In addition, the effect of Si content requires further 91
5
In this study, a comprehensive experimental study using the DOE approach is performed to 93
evaluate the influence of the SLM process parameters on the quality of as-built Al alloys. Part I of 94
the manuscript focuses on investigating the density, surface topology, and dimensional accuracy 95
of AlSi10Mg and Al6061. SLM process parameters are selected over a wide range of laser power, 96
scanning speed, and hatch spacing values. Part characteristics are evaluated for various SLM 97
parameters to develop a process map which displays the effect of Si content on part quality. Part 98
II will cover the impact of the SLM process parameters on the microstructure and mechanical 99
properties of the same Al alloys. This work aims to investigate the limits of SLM in fabricating 100
critical components for aerospace industry using these alloys. In particular, the current research is 101
focused on producing high-quality metallic optics and optomechanical components to improve the 102
performance of telescopes and laser systems. 103
2. Experimental procedure 104
2.1 Material 105
Powder characterization was performed according to ASTM F3049-14. The powders 106
chemical composition was evaluated using Energy X-ray dispersive Spectroscopy (EDS). The 107
powder size distribution was measured using laser diffraction by dispersing the powder in water. 108
The powder morphology was investigated using a Scanning Electron Microscope (SEM). A 109
diffractometer equipped with a cobalt sealed tube source and an area detector was used to obtain 110
the X-ray diffraction (XRD) phase pattern for both powders. 111
6
A DOE was developed to evaluate the response of the SLM process parameters and the 113
volumetric energy density with respect to the as-built parts quality. The volumetric energy density 114
is defined as follows: 115
𝐸𝑑 = P
V𝑠 ∗ 𝐷ℎ∗ T𝑙
116
Where the Ed is the energy density (J/mm3), P is the laser beam power (W), Vs is the laser 117
scan speed (mm/s), Dh is the hatch spacing between scan passes, and Tl is the deposited layer 118
thickness (µm). The OFAT method was used to analyze the performance of the AlSi10Mg 119
samples. Eight different samples were produced with six replications for each. Several SLM 120
parameters were selected to build the AlSi10Mg samples as listed in Table 1, with a constant layer 121
thickness of 30 µm. The effect of the laser power, scan speed, hatch spacing, and energy density 122
on the as-built part characteristics are evaluated with regression analysis. 123
124
A full factorial DOE was developed using the response surface over a wide range of SLM 125
parameters. Two sets of three SLM parameters (laser power, scanning speed, and hatch spacing) 126
7
fabricated for a total of 48 samples. The energy density (Ed) for the Al6061 study was selected 128
within a higher range (40-125 J/mm3) compared to the Ed used for AlSi10Mg (27-65 J/mm3). This 129
is due to the higher reflectivity of laser power for Al6061, which results in less energy absorption 130
by the powder particles. The overlap of SLM parameters for some samples of AlSi10Mg and 131
Al6061 enabled investigation of each material at equal parameters. 132
133
134
2.3 SLM process parameters 135
The AlSi10Mg and Al6061 parts were fabricated by an EOSINT M290 machine equipped 136
with a 400W Yb-fiber laser using a 100 µm laser beam diameter. The same layer thickness of 30 137
µm and layer orientation angle of 67˚ were selected for all samples undergoing strip scan, and 0.02 138
mm laser beam offset. The build chamber was vacuumed with Argon to reduce the oxygen content 139
below 0.1%, and thus the possibility of oxide formation in the produced parts. All samples were 140
fabricated as 15 mm cubes according to the SLM parameters listed in Tables 1 and 2. A preheating 141
technique was applied to the build platform at 200 ˚C before starting the build to minimize the 142
8
2.4 Sample characterization method 144
In Part I of this study, part characterization focuses on relative density, internal porosity, 145
surface roughness, and dimensional accuracy. Archimedes method was used to measure the 146
density of the as-built cubes for both AlSi10Mg and Al6061 samples. The relative density was 147
also evaluated after sample surface polishing to investigate the percentage of internal porosity. 148
Density measurement via water displacement, according to ASTM B962-17, was performed with 149
an electronic Densimeter (MD-200S). 150
Surface roughness measurements were performed according to ASTM D7127-17 with a 151
Mitutoyo SJ-410 surface tester. Five measurements at intervals of 4.5 mm were conducted on the 152
cubic specimen’s top surface, and their average was taken at each location. A light microscope 153
(Alicona Infinite Focus G5) was used to capture the surface texture of some of the AlSi10Mg and 154
Al6061 samples. The area tested is 10 mm x 10 mm using a 10x magnification lens, and surface 155
roughness also was measured to validate the values obtained by the mechanical stylus. 156
The measurement of geometric dimensions and tolerances (GD&T) was conducted with a 157
Mitutoyo CRYSTA-Apex S544 Coordinate Measuring Machine (CMM) which includes an 158
SP25M stylus. This machine has a resolution of 0.1m within a working zone of 500mm x 400mm 159
x 400mm. The tested surface was probed at 10 measurement points along each sample’s face. 160
Flatness, perpendicularity, and parallelism were measured for all sample faces except the bottom. 161
3. Results and discussion 162
9
The characteristics of the gas atomized AlSi10Mg and Al6061 powder, supplied by the LPW 164
Company, were examined according to ASTM F3049-14. The powder was sieved with a 75 µm 165
mesh before being characterized. The morphology of both powders was detected using SEM as 166
illustrated in Figure 1. The SEM observations show a relatively higher percentage of elongated or 167
irregular shape particles in the AlSi10Mg powder compared to the spherical particles detected for 168
the same alloy provided by a different supplier as reported by Maamoun et al.[17,18]. The Al6061 169
also shows a greater percentage of spherical particles compared to the AlSi10Mg powder shown 170
in Figure 1. The existence of irregular or elongated particles might reduce powder flowability and 171
homogeneity of the powder layer distribution, and thus negatively affect the quality and density of 172
the fabricated parts [9]. The combination of a wide range of fine and coarse particles could increase 173
the powder packing density, but it reduces the flowability due to the effect of powder cohesion and 174
inter-particle forces [9]. The weight percentage of the chemical elements of both powders were 175
detected with EDS, as listed in Table 3. The results reveal higher Si content inside the AlSi10Mg 176
powder, and relatively lower weight percentage of Mg, Cu, and Fe compared to the Al6061 177
powder. The influence of this difference in chemical composition, in addition to the effect of 178
powder particle shape, on the characteristics of the as-built parts, will be discussed in the following 179
sections. 180
10 182
Figure 2 illustrates the profile PSD of AlSi10Mg and Al6061 powder attributes with a 183
positively skewed profile. This PSD profile could achieve a better surface quality and higher 184
density compared to negatively skewed and Gaussian distribution grades by increasing the laser 185
energy absorption [9,23]. The quantitative data of PSD presented in Table 4 show that the particle 186
size ranges from 12 to 110 µm for the AlSi10Mg, and from 12 to 120 µm for the Al6061 powder. 187
These results indicate the presence of larger sized particles compared to the mesh size used for 188
sieving. This might be related to the elongated particles detected with a smaller cross-section which 189
11
and Al6061 powder, 90% of the particles are less in size than the sieving mesh (75 µm) where 191
D(0.9) is measured as 66.55 and 71.92 µm respectively. 192
193
194
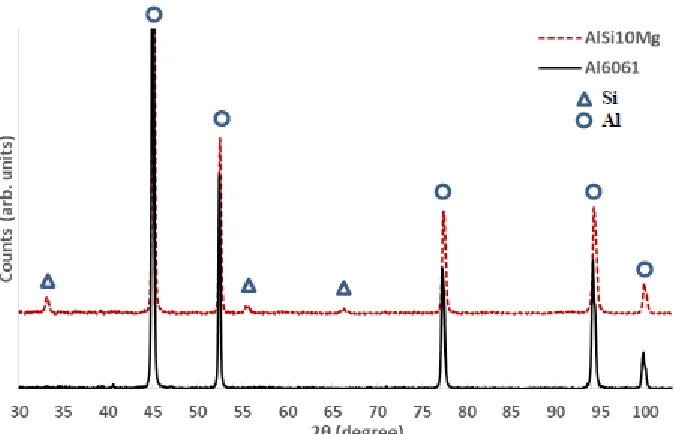
The XRD phase patterns of AlSi10Mg and Al6061powder were detected as shown in Figure 195
3. The Al and Si peaks were identified according to the Joint Committee on Powder Diffraction 196
Standards (JCPDS) patterns of 01-089-2837, 01-089-5012 respectively. The low-intensity of the 197
Si peaks in the Al6061 phase pattern, is due to its small weight percentage inside that alloy. For 198
the AlSi10Mg powder, the higher intensity of Si peaks and the slight shift of the Al peaks to the 199
12 201
3.2 Relative Density 202
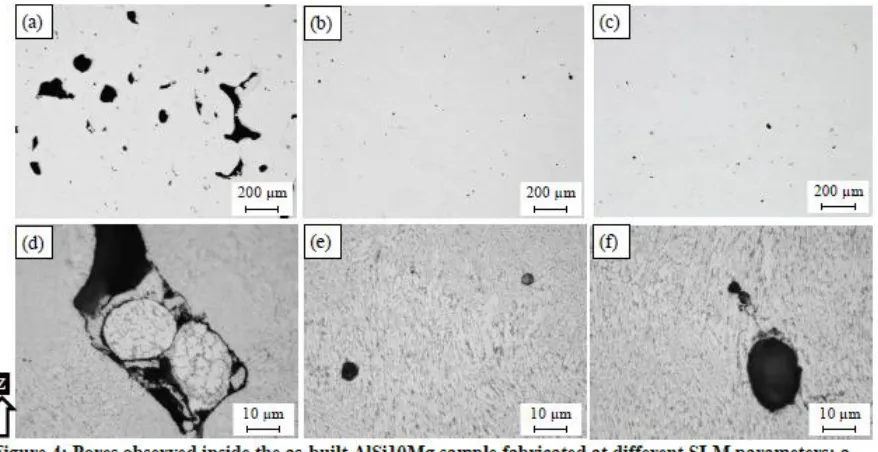
Figure 4 shows the effect of energy density on the formation of pores inside the as-built 203
AlSi10Mg part. The results show that the low energy density of 27 J/mm3 in the AS8 sample, could 204
cause significant keyhole porosity due to the lack of fusion of powder particles during the SLM 205
process as shown in Figure 4(a). The keyhole pores are observed along the building direction 206
within the layer boundaries, which have an irregular elongated shape due to the low energy density. 207
The keyhole pores might form either due to insufficient energy delivered to the powder particles 208
or due to the entrapment of gas bubbles between the interlayers during laser scanning [25]. The 209
keyhole pore size reaches 200 µm and gradually decreases as the energy density increases, until 210
disappearing when the energy density value exceeds 50 J/mm3. Inside the keyhole pores, partially 211
melted particles are visible, as shown in Figure 4(d). This may occur due to trapping of the 212
13
particle surface. However, the spherical hydrogen pores or metallurgical pores are observed within 214
10 µm size at 50 J/mm3 as shown in Figure 4(b, e). The average size of these spherical pores tends 215
to grow by more than 20 µm at 65 J/mm3 as illustrated in Figure 4(c, f). The mechanism of pore 216
formation at high fusion rates might be related to the pores existing inside the gas atomized powder 217
particles [4]. They may also result from the balling phenomena where the melted powder failed to 218
wet the previously deposited layer [26]. 219
220
The mechanism of pore formation inside the as-built AlSi10Mg samples according to the 221
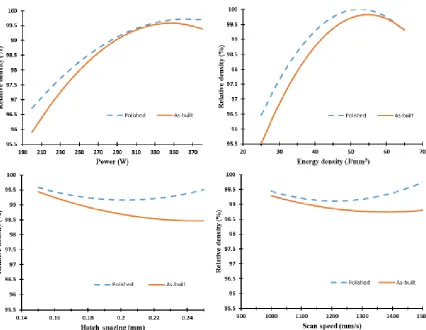
SLM process parameters presented in Figure 4, is validated after evaluating the relative density. 222
Figure 5 illustrates the map developed by the regression model generated from the DOE analysis. 223
This map describes the effect of laser power, scan speed, hatch spacing and energy density on the 224
relative density of the as-built AlSi10Mg parts. The results show the optimum range of process 225
14
possible relative density value of the part. The energy density value between 50 to 60 J/mm3 227
produces a high relative density reaches 99.7%. Beyond this range, the relative density diminishes 228
either due to the lack of fusion at the lower energy density, balling formation at the higher energy 229
density, or hydrogen gases trapped inside the powder particles. It is worthwhile to note that higher 230
values of the as-built part density could be obtained according to optimized SLM process 231
parameters compared to the values reported by different literature studies [12,27–29]. In order to 232
evaluate the internal porosity inside the as-built cube samples, their outer sides were polished 233
before the relative density was re-measured. As shown in Figure 5, the relative density of the 234
polished samples reaches 99.9 at an energy density of 50 J/mm3 with a 0.1-1% reduction in 235
porosity. By comparing the relative density between the as-built and polished sample, it can be 236
concluded that an increase in hatch spacing or scan speed parameters significantly increases the 237
porosity on the sample surface, as illustrated in Figure 5. This effect might result from the 238
reduction of the material solidification rate at a higher scan speed and hatch spacing due to heat 239
accumulation. The effect of laser power indicates a significant impact of the growth of the melting 240
rate and energy on the relative density of the as-built part. It is worth noting that the porosity 241
percentage could be reduced after preheating the build platform prior to the sample build as 242
15 244
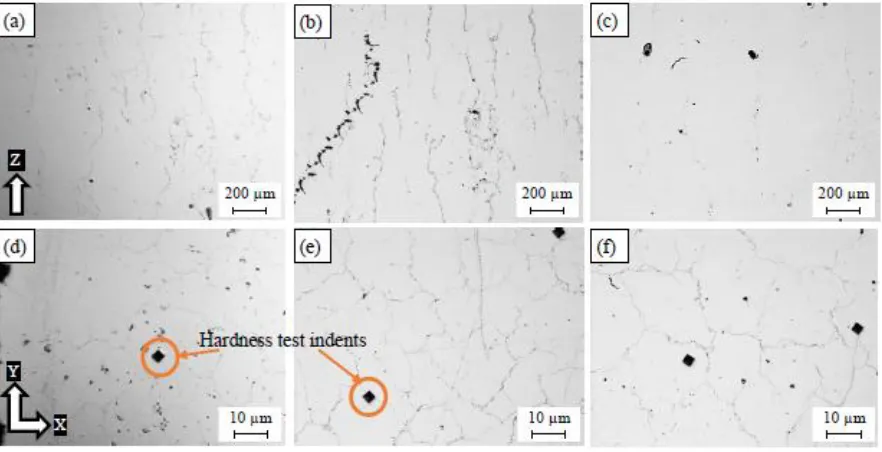
Figure 6 shows the microscopic observations of the polished as-built Al6061 samples 245
fabricated at different SLM process parameters listed in Table 2. Different sizes of micro-cracks 246
are observed between the samples along the Z-direction and the XY-plane. As shown in Figure 6, 247
a lower porosity percentage is observed compared to the as-built AlSi10Mg samples. The keyhole 248
pores are also reduced until they are hardly noticeable, with the exception of some spherical 249
hydrogen pores. However, the relative density is relatively lower than that of the AlSi10Mg 250
samples due to the presence of micro-cracks. The size of these micro-cracks depends on the 251
16
affected by changing the SLM process parameters applied. Figure 6 (a-c) shows the longitudinal 253
microcracks formed along the Z-direction. The different size of these cracks is obtained according 254
to the applied SLM parameters. The smallest size and density of the cracks were observed after 255
the applied energy density reached 102.8 J/mm3 in the 1A sample. However, no specific trend was 256
detected between the energy density and the density of cracks, which is in agreement with Debroy 257
et al. [31]. As illustrated in Figure 6(d-f), the micro-cracks along the XY plane are shaped as semi-258
closed loops similar in form to an equiaxed grain, but they are not entirely closed or sharp-edged. 259
The results show that the laser scan speed is the leading parameter affecting crack formation. The 260
crack density, along with the building direction, increases along with energy density from 40.5 to 261
76.9 J/mm3 at the same scan speed ( 1300 mm/s) as shown in Figure 6 (a, b) respectively. However, 262
the crack density displayed in Figure 6(c), is significantly reduced at a higher energy density (102.8 263
J/mm3) with a lower scan speed of 800 mm/s. Consequently, the scan speed has a more substantial 264
effect on hot crack formation than the applied energy density, since it controls the rate of 265
solidification. The size of the semi-closed cracks formed in the XY plane tends to grow alongside 266
scan speed reduction as noted in Figure 6(d-f). The indents presented in Figure 6 (d-f) are formed 267
17 269
Figure 7 presents the plots generated via the DOE analysis using the effect of the two 270
combined process parameters on the relative density of the as-built part. It can be concluded that 271
relative density tends to increase along with laser power and energy density, while a lower rate of 272
the laser scan speed leads to denser parts. A significant relationship can be seen between laser 273
power and scan speed. A relative density average of 98.2% ± 0.5 is measured according to the 274
selected process parameters where the maximum relative density reaches 98.72%. These plots 275
validate the trend obtained from the microscopic observations in Figure 6 and confirm the effect 276
of the laser scan speed on crack formation and relative density. The cracks observed inside the as-277
built parts could result from the hot crack phenomena which occur during material solidification, 278
due to combined chemical composition of the material. Kou et al. [32] reported that adding filler 279
18
and enhance the alloy’s weldability. This explains the crack free structure obtained in the as-built 281
AlSi10Mg parts, which have a high Si content compared to Al6061. 282
283
3.3 Surface topology 284
The surface topology analysis of the as-built AlSi10Mg and Al6061 parts is conducted with 285
SEM, displaying the 3D surface texture, and mapping the surface roughness relationship with SLM 286
process parameters according to the DOE analysis regression model. The surface defects of the as-287
19
increase. Figure 8(a, d) shows the rough surface obtained from the AS8 sample fabricated using a 289
low energy density of 27 J/mm3. According to SEM observations, this high roughness results from 290
surface pores forming due to a lack of fusion and partially melted powder adhering to the surface. 291
As shown in Figure 8(b, e), an increase of energy density in the AS3 sample to 49.9 J/mm3 , 292
improves surface roughness by eliminating noticeable surface pores and by reducing the density 293
of the partially melted powder attached to the surface. However, the tracks of laser scanning are 294
still visible with the commencement of balling phenomena. Figure 8 (c, f) shows a better surface 295
on the AS1 sample after applying a higher energy density of 63 J/mm3. This eliminates the tracks 296
of laser scanning, but the balling effect is still present. The balling phenomena occurs at higher 297
energy density levels due to the surface tension generated around the melted powder particles. This 298
represents an obstacle to the wetting of the underlying substrate layer by the melted powder [31]. 299
It is also worthwhile to note that the effect of the balling phenomena increases as energy density 300
exceeds 65 J/mm3. As a result, the part build fails due to the detachment of the powder layer, which 301
20 303
Figure 9 exhibits the 3D surface texture of the as-built AlSi10Mg samples; the results show 304
a significant improvement of the surface roughness alongside an increase of the energy density up 305
to a specific limit. As shown in Figure 9(a), applying a low energy density of 27 J/mm3 resulted in 306
a rough texture with an average of 15 µm surface roughness. As illustrated in Figure 9(b), the 307
surface roughness decreased to 10 µm at a relatively high energy density of 40.5 J/mm3. The 308
surface roughness continues to decrease until reaching the lowest value of 4.5 µm at an energy 309
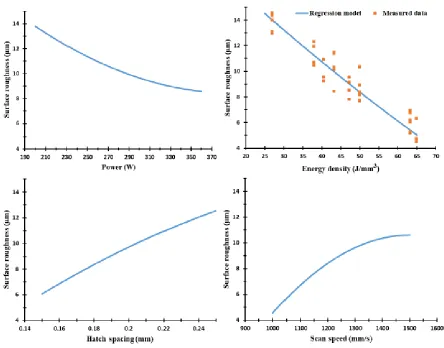
21 311
The mapping of the SLM process parameter effect on the surface roughness of the as-built 312
AlSi10Mg parts is illustrated in Figure 10. The regression model generated by the energy density 313
effect on surface roughness shows a good agreement with the measured values. The laser power 314
effect reveals the same trend as the energy density influence on the samples’ surface roughness. 315
This map also shows that the increasing of hatch spacing value resulted in a more rough surface 316
due to decreasing overlap between the melted tracks, which agrees with the trend presented by 317
Foster et al. [33]. Surface roughness also increases with the laser scan due to the reduction of the 318
22
65 J/mm3 at 370W laser power, 1000 mm/s scan speed, and 0.19 mm hatch spacing, which is in 320
good agreement with the regression model. 321
322
Figure 11 shows that the surface defects of as-built Al6061 parts are more significant than 323
those of the AlSi10Mg parts. These defects are present in the partially melted powder adhering to 324
the surface at a low energy density, surface porosity, and course solidified tracks of laser scanning 325
as illustrated in Figure 11 (a). The surface finish gradually improves as energy density increases 326
23
observed at a high microscopic magnification within a size of 50-200 µm, concentrated at the end 328
of the laser tracks along the XY plane due to high thermal stress. These cracks adversely affect the 329
surface roughness of the as-built Al6061 parts, which is why SLM process parameters need to be 330
optimized to reduce micro-crack formation. 331
332
3D surface texture of Al6061 samples in Figure 12 confirms the trend of surface finish 333
improvement from the application of a higher energy density. The energy density range of Al6061 334
(40.5-123.3 J/mm3) is shifted to a higher value compared to the limited Ed range of the AlSi10Mg 335
24
AlSi10Mg, which requires more energy to completely melt the powder layer. However, balling 337
phen 338
339
omena effect propagates at higher energy densities, limiting the applicable values of Ed. 340
The regression model derived from surface roughness values versus SLM process 341
parameters is presented in Figure 13. The plots illustrate that the higher the laser power, the lower 342
the roughness of the sample surface becomes. The lowest surface roughness of 3 µm was obtained 343
at 370 W laser power, 800 mm/s of scan speed, and 0.15 mm hatch spacing, which is in good 344
agreement with the surface roughness measured for parts fabricated at an energy density of 102.8 345
25
roughness and the change in both scan speed and hatch spacing parameters. However, a substantial 347
relationship was noted between the scan speed and hatch spacing effect on the surface roughness 348
at a constant laser power value. The parabolic shape of the energy density impact indicates an 349
optimum value of 102.8 J/mm3 which results in a better surface finish. 350
351
3.4 Dimensional accuracy 352
The dimensional accuracy analysis is performed according to the CMM measurements for 353
26
Al6061 parts. The values measured along the XY plane were used to generate the regression 355
models which represent the effect of SLM process parameters on each characteristic. Figure 14 356
shows the dimension tolerance of the average cube length for each sample. According to the 357
recorded results, oversize dimension measurements are compared to the designed values, and there 358
is no contraction observed in the cube sample length. The oversize in the cube length results from 359
the balling effect, partial melted particles on the sample surface, which thus affects the outer 360
surface stair step profile [16]. After excluding the 0.02 mm laser beam offset, the dimension 361
tolerance ranges from 0.15 up to 0.195 mm. Figure 14 shows that hatch spacing is the leading 362
parameter affecting the dimension tolerance accuracy in addition to laser power. The surface 363
flatness difference between the samples tested shows a smaller range of change of 0.035 to 0.09 364
mm, due to the application of a small 30 µm layer thickness. Figure 15 shows the surface flatness 365
behaviour according to the change of SLM process parameters. It is observed that the hatch spacing 366
and scan speed are the main parameters affecting part surface flatness. The higher the scan speed 367
and hatch spacing, the lower the surface flatness error obtained. Figure 15 also shows a good 368
agreement between the regression model of the energy density effect on surface flatness and the 369
measured values. The results indicate that the surface flatness error increased together with an 370
28 373
The as-built Al6061 parts show a different behaviour for the dimensional tolerance values 374
than that of AlSi10Mg parts. As illustrated in Figure 16, SLM parameters can affect the dimension 375
tolerance by either expanding or contracting dimensions, and could thus depend on the applied 376
energy density. This might be caused by a change in melt pool dimensions generated by the energy 377
density [16]. The sample dimension tolerance shows a good agreement with the regression model 378
curve. Figure 16 also shows that an energy density higher than 76.8 J/mm3 results in higher 379
dimension tolerance than the original value. However, energy density applied below this level 380
29
increased rate of heat dissipation and solidification. It is also noticed that part contraction occurs 382
at lower rates of hatch spacing and higher scan speeds. 383
384
In Figure 17, the surface flatness of Al6061 samples demonstrate a range of 0.05 to 0.24 385
mm, which is significantly higher than in the AlSi10Mg sample. This elevated surface flatness 386
disparity might be due to the higher CTE of the Al6061 material which reduces heat accumulation 387
inside the part. This difference in the surface flatness might also result from hot cracks forming 388
30 390
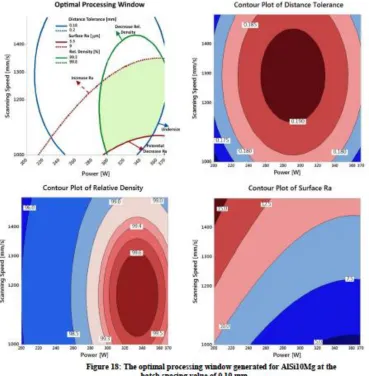
A combination of the optimized range for each performance characteristic is presented in the 391
process parameter map of the scan speed and laser power at a constant hatch spacing of 0.19 mm, 392
as illustrated in Figure 18 and Figure 19. The process map for the as-built AlSi10Mg parts is 393
displayed in Figure 18. This map presents an optimized range for the SLM process parameters to 394
satisfy a surface roughness range from 5.5 to 9 µm, relative density within 99.3 to 99.8%, and a 395
31 397
Figure 19 illustrates the process map for the as-built Al6061 parts that displays the optimized 398
range for the scan speed and the laser power. The optimized process window shows a surface 399
roughness improvement of 3.2 to 6 µm compared to the values obtained from the AlSi10Mg part 400
process map. The dimensional tolerance is also optimized within a smaller range of -0.03 to +0.03 401
mm with minimum reduction of dimensions compared to the severe contraction in Figure 16 402
avoided within the optimized process parameter range. However, the relative density of the 403
32 405
4. Summary and conclusions 406
The current study represents the first part of a comprehensive work that investigates the 407
effect of SLM process parameters on the quality of the as-built AlSi10Mg and Al6061 parts. A 408
full characterization of both materials’ powder was presented. DOE was used to investigate 409
33
Regression models and the trends were obtained from to the measured data. The results show the 411
following different characteristic behaviours for each material: 412
1. Powder morphology reveals that AlSi10Mg and Al6061 possess a spherical particle shape 413
interspersed with a considerable percentage of elongated particles. PSD shows a positively 414
skewed distribution within a range of 12 to 120 µm. EDS analysis and XRD phase pattern 415
are used to detect the weight percentage of the chemical elements of each material. 416
2. The rate of energy density affects the relative density and porosity formation inside the as-417
built parts. The optimum range of energy density is 50-60 J/mm3, which results in relative 418
density reaches 99.7%. Relative density of the polished samples reaches 99.9% with a 0.1% 419
internal porosity. The higher rates of energy densities contribute to large hydrogen spherical 420
pores, while the lower rates result in keyhole pores due to the lack of powder fusion. 421
3. For the Al6061, the maximum relative density measured is 98.72 % using an energy density 422
of 102.8 J/mm3 and 800 mm/s scan speed. A relationship between the scan speed and laser 423
power was noted, where the higher relative density was achieved at a low scan speed and high 424
laser power. The relative density of the Al6061 parts show lower values compared to those 425
detected in AlSi10Mg, due to lower Si content, which increases the CTE, and causes the 426
formation of hot cracks inside the as-built Al6061 parts. 427
4. The surface topology is significantly affected by the energy density applied to both 428
materials. The surface roughness reduces alongside the increase of energy density. For the 429
AlSi10Mg samples, the minimum surface roughness is 4.5 µm at 65 J/mm3. For the Al6061 430
34
energy density is limited to a maximum of 65 J/mm3 for the AlSi10Mg and 123.3 J/mm3 for 432
Al6061 to avoid delamination and failure of the part building. 433
5. For AlSi10Mg, the dimensional tolerance varies between an oversize of 0.15 to 0.195 mm. 434
The best surface flatness could be obtained with higher hatch spacing and scan speeds. 435
6. For the Al6061 parts, the lowest dimensional tolerance was achieved using an energy 436
density of 76.8 J/mm3. Contraction of the part dimension was observed at lower energy 437
densities, and the oversized part dimension was detected at higher energy densities. The 438
surface flatness of Al6061 is superior to that of AlSi10Mg parts. 439
7. Relative density, surface topology, and dimensional accuracy of the as-built AlSi10Mg and 440
Al6061 parts were investigated along with a wide range of SLM process parameters. Optimal 441
processing conditions were determined each material with the goal of achieving a high-quality 442
end product. 443
8. The influence of the SLM process parameters on microstructure and mechanical properties 444
of as-built AlSi10Mg and Al6061 parts is thoroughly presented in Part II of this study. 445
446
Author Contributions: 447
Formal analysis, Ahmed Maamoun and Yi Xue; Investigation, Ahmed Maamoun and Yi 448
Xue; Methodology, Ahmed Maamoun; Supervision, Mohamed Elbestawi and Stephen Veldhuis; 449
Validation, Ahmed Maamoun; Writing – original draft, Ahmed Maamoun and Yi Xue; Writing – 450
review & editing, Ahmed Maamoun, Mohamed Elbestawi and Stephen Veldhuis. 451
35
The authors would like to acknowledge the Additive Manufacturing Innovation Centre at 453
Mohawk College, Hamilton, Ontario, Canada and the XRD measurement analysis at McMaster 454
Analytical X-ray (MAX) diffraction facility. 455
References 456
1. Manfredi, D.; Calignano, F.; Krishnan, M.; Canali, R.; Paola, E.; Biamino, S.; Ugues, D.; 457
Pavese, M.; Fino, P. Additive Manufacturing of Al Alloys and Aluminium Matrix 458
Composites (AMCs). In Light Metal Alloys Applications; 2014 ISBN 978-953-51-1588-5. 459
2. Srivatsan, T. S.; Sudarshan, T. S. Additive Manufacturing: Innovations, Advances, and 460
Applications; 2015; ISBN 9781498714778. 461
3. Hassanin, H.; Elshaer, A.; Benhadj-Djilali, R.; Modica, F.; Fassi, I. Surface Finish 462
Improvement of Additive Manufactured Metal Parts. Micro Precis. Manuf. 2018, 145–164, 463
doi:10.1007/978-3-319-68801-5_7. 464
4. Galy, C.; Le Guen, E.; Lacoste, E.; Arvieu, C. Main defects observed in aluminum alloy 465
parts produced by SLM: From causes to consequences. Addit. Manuf. 2018, 22, 165–175. 466
5. Sufiiarov, V. S.; Popovich, A. A.; Borisov, E. V; Polozov, I. A.; Masaylo, D. V; Orlov, A. 467
V The effect of layer thickness at selective laser melting. Procedia Eng. 2017, 174, 126– 468
134. 469
6. Nguyen, Q. B.; Luu, D. N.; Nai, S. M. L.; Zhu, Z.; Chen, Z.; Wei, J. The role of powder 470
layer thickness on the quality of SLM printed parts. Arch. Civ. Mech. Eng. 2018, 18, 948– 471
955. 472
7. Cheng, B.; Shrestha, S.; Chou, Y. K. Stress and deformation evaluations of scanning 473
strategy effect in selective laser melting. In ASME 2016 11th International Manufacturing 474
Science and Engineering Conference; American Society of Mechanical Engineers, 2016; p. 475
V003T08A009-V003T08A009. 476
8. Sutton, A. T.; Kriewall, C. S.; Leu, M. C.; Newkirk, J. W. Powder characterisation 477
techniques and effects of powder characteristics on part properties in powder-bed fusion 478
processes. Virtual Phys. Prototyp. 2017, 12, 3–29. 479
9. Tan, J. H.; Wong, W. L. E.; Dalgarno, K. W. An overview of powder granulometry on 480
feedstock and part performance in the selective laser melting process. Addit. Manuf. 2017, 481
18, 228–255. 482
10. Scipioni Bertoli, U.; Guss, G.; Wu, S.; Matthews, M. J.; Schoenung, J. M. In-situ 483
36
of powder bed fusion additive manufacturing. Mater. Des. 2017, 135, 385–396, 485
doi:10.1016/j.matdes.2017.09.044. 486
11. Yang, K. V.; Rometsch, P.; Jarvis, T.; Rao, J.; Cao, S.; Davies, C.; Wu, X. Porosity 487
formation mechanisms and fatigue response in Al-Si-Mg alloys made by selective laser 488
melting. Mater. Sci. Eng. A 2018, 712, 166–174, doi:10.1016/j.msea.2017.11.078. 489
12. Read, N.; Wang, W.; Essa, K.; Attallah, M. M. Selective laser melting of AlSi10Mg alloy: 490
Process optimisation and mechanical properties development. Mater. Des. 2015, 65, 417– 491
424, doi:10.1016/j.matdes.2014.09.044. 492
13. Aboulkhair, N. T.; Everitt, N. M.; Ashcroft, I.; Tuck, C. Reducing porosity in AlSi10Mg 493
parts processed by selective laser melting. Addit. Manuf. 2014, 1, 77–86, 494
doi:10.1016/j.addma.2014.08.001. 495
14. Calignano, F.; Manfredi, D.; Ambrosio, E. P.; Iuliano, L.; Fino, P. Influence of process 496
parameters on surface roughness of aluminum parts produced by DMLS. Int. J. Adv. Manuf. 497
Technol. 2013, 67, 2743–2751, doi:10.1007/s00170-012-4688-9. 498
15. Hitzler, L.; Hirsch, J.; Merkel, M.; Hall, W.; Öchsner, A. Position dependent surface quality 499
in selective laser melting: Positionsabhängige Oberflächenqualität im selektiven 500
Laserstrahlschmelzen. Materwiss. Werksttech. 2017, 48, 327–334, 501
doi:10.1002/mawe.201600742. 502
16. Han, X.; Zhu, H.; Nie, X.; Wang, G.; Zeng, X. Investigation on selective laser melting 503
AlSi10Mg cellular lattice strut: Molten pool morphology, surface roughness and 504
dimensional accuracy. Materials (Basel). 2018, 11, doi:10.3390/ma11030392. 505
17. Maamoun, A. H.; Elbestawi, M.; Dosbaeva, G. K.; Veldhuis, S. C. Thermal Post-processing 506
of AlSi10Mg parts produced by Selective Laser Melting using recycled powder. Addit. 507
Manuf. 2018, 21, 234–247, doi:10.1016/j.addma.2018.03.014. 508
18. Maamoun, A.; Elbestawi, M.; Veldhuis, S. Influence of Shot Peening on AlSi10Mg Parts 509
Fabricated by Additive Manufacturing. J. Manuf. Mater. Process. 2018, 2, 40, 510
doi:10.3390/jmmp2030040. 511
19. Maamoun, A. H.; Veldhuis, S. C.; Elbestawi, M. Friction stir processing of AlSi10Mg parts 512
produced by selective laser melting. J. Mater. Process. Technol. 2019, 263, 308–320. 513
20. Fulcher, B. A.; Leigh, D. K.; Watt, T. J. Comparison of AlSi10Mg and Al 6061 Processed 514
Through DMLS. Proc. 25th Solid Free. Fabr. Symp. 2014, 404–419. 515
21. Martin, J. H.; Yahata, B. D.; Hundley, J. M.; Mayer, J. A.; Schaedler, T. A.; Pollock, T. M. 516
3D printing of high-strength aluminium alloys. Nature 2017, 549, 365–369, 517
doi:10.1038/nature23894. 518
37
Mater. Process. Technol. 2011, 211, 275–284, doi:10.1016/j.jmatprotec.2010.09.019. 520
23. Lee, Y. S.; Nandwana, P.; Zhang, W. Dynamic simulation of powder packing structure for 521
powder bed additive manufacturing. Int. J. Adv. Manuf. Technol. 2018, 96, 1507–1520, 522
doi:10.1007/s00170-018-1697-3. 523
24. Ma, P.; Prashanth, K.; Scudino, S.; Jia, Y.; Wang, H.; Zou, C.; Wei, Z.; Eckert, J. Influence 524
of Annealing on Mechanical Properties of Al-20Si Processed by Selective Laser Melting. 525
Metals (Basel). 2014, 4, 28–36, doi:10.3390/met4010028. 526
25. Olakanmi, E. O. t; Cochrane, R. F.; Dalgarno, K. W. A review on selective laser 527
sintering/melting (SLS/SLM) of aluminium alloy powders: Processing, microstructure, and 528
properties. Prog. Mater. Sci. 2015, 74, 401–477. 529
26. Sames, W. J.; List, F. A.; Pannala, S.; Dehoff, R. R.; Babu, S. S. The metallurgy and 530
processing science of metal additive manufacturing. Int. Mater. Rev. 2016, 61, 315–360. 531
27. Damon, J.; Dietrich, S.; Vollert, F.; Gibmeier, J.; Schulze, V. Process dependent porosity 532
and the influence of shot peening on porosity morphology regarding selective laser melted 533
AlSi10Mg parts. Addit. Manuf. 2018, 20, 77–89, doi:10.1016/j.addma.2018.01.001. 534
28. A.A, R.; M.S, W.; M., I.; K., K.; Ahmed, A.; S, S. Mechanical and Physical Properties of 535
AlSi10Mg Processed through Selective Laser Melting. Int. J. Eng. Technol. 2016, 8, 2612– 536
2618, doi:10.21817/ijet/2016/v8i6/160806217. 537
29. Thijs, L.; Kempen, K.; Kruth, J. P.; Van Humbeeck, J. Fine-structured aluminium products 538
with controllable texture by selective laser melting of pre-alloyed AlSi10Mg powder. Acta 539
Mater. 2013, 61, 1809–1819, doi:10.1016/j.actamat.2012.11.052. 540
30. Siddique, S.; Imran, M.; Wycisk, E.; Emmelmann, C.; Walther, F. Influence of process-541
induced microstructure and imperfections on mechanical properties of AlSi12 processed by 542
selective laser melting. J. Mater. Process. Technol. 2015, 221, 205–213, 543
doi:10.1016/j.jmatprotec.2015.02.023. 544
31. DebRoy, T.; Wei, H. L.; Zuback, J. S.; Mukherjee, T.; Elmer, J. W.; Milewski, J. O.; Beese, 545
A. M.; Wilson-Heid, A.; De, A.; Zhang, W. Additive manufacturing of metallic components 546
– Process, structure and properties. Prog. Mater. Sci. 2018, 92, 112–224. 547
32. Kou, S. A Simple Index for Predicting the Susceptibility to Solidification Cracking. Weld. 548
J. 2015, 94, 374s–388s. 549
33. Foster, S. J.; Carver, K.; Dinwiddie, R. B.; List, F.; Unocic, K. A.; Chaudhary, A.; Babu, S. 550
S. Process-Defect-Structure-Property Correlations During Laser Powder Bed Fusion of 551
Alloy 718: Role of In Situ and Ex Situ Characterizations. Metall. Mater. Trans. A Phys. 552
Metall. Mater. Sci. 2018. 553