VICTORIA ! UNIVERSITY
+!
DEPARTMENT OF COMPUTER AND
MATHEMATICAL SCIENCES
Capability Indices for Multivariate Processes
Pak F. Tang and Neil S. Barnett
(49 EQRM 14)
December, 1994
(AMS : 62N10)
TECHNICAL REPORT
VICTORIA UNIVERSITY OF TECHNOLOGY (P 0 BOX 14428) MELBOURNE MAIL CENTRE
MELBOURNE, VICTORIA, 3000 AUSTRALIA
CAP ABILITY INDICES FOR
MULTIVARIATE PROCESSES
PAKF. TANG
Iand
NEIL S. BARNETT
2Department of Computer and Mathematical Sciences, Victoria University of Technology, Footscray Campus, PO Box 14428, MMC Melbourne, Victoria 3000, Australia.
Key words: Multivariate Capability Index, Bonferroni Inequality, Sidak-type Inequality, Chebyshev-type Inequality.
ABSTRACT
To satisfactorily describe the capability of multivariate processes, a multivariate capability index is required. This paper describes three approaches to designing capability indices for multivariate normal processes. In particular, three bivariate process capability indices are proposed and some simple rules provided for interpreting the ranges of values they take. The development of one index involves the projection of a -process ellipse, containing at least a specified proportion of products, on to its component axes. The second one is based on the Bonferroni inequality. The final index utilizes Sidak's multivariate normal probability inequality in its construction. Some comparisons of the three indices are provided. An approximate test is developed for the Sidak-type capability index. A possible method of forming robust multivariate capability indices based on multivariate Chebyshev-type inequalities is also considered.
l Mr. Tang is a graduate student in statistics. 2 Dr. Barnett is Associate Professor in statistics
INTRODUCTION
Since the pioneering work of Kane ( 1986), there have been many
articles published dealing with process capability indices. Some
developments in process capability analysis are outlined by Rodriguez
(1992) in a special issue of the Journal of Quality Technology, entirely
devoted to the topic. In Marcucci et al. (1988), it was noted that 'an index for multidimensional situations .... .is another outstanding problem ... '. Most
of the relevant work to date has focussed on the developments of process
capability indices for single product characteristics. In many manufacturing situations, the quality of a manufactured product is more often than not
determined by reference to more than one product characteristic. Invariably
manufacturing conditions are such that there is an inter-dependency in the
development of these product characteristics. To discuss process capability under these circumstances then, requires a method that acknowledges this
inter-dependency and constn1cts an index that incorporates knowledge of
the covariance structure of the quality characteristics.
The most commonly used univariate capability indices are the
Cp,
cpk and
cpm
indices which are definedas:-C
==
U-Lp 6cr ,
C
pk=M .
zn
{U-µ µ-L}
3cr,3cr
and
c -
pm - 6i}cr2+(µ-T)2 U-Lwhere µ ,
cr,
U, L and T=
u;L
denote the process mean, standard deviation,•
upper and lower specification limits, and target respectively. The first is
strictly concerned with process potential in that it makes no reference to the
process mean, µ. However, they all essentially reflect process potential in
that they implicitly assume a perfectly controlled process. For meaningful use of these indices to describe actual process behaviour consideration of their sampling distributions is necessary. Statistical issues of estimation and hypothesis testing and practical matters such as the use and interpretation of these indices have been extensively discussed in the literature (see for eg., Kushler et al.(1992), Franklin et al.(1992), Pearn et al.(1992), Barnett (1990) and Boyles (1991 )). These indices are applicable for situations involving two-sided specifications but some adaptations for one-sided specifications can also be found in the literature.
After reviewing existing work on multivariate process capability indices, this paper explores further the possibility of assessing multivariate process performance by using a single composite measure and describes three approaches for doing so. In particular, three bivariate process capability indices are proposed and s01ne si1nple rules provided for
interpreting the values they take. The relative effectiveness of the proposed indices as a comprehensive summary of process performance, with respect to all of the measured characteristics, is also provided. An approximate test for one of the proposed indices is developed. Possible methods of
developing robust capability indices are also considered. The paper focuses
-on the commonly encountered situations in which the measured
A REVIEW OF MULTIVARIATE CAPABILITY
INDICES
Chan et al.( 1991) introduced a so-called multivariate version of the
cpm
index which is defined as :np
To do this, they made the assumption that the specification requirements for a p-variate process or product are prescribed in the form of an ellipsoidal region given by
'
(xp-Tp)
A-
1(xp
-Tp)
<c
2where X P, TP, A and
c
are respectively the p-characteristic random vector,some specified p x I vector, a p x p positive definite matrix and a constant. As this definition involves the sample observations rather than being based
_on the process parameters (i.e the mean vectorµ P and the covariance
matrix I:), Peam et al.(1992) stated, quite correctly, that it should be taken as an estimator (denoted
C
pm ) of the following revised index :,....,
p
Much of the discussion of Chan et al.(1990) was devoted to the test of
C pm = 1 based on the univariate statistic,
,....,
which is distributed as a Chi-square variable with np degrees of freedom
under the multinormal assumption, with
µP
=TP
andL
=A.
Such a test reduces to the simultaneous test of both µ P =TP
andL
=A
against allother possible alternatives including those cases where the process is
incapable, barely capable and more-than-capable. A value greater or smaller than expected for the test statistic, D, is merely a consequence of the
violation of this null hypothesis and does not make any definitive statement about the process capability. For instance, if the given specification
boundary, c2 is considerably smaller than x~(8), the upper 1008 th
percentile of the Chi-square distribution with p degrees of freedom and the
value of the test statistic is smaller than expected (which suggests that
Cpm ..., > 1 ), this does not ensure that the expected proportion of non-defective
items is more than 1-8 , where 8 represents the acceptable maximum proportion of defective items. On the other hand, if c2
is larger than
x;(o)
and the value of the test statistic is greater than the predictable limit, this does not necessarily indicate that the process is incapable, although cpm ,._, < 1is suggested. Apart from the issue of interpretability and the unrealistic assumption of a specification ellipsoid, it is worth noting that this work is more concerned with 'process capability analysis' rather than with the design of a unitless capability measure. Other issues of importance were discussed by Peam et al.(1992).
and
as generalizations of the univariate
cp
andcpm
indices. If µv =TV and:L=A,
thenc;
in the above definitions is equated tox.~(0.0027),
otherwise,it is computed such that
In contrast to the C,,m ,...., index, these indices correctly reflect process
capability in the sense that their values decrease with declining process
performance. However, as noted in their paper, the essential problem with
these indices lies in the estimation and computation of them when µv
*
Tv___ ,..,,
and
L
*
A due to the complexity of the distribution of the quadratic formI
{
~
-~)
A-1 {~
-'I:).
If these indices are to be of any practical use,therefore, computer programs for their estimation or computation must be
available.
In view of the fact that it is unlikely to have specifications given as
ellipsoids, Rodriguez (1992) suggested the direct estimation of the
proportion of nonconforming items by integration of the multivariate normal
density function over the specification rectangular region. Boyles (l 994b)
•
also considered this alten1ative of estimating process capability and
which is based on simple binomial estimates. The total discussion is in the
context of repeated lattice-structured measurements.
Unlike others, Hubele et al.(1991) proposed a capability vector for a
bivariate normal process which consists of three components. The first is
the ratio of the area of the spec{fication rectangle to that of the projected
process rectangle, giving an analogue of the univariate
CP
index. Thesecond component, is defined as the significance level computed from a T2
-type statistic which measures the relative location of the process centre and
the target. The last component is designed to capture situations where one
or more of the process limits fall beyond the corresponding specification
limits. Although some efforts were made to demonstrate the usefulness of
this capability vector as a smnmary measure of the process performance,
interpretation is sometimes difficult.
Other contributions come from Taam et al.(1993) who proposed a
multivariate capability index defined as
MC
=
VolumeofR
1pm
Volume of
R2 'where R1 and R2 represent respectively the mod{fied tolerance region
(modified according to the process distribution) and the scaled 99.73%
process region (scaled by the mean squared error,
L...
=
E[
(XP -TP)(XP -TP)'] ). If the process follows a multivariate normaldistribution, then the modified tolerance region here is the largest ellipsoid
inscribing the original specification region and the scaled process region,
R2 , is an ellipsoidal region represented by
(XP -µP)'l:;1(XP - µP) <x!co.0021). Thus, under normality assumptions, this
Vol .(R1) 1
MCP,,, = Vol.{R3) x
[t
+(µp-Tp)' L-1(µp-Tp)j_ MCP DT
where R3 is the natural process ellipsoid containing 99.73% of items, MC P = ~:::~~:~ is an analogue of the univariate CP (squared) index which
measures the process potential and
Dr=
l+(µP -TP)'L-1(µP-TP) is ameasure of process mean deviation from target. As stated by Taam et al.(1993), this is an analogue of the univariate Cpm (squared) index. Note
also that this index is sitnilar to v C~,,,, except in the manner in which the
process potential and the deviation of mean from target are quantified. In
terms of its ease of computation and general applicability, it is superior to
the latter. Besides the fact that it can be used for different types of
specification region (see the exatnple on geometric dimensioning and
tolerancing (GDT) in the satne paper), this index can be extended to
non-normal processes provided the specifications are two-sided. This, however,
entails the determination of the proper process and modified tolerance
region and the resulting computations are likely to be complex. In the same ~·
paper, Taam et al.(1993) considered the estimation of this capability index.
However, they simply replace the unknown mean vector
µP
and thecovariance matrix I: in the expression for the proposed index with the usual
,,
unbiased estimates and use X;
co
.
0021) as the boundary of the processellipsoid without taking into consideration issues such as unbiasedness,
efficiency and uncertainty of the resulting capability index estimate. They
also highlighted some similarities and differences between the proposed index ( MC,,m), C pm ..., and the bivariate capability vector proposed by Hubele
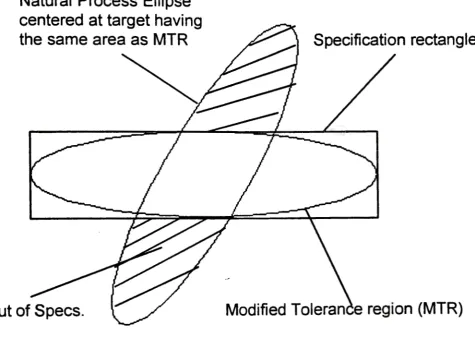
et al.(1991). A major problem with this index is its likelihood of leading to
misleading conclusions. For instance, if the measured characteristics are not
target and the volume of the process ellipsoid being the same as that of the
modified tolerance region), there is no assurance that the process under
consideration is capable of meeting the specifications consistently or can be
expected to produce 99.73o/o of confonning items. This is in conflict with
the statement made by Taain et al.(1993) that, 'when the process is centered
at the target and the capability index is 1, it indicates 99. 7 3 % of the process
values lie inside the tolerance region.' The deficiency in this comment is
illustrated in Fi1:,JUre 1 for a bivariate normal process.
Boyles (1994a) introduced the concept of exploratory capability
analysis (ECA) which is aimed at capability improvement rather than
assessment. This should be distinguished from the so-called confirmatory
capability analysis (CCA) which involves formally assessing whether the
process under consideration is capable of meeting the given specifications
or not. ECA, essentially utilizes exploratory graphical data ai1alysis
techniques, such as boxplots, to reveal or to assist in identifying new
opportunities for process improvement. Three real examples involving
repeated measurements with lattice structure were used to illustrate the
usefulness of the concept. _,,
In another paper, Boyles (l 994b) proposed ai1 expository technique
0f analyzing multivariate data using repeated measurements with a lattice
structure where the number of measurements for the same characteristic on
each part or product, p, may possibly exceed the number of inspected parts
or products, n. He developed a class of Direct Covariance (DC) models
corresponding to a general class of lattices and obtained some positive
definite estimates of the covariance matrix denoted by
i:oc
even whenn ~
p .
This property of positive definiteness for the estimated covariancematrix permits the computations of multivariate capability indices and
estimated process yields which depend on 1:-' when n
<
p or when n is notill-conditioned with respect to matrix inversion. He made some efforts to
justify the use of the proposed model for process capability analysis. In
particular, he demonstrated the superiority of employing
:to
e
to provide anestimate of the proportion of nonconforming units over the use of sample
covariance and the 'empirical' approach of simple binomial estimates. To do
this he used sets of data from Boyles (1994a) along with some simulation
results.
CONSTRUCTING A MUL TIV ARIA TE
CAPABILITY INDEX
With the assumption that the process under focus follows a
multivariate normal distribution, consider the following approaches to the
design of a multivariate process capability index. Before proceeding, it
should be pointed out that, although these approaches have been widely
discussed in simultaneous interval estimation problems (see for eg., Johnson
et al. (1988) and Nickerson (1994)), they are used here in a different
context.
The first approach entails the constn1ction of a conservative
p-dimensional 'process rectangle' from the projection of an exact ellipsoid
(ellipse if bivariate) containing a specified proportion of items on to its
component axes. The edges of the resulting process rectangle (the process
limits) are then compared with their corresponding specification limits. The
associated index is defined in such a way that it is 1 if the process rectangle
is contained within the p-dimensional 'spec[fication rectangle' with at least
one edge coinciding with its corresponding upper or lower specification
limits, greater than 1 if the process rectangle is completely contained within
the specification rectangle and less than 1 otherwise. A bivariate capability
The second approach is based on the well known Bonferroni
inequality. Unlike the first one, this approach actually requires only the
weaker assumption of normality for each individual product characteristic.
The capability index using this approach is defined in the same manner as
above. The resulting process rectangular region having at least a specified
proportion of conforming items is compared with the specification
rectangle. The value of the proposed capability index reflects conservatively
the process capability of meeting the specifications consistently. In fact, the
assessment of process performance based on the Bonferroni inequality has
been perceived by Boyles (1994b) but it is used in a different way and
context. It should also be pointed out, despite his statement to the contrary, that the given inequality
where
}-1t=P~-~
<X1 <Du ,1 <j<PI
µ,L)
l-7t
1 =Pr(x1 >-D, ,1<J
< pI
µ,L)
l-7tu
=P~Xj
<Du ,l<j<pl µ,}:)is not generally true.
Another approach utilizes the multivariate normal probability
inequality given by Sidak (1967). It will be seen later, that a capability
index constructed based on this inequality and using arguments similar to
the above, provides the best measure runong all those proposed in this
THREE BIVARIATE CAPABILITY INDICES
Suppose that the vector of the p product characteristics,
X P = ( X1 , X 2 , ••• , X
p)'
follows a multivariate nonnal distribution with meanvector µ P =
(µ
1 ,µ
2 , ••. ,~L
p)'
and covariance matrixL.
Further, suppose thata manufactured product is considered usable if all its measured product
characteristics are within their corresponding specification limits. Leto
denote the proportion of unusable items produced that can be tolerated. Our
aim is to obtain the relationship between the component means, the
elements of the covariance matrix,
o
and the specification limits of all themeasured characteristics by solving the following integral equation :
so that an index can be defined that reliably reflects the actual process
capability. Directly attempting to solve this equation is generally inadvisable
due to computational difficulties, so some approximations are presented.
(1) Projection of Exact Ellipsoid Containing a Specified Proportion of
Products
It is known, for eg., Johnson et al.(1988) that, if
Xp - Np(µp,L),
theAs given by Nickerson (1994), the projection of the above ellipsoid on
to each of its component axes is given by :
lxJ -
µ
11
<
~x~(8)[Jth
diagonal element of
2:]
1
or
µi
-~x~(8)
ai <x1<
µi
+Jx~(8)
cri ... (I)J=l,2 ...
,p
Note that rewriting (I) yields the well known I 00(1-8 )% simultaneous
confidence interval for µ P = (µ1 , µ2, ... , µ
J'
based on a sample of sizen
=1
when cr1 ,cr2 , ••• ,cr P are known (Johnson et al.(1988)). As a specialcase, consider developing a capability index for bivariate processes,
though it can easily be extended to the more general case. Note that, for
p
=
2,x.!(o)=
-2ln8. Thus, we have from (I) that, the 'bivariateprocess limits' (i.e the limits beyond which at most I 008 % of items are
expected to be produced) are,
j
=
1, 2
.
It follows, that for
u
2u,
J J/(xi,x
2)ca
1ca
2>1-8,
L2 LI
satisfied:-U 1 ~ µ I + CJ I
.J-
2 Ino
L 1 s; µ I - cr 1
.J-
2 lno
U 2 ~ µ 2 + cr 2
.J-2
lno
L2 s; µ2 - cr2
.J-2
ln 8 or equivalently,and
Accordingly, the bivariate process capability index, C ~~),is defined as
C(2) _ ·
j
cp1 cp2l
pk - Mm
I , ,---'"--, --,
1.J-2
lno
+ µ, -T. l.J-2
Ino
+ µ2 - T2 '3 3cr1 3 3cr2
where C Pi and T1 (j = 1,2) are respectively the univariate process
capability indices { C
P)
and the target values for the two productcharacteristics. Note that ifthe process is on-target i.e µl =T1 and
µi
=Ti ,c(i>
= Min{CP1,CP2 }, pk
t
.J-
2 Ino '
which can be taken as a measure of the process potential. Although this
capability index is conservative by nature and thus must be carefully
interpreted, it does provide some insight into the practical capability of
the process. A value of I or greater can safely be interpreted as the
departure fr01n nonnality. However, if it has a value smaller than 1, it does not necessarily indicate that the expected proportion of usable items produced is less than 1-8, unless it is significantly different from 1. In this case, perhaps some sitnple guidelines or ad hoc rules would
help to determine if the process capability is adequate. Note the interesting fact that, although the covariance structure of the product characteristics are considered in the development of the above, the proposed bivariate capability index does not involve the correlation coefficient p of the two characteristics. It is also noted that the proposed index has some similarity to the bivariate capability vector proposed by Hubele et al.(1991 ). It differs from the latter, however, in that it incorporates both the process potential and the deviation of the process mean from target into a unitless measure. Hubele et al's
capability index consists of three components, one for measuring the process location, one for process dispersion (potential) and the other for indicating whether any of the process limits is beyond its corresponding specification limit(s). Whilst it may be argued that using separate
indicators for each of the above factors to reflect the process status may make the interpretation clearer, this process capability vector involves more calculation and does not have any clear advantages over the proposed index.
(2) Bonferroni-Type Process Rectang;ular Region
According to the Bonferroni inequality, for a p-variate process for
which the marginal distributions are normal, the p-dimensional centered process rectangle containing at least 100(1-8)% of items is given by:
µ·-ZsO'·
<x
.
<µ ·+ZsO' ·where z012p denotes the upper 1OO(oI2p )th percentile of a standard
normal distribution. By replacing p by 2 in the above, the bivariate
process limits are obtained. Proceeding as previously, another bivariate
capability index is obtained and defined as,
which has a similar interpretation. If p = 1, o = o. 0027 and the process is
on-target, this type of multivariate capability index reduces to the
univariate
c
p 'c;k
and cpm indices. It should be noted that this methodof developing capability indices can be extended to non-normal
processes by replacing
-z
814 andz
814 by the appropriate quantiles of theprocess distribution.
(3) Process Rectangular Region based on Sidak's Probability
Inequality
As given by Sidak (1967), the multivariate normal probability inequality
IS
:-where Z 1' s are standard normal variables and c.i' s denote some
where
<I>(•)
denotes the cumulative distribution function of the standard normal variable. Setting the lower bound, [ 2<1>( c) -1]P
of the jointprobability above equal to 1 - 8 results in a p-dimensional process rectangle containing at least 100(1-8)% of items given
by:-µ
j -cr
/l>-
1 (~[
1-t{ 1---S)v
P ] )<
x
j<
µ
j+
cr
/l>-
1 (~(
1-t{
1---S)vpJ),
J=l,2, ...
,p,where <1>-1 ( •) represents the inverse of the standard normal distribution
function. A bivariate capability index is obtainable by replacing p with 2
and comparing the resulting bivariate process limits with the corresponding specification li1nits. This index is defined as
:-In the development of the above indices, it has been assumed that the tolerances are bilateral and that the target or nominal
specification is the midpoint of the specification band, this, of course, is not always the case in practice. Under these circumstances, redefinition of the indices using similar arguments is straightforward and will not be · discussed further.
As all of the above are of similar form, it is preferable to choose the one which is least conservative or that best reflects the
actual process capability. In the following section, some comparisons between the three are provided in order to resolve this issue.
SOME COMPARISONS OF THE PROJECTED,
BONFERR
,
ONI AND SID AK-TYPE CAP ABILITY
INDICES
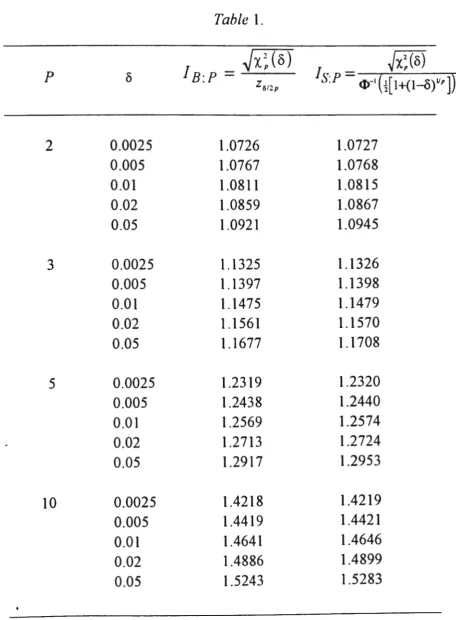
Following conventional practice, the relative merits of the proposed capability indices can be evaluated based on the following ratios :
I
= Width of I 00( 1- 8)%
projected Interval for jth characteristic B:P Width of I 00( 1- 8)%
Bonferroni Interval.for jth characteristic_gw
Z8/2p
and
-Width of I 00( 1 - 8
)%
projected Interval for )th characteristicIs
P
-: - Width of I 00( 1 - 8
)%
Sidak Interval for }th characteristicgreater than 1, the Bonferroni-type capability index is better (less
conseivative) than that which is based on projections. Similarly, a value of
I
S:P greater than I implies that the Sidak-type index is superior to the projected one. As for the relative effectiveness of the Bonferroni and Sidak-type indices, this is measured by the relative magnitude of theircorresponding I B: p and ls: p values. The values of these indices are tabulated in Table I for some selected values of p and 8 . It can be seen from this table that, in all the realistic cases considered, both the capability indices based on the Bonferroni and Sidak inequalities provide better
measures than the Projection-type capability index. The table also shows that, as the number of measured characteristics, p increases, the better the Bonferroni or Sidak-type capability index becomes. Furthermore, as shown in the table, the Sidak-type capability index is marginally better than that based on the Bonferroni inequality. The following section is devoted to the development of a test concerning process capability based on the Sidak-type index.
_,,
TESTING THE CAPABILITY OF A BIVARIATE
PROCESS
In practice, the assessment of process performance is often based on sample estimates of some capability indices which are subject to
uncertainty. Unless the sample size is reasonably large, it is inappropriate to draw definite conclusions from these process capability estimates. Of
fluctuations of these estimates into consideration. A common approach is to
employ confidence intervals. If point estimates are to be used, it is desirable
that estimation is unbiased and that the minimum sample size required for
an acceptable margin of estimation error is adhered to. Another approach is
based on testing hypotheses. Either approach generally requires knowledge
of the sampling distributions which are complicated. To circumvent this
problem, we develop an approximate test for the Sidak-type index (8Ci,~).
Consider the problem of testing the following hypotheses :
H .
0 . Sc(2) pk ->I
vs
.
H .
Sc(2)<I
a pk
Under the null hypothesis, H0 , the process is capable and the worst scenario
is when both the Sidak-type process and specification rectangles coincide,
in which case 8c~r =I. On the other hand, the alternative hypothesis, Ha
corresponds to situations where at least one edge of the process rectangle is
beyond its corresponding specification limit. The test proposed here is
designed to capture such a situation.
_,,
A reasonable choice of the test statistic for this problem is,
where
and X . and S . denote respectively the mean and standard deviation of the
' 1 J
jth product characteristic based on a sample of size n. The decision rule is
"'
sc
(2)<
k
pk
where k is some positive constant depending on the significance level of the test (a.) and is determined from
Max
Pr{
sC~>
<
k
I
Ho
is true}
=a.
The maximum value on the left-hand side of the above equation occurs when µ J = TJ and Uj - Lj = 2c cr1 for j = 1, 2 (the worst situation under Ho).
Thus, we have,
or
I 2
Pr
'
n
}=1
I (n-l)S
2
I _ _ _ 1
+--cr~
c/;i
=1-a
... (2)
According to the Bonferroni inequality,
{
2
[
(n-1;s:
+-I
(X,-µ,)
2
<1.]}~l-~Pr{-1-
(n-i;s:
+-I(X1-µ1)
2
~l.}
Pr
n
Jnl-1 O' c.rn CJ I .r,, k L.J~
cr, cJn aJJn k1=1 J J j=l
A conservative test of the hypotheses stipulated above may now be
obtained by replacing the left-hand side of (2) with the right-hand side of (3)
givmg,
2
~Pr
1L..J
;
.Jn
1}=1
As
I
.Jn
I(n-l)SJ +_I_
a~
c..Jn
j
=
1,2
are identically distributed, it follows that,
Pr
1 (n-l)S2
1
(xj-µJr
>l
u
.Jn 1
}+
a~
c/;z
a
J;-Fz
-
k2·
_,,
V
=
(n-l)s:W
-(- r
X-µ J J.If 0"2 and
-
a
1
!Fn '
J
the problem reduces to finding the ( 1-
~)th
quantile ofI
JV+
1
JW
M
cfn
,
not available. However, it is possible to obtain the approximate values of
the required quantiles and thus the critical values, k, using Comish-Fisher
expansions. Johnson et al. (1970) outlined the method of obtaining these
expansions and provided a formula which expresses the standardized
quantiles of any distribution in terms of its standardized cumulants and the
corresponding standard nonnal quantiles. However, it is found that there are
some inconsistencies in the results obtained by using the expression
provided by these authors. As an alternative, numerical solutions are
obtained from the following integral
equation:-00
J
Fn-{
(n-1)(11
k--.Jw
I
c£)2]J
1(w)dw
=
1-
~,
0'
where
fv( •)
andF;,(
•)respectively denote the probability density and thecumulative distribution function of a Chi-Square variable with v degrees of
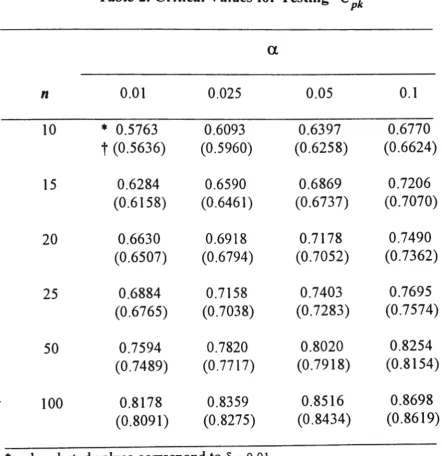
freedom. The approximate critical value, k, is obtained in this way using
Mathematica software and given to 4 significant digits in Table 2 for
·-"
various combinations of tolerable pro-portion of unusable items (8 ), sample
size (n) and significance level (a).
ROBUSTNESS TO DEPARTURES FROM
NORMALITY---- SOME CONSIDERATIONS
Various attempts have been made to extend the definitions of the
standard univariate capability indices to situations where the process
distribution is non-normal and corresponding estimation procedures have
items out of specification irrespective of the fonn of the process
distribution. No attempts have appeared in the literature, however, to
develop multivariate capability indices which are insensitive to departures
from multivariate nonnality. Some robust univariate capability indices and
procedures for assessing process perfonnance currently available are briefly
reviewed and an approach outlined for designing robust multivariate capability indices.
Chan et al. (1988) suggested the use of a tolerance interval approach
similar to that of Guenther (1985) to estimate, with a certain level of
confidence, the interval within which at least a specified proportion of items
is contained. This estimated interval is then used in place of the normal-theory based interval (some multiple of cr) in the expressions for
Cp, Cpk
and Cpm· The 100( 1-a )% confidence ~ -content tolerance interval isdesigned to capture at least I 00 ~ % of the process distribution, 100( 1-a )o/o
of the time by using appropriate order statistics. However, it was found by Chan et al. (1988) that the natural choice of~, 0.9973 and a, 0.05 results
in the requirement of taking sample sizes, n of 1000 or larger. To
circumvent this problem, they proposed the use of a tolerance interval with smaller
p,
specifically, that withp
= o. 9546 andp
= 0.6826 in place of4cr
and2cr
respectively in the expressions forc,n
L~k andc-;,,m,
and provided thecorresponding 95% confidence estimators for sample sizes less than 300.
Although this modification greatly reduces the minimum sample size
required, Peam et al. (1992) pointed out that 'it depends on the (somewhat
doubtful) assumption that the ratios of distribution-free tolerance interval
lengths for different
P
are always approximately the same as that for normaltolerance intervals'. Furthennore, the proposed extensions retain the process mean, µin the original definitions of
c;k
andcpm
rather than replacing it bythe median may differ considerably from the process mean for heavily
skewed distributions.
Another approach to analysing process capability for non-normal
processes (especially unimodal and fairly smooth distributions) is based on
systems or families of distributions. Having redefined the standard
CP
andcpk indices as
U-L
c
=-p
p
-P
0.99865 0.00135
and
C
pk -_ M. {
1nU - M
,M - L
}
Po.99865 -
M M -
Po.00135=
Min {
U -
Po
.
5
Po
.
5 -
L
}
Po.99865 -
Po.5 ' Po.5 -
Po.00135 'where P0 denotes the I OOo th percentile of the distribution, Clement (1989)
proposed fitting a Pearson-type curve to the observed data using the method
of moments and the percentiles required for computation of these indices
are then obtained from the fitted distribution. The required standardized
percentiles were tabulated for various combinations of the coefficients of
skewness and kurtosis. Some potential difficulties with this approach were
given by Rodriguez (1992). In view of the complexity and difficulty of
interpreting the equations for fitted Pearson and Johnson-type curves,
Rodriguez (1992) suggested the fitting of a particular parametric family of
distributions such as the Gamma, Lognonnal or Weibull distribution to the
prpcess data. For checking the adequacy of the distributional model, he
recommended the use of statistical methods based on the empirical
distribution function (EDF) including the Kolmogorov-Smirnov test, the
checking of distributional adequacy, he stated that this can be accomplished
by means of Quantile-Quantile plots or probability plots.
In
the same paper, he also briefly described the use of Kernel Density estimates for processcapability analysis, especially for non-normal distributions.
Peam et al. (1992) suggested a possible approach to obtain a robust
capability index by defining an index
where
e
is chosen such thatU-L
Ce=---8cr 'P
8 =Pr[µ-9cr
<
X
<
µ+9cr],
is as insensitive as possible to the fonn of the distribution of X. He showed
.,
that, for
Pe
=
0. 99 the choice of 8 = 5.15 is quite adequate for a wide rangeof distributions.
For non-nonnal multivariate processes, it seems reasonable to use
capability indices constructed based on multivariate Chebyshev-type
inequalities (see Johnson et al. (1976)) to reflect the process performance as
no normality assumption is required. The most basic type of these
inequalities is obtained by combining the Bonferroni and Chebyshev
inequalities as follows
:-For our purpose here, the Bonferroni inequality is given by
>
I -±Pr{
x
1
0
~µ
1
>
k}
J=l ... (4)
Upon applying the Chebyshev inequality to each tenn in the summation on
obtained:-··· (5)
Note that, for the same k, the lower bound for (5) is smaller than that for (4). However, this does not imply that the capability index constructed
based on inequality (5) is less conservative than that which is based on ( 4).
For the same lower bound, 1-8, the process rectangle based on the
multivariate Chebyshev-type inequality (5) is always larger (as a result of
larger k) than that of ( 4) irrespective of the underlying distribution. Note,
however, that the Bonferroni-type capability index proposed in this paper is
obtained by imposing a nonnality condition on the marginal distributions of
the process and thus it can be either too liberal or too stringent as a
performance measure for non-nonnal processes. For instance, a value
greater than I for this index does not guarantee that the expected proportion
of non-defective items is more than 1-8 if the process distribution is
heavy-tailed (such as a multivariate-! distribution) unless it is significantly different
from 1.
There are some improvements to the above multivariate
Chebyshev-type inequality, however, the expressions involved are complicated, causing
the construction of multivariate capability indices based on them to be
difficult except for situations where there are relatively few variables. It is
also found that these capability indices are only marginally better than that
based on inequality (5). Thus, it is reasonable to use (5) whenever the use of
CONCLUSIONS AND FURTHER REMARKS
In this paper, three bivariate capability indices have been proposed based on the relative area and position of the conservative process rectangle containing at least a specified proportion of items, and the specification rectangle. The development of the first involves the projection of a process ellipse containing a specified percentage of products on to its component axes whereas the other two are based on the Bonferroni and Sidak
inequalities respectively. Some calculations that fairly compare the three reveal that the latter two are superior to the fonner and that the Sidak-type capability index is marginally better than that based on the Bonferroni inequality. A reasonable test for the Sidak-type index has also been proposed and critical values provided for some chosen levels of
significance, sample sizes and acceptable percentages of nonconforming items. The computation of these indices is easier than other proposed indices and capability analysis methods. However, as with other
multivariate capability indices, it has not yet been possible to obtain the unbiased estimators and appropriate confidence intervals for the proposed indices except to note that for large sample sizes, it seems appropriate to replace the parameters involved with the usual sample estimates.
Further research in this area should perhaps focus on developing
exact multivariate capability indices which accurately reflect the process
conservative type of distribution-free capability index may be obtained by
use of the multivariate Chebyshev-type probability inequalities as
demonstrated. Although this is no better (more conservative) than the
Bonferroni-type capability index, the process rectangle containing at least a
specified proportion of items used for defining the index can be constructed
easily for any type of process distribution. If the underlying distribution for
each quality characteristic is known to belong to some well-known system
or family of distributions and hence appropriate quantiles may be obtained,
it is advisable to consider the use of the capability index constructed based
on the Bonferroni inequality ( 4) although in some cases, this might not be
REFERENCES
BARNETT, N. S. (1990). 'Process Control and Product Quality - The
CP
and
CP"
Revisited'. International journal of Quality and ReliabilityManagement, Vol.7, No.4, pp.34-43.
BOYLES, R. A. (1991). 'The Taguchi Capability Index'. Journal of Quality Technology, Vol.23, No.1, pp.17-26.
BOYLES, R. A. (1994a). 'Exploratory Capability Analysis'. Submitted to
Journal of Quality Technology.
BOYLES, R. A. (1994b). 'Covariance Models for Repeated Measurements
with Lattice Structure'. Submitted to Technometrics.
CHAN, L. K.; CHENG, S. W. and SPIRING, F. A. (1988). 'A Graphical Technique for Process Capability'. ASOC Ouality Congress
Transactions - Dallas, pp.268-275.
CHAN, L. K.; CHENG, S. W. and SPIRING, F. A. (1991). 'A Multivariate Measure of Process Capability'. Journal o.f Modeling and Simulation,
Vol.I I, pp.1-6.
CLEMENTS, J. A. (1989). 'Process Capability Calculations for
Non-Normal Distributions'. Ouality Progress, September, pp.95-100.
-FRANKLIN, L.A. and WASSERMAN, G. S. (1992). 'Bootstrap Lower
Confidence Limits for Capability Indices'. Journal of Quality
Technology, Vol.24, No.4, pp.196-210.
GUENTHER, W. H. (1985). 'Two-Sided Distribution-Free Tolerance
Intervals and Accompanying Sample Size Problems'. Journal of Quality
Technology, Vol.17, No. I, pp.40-43.
HUBELE, N. F.; SHAHRIARI, H. and CHENG, C-S. (1991). 'A Bivariate
Process Capability Vector'. in Statistical Process Control in
JOHNSON, N. L. and KOTZ, S. (1970). Distributions in Statistics :
Continuous Univariate Distributions 1, Vol.2, John Wiley & Sons, New
York, NY.
JOHNSON, N. L. and KOTZ, S. (1976). Distributions in Statistics :
Continuous Multivariate Distributions, Vol.4, John Wiley & Sons, New
York, NY.
JOHNSON, R. A. and WICHERN, D. W. (1988). Applied Multivariate
Statistical Analysis, 2nd ed., Prentice-Hall, Englewood Cliffs, NJ.
KANE, V. E. (1986). 'Process Capability Indices'. Journal of Quality
Technology, Vol.18, No. I, pp.41-52, Corrigenda p.265.
KUSHLER, R. H. and HURLEY, P. (1992). 'Confidence Bounds for
Capability Indices'. Journal of Quality Technology, Vol.24, No.4,
pp.188-195.
MARCUCCI, M. 0. and BEAZLEY, C. C. (1988). 'Capability Indices :
Process Performance Measures'. ASOC Quality Congress Transactions,
pp.516-523.
NICKERSON, D. M. (1994). 'Constn1ction of a Conservative Region From
Projections of an Exact Confidence Region in Multiple Linear
Regression'. The American Statistician, Vol.48, No.2, pp.120-124.
-PEARN, W. L.; KOTZ, S. and JOHNSON, N. L. (1992). 'Distributional
and Inferential Properties of Process Capability Indices'. Journal of
Quality Technology, Vol.24, No.4, pp.216-231.
· RODRIGUEZ, R. N. (1992). 'Recent Developments in Process Capability
Analysis'. Journal of Ouality Technology, Vol.24, No.4, pp.176-187.
SIDAK, Z. (1967). 'Rectangular Confidence Regions For The Means of
. Multivariate Normal Distributions'. Journal of the American Statistical
TAAM, W.; SUBBAIAH, P. and LIDDY, J. W. (1993). 'A Note on
Multivariate Capability Indices'. Journal of Applied Statistics, Vol.20,
Table 1.
p 8
I
B:P -_
~x~(8)
Zs12p
2 0.0025 1.0726 1.0727
0.005 1.0767 1.0768
0.01 1.0811 1.0815
0.02 1.0859 1.0867
0.05 1.0921 1.0945
3 0.0025 1.1325 1.1326
0.005 1.1397 1.1398
0.01 1.1475 1.1479
0.02 1.1561 1.1570
0.05 1.1677 1.1708
5 0.0025 1.2319 1.2320
0.005 1.2438 1.2440
0.01 1.2569 1.2574
0.02 1.2713 1.2724
0.05 1.2917 1.2953
10 0.0025 1.4218 1.4219
0.005 1.4419 1.4421
0.01 1.4641 1.4646
0.02 1.4886 1.4899
Table 2. Critical Values for Testing sc~~
a
n 0.01 0.025 0.05 0.1
10
*
0.5763 0.6093 0.6397 0.6770t
(0.5636) (0.5960) (0.6258) (0.6624)15 0.6284 0.6590 0.6869 0.7206
(0.6158) (0.6461) (0.6737) (0.7070)
20 0.6630 0.6918 0.7178 0.7490
(0.6507) (0.6794) (0.7052) (0.7362)
25 0.6884 0.7158 0.7403 0.7695
(0.6765) (0.7038) (0.7283) (0.7574)
50 0.7594 0.7820 0.8020 0.8254
(0.7489) (0.7717) (0.7918) (0.8154)
100 0.8178 0.8359 0.8516 0.8698
(0.8091) (0.8275) (0.8434) (0.8619)
*
unbracketed values correspond to 8 = o. o 1.Figure
1
.
Natural Process Ellipse centered at target having
the same area as MTR Specification rectangle