F
IVE
Y
EARS OF
S
OCIAL
S
ECURITY
R
EFORM IN THE
UK
Mike Brewer
Tom Clark
Matthew Wakefield
Five Years of Social Security Reforms in the UK
Mike Brewer, Tom Clark and Matthew Wakefield1
Draft: 12th July 2002
Summary
The current Labour Government was elected in 1997 with few specific social security proposals. This paper argues that after five years, consistent trends in social security policy have emerged: there is a willingness to increase benefits; a “work-first” focus; increasing centrality for benefits that relate to ‘need’, which has involved expanded means-testing; a downgrading of contributory benefits; and, a desire to reduce poverty by redistributing to particular demographic groups. Many of these characteristics of Labour policy, such as the size of caseloads or aggregate expenditure, are yet to show up in various aggregate data, and we argue that this is probably due to various counter-balancing socio-economic changes since 1997. Looking forward, we discuss what the introduction of new forms of means-test might achieve. We also suggest that it might be considered odd that Labour has left Housing Benefit and Council Tax Benefit unreformed, especially since a good chance to reform them without significant cost or low-income losers, has been missed.
JEL Classification: D31, I30, H24, H53 and H55
1 Mike Brewer and Tom Clark are senior research economists, and Matthew Wakefield is a research
1. Introduction
In 1997, the Labour Party was elected in the UK with few explicit and specific ideas about welfare reforms. But the next five years have seen the largest set of changes to the social security system in decades. After one parliament, it is now possible to see some consistent trends emerging that we might not have anticipated in 1997. This paper describes and analyses the reforms to social security, and some of the rhetoric that has accompanied them, in the UK since 1997. We do this to uncover some of the consistent trends that are now evident, and also in the hope that a retrospective analysis might show some lessons for future reforms.
We organise the paper as follows. In section two we provide an overview and characterisation of new Labour’s thinking and policy on social security. Section 3 turns to the official data, asking how these policies have affected social security spending and caseloads in practice. Section 4 considers the implications of five years of Labour redistribution for poverty and inequality. Section 5 discusses the administrative changes to the process of claiming and receiving benefits. Section 6 considers the prospects for reforming the main benefits that have not yet been reformed – housing benefit and council tax benefit. Section 7 concludes.
2. The first five years of new Labour social security policy
This section attempts to provide an overview and characterisation of new Labour’s thinking and policy on social security in its first five years of Government before we investigate Labour’s changes in some detail in Section 3. We argue that when the Government assumed power in 1997 a coherent strategy for social security reform had yet to be articulated, but that since that date a few key elements have emerged. We outline the initial stages of the development of the strategy in subsection 2.1, and describe the most consistent theme of policy and rhetoric since 1997 – an emphasis on paid work – in the next subsection. The remainder of the section discusses the other themes that emerged as policy matured.
2.1 The initial evolution of the new Labour position
Traditionally, the Labour Party had favoured extensive and progressive redistribution through social security, and had argued that this should ideally be done without recourse to means-testing. As late as 1992, at the heart of Labour’s election platform was a progressive rise in direct taxes to pay for an increase in the most important non-means-tested benefits – child benefit and the retirement pension.
means-testing. Inside government, he argued for a move towards social insurance instead – something a cost-conscious Treasury saw as unattractive. (Timmins, 2001, pp.559-70.) Field’s real objection to means-testing was to the dis-incentives he feared it created and to the behavioural and moral effects he believed these would have. Poverty- and unemployment-traps seemed to run up against the desire to strengthen work incentives; discouragement to saving ran contrary to the manifesto suggestion that there would be “reform to promote saving” and self-sufficiency; and, there could also be incentives to provide partial or false information.
Even whilst he was in office, however, the strategy that new Labour would eventually wholeheartedly embrace began to emerge: a social security system based ever-more clearly around ‘need’ rather than past National Insurance contributions (NICs). In practice, this implied expanded, rather than reduced, means-testing. In the March 1998 Budget, for example, the Government increased the means-tested safety net (income support) for families with children, but coupled this with reform and expansion of means-tested help for those working but above the income safety net (the introduction of the WFTC) so as to ameliorate the worst behavioural effects of means-testing. But the strategy was never explicitly enunciated while Field remained in office.2 Once Field had left the government, and with Alistair Darling as Secretary
of State at the DSS from July 1998, the extension and reform of means-testing finally became unequivocal government policy. Darling was at one mind with the Treasury in believing that “the important difference in social security is not whether [benefits] are insurance-based or means-tested, but whether or not they provide enough help to get people back to work and improve their lives”, and that income-testing was essential to ensure that “state spending … be concentrated where it is needed most”. 3
2.2 Encouraging paid work
Perhaps the only clear principle of social security that Labour did enunciate in the run-up to its election in 1997 was the centrality of paid work. This was seen as the “best way to tackle poverty”.4 Thus whereas the 1997 manifesto contained few
2 Timmins, 2001, pp.559-70.
explicit ‘welfare’ policies, the minimum wage and the ‘new deal’ for young people stand as major exceptions. Both were promoted as means to move people from welfare and into work. In part, the focus on paid-work-as-welfare reflected concerns about traditional progressive social security policy, especially in a context where containing public expenditure (and so ultimately taxation) was seen as central by the Government. In part, however, it was rationalised by a focus on the “new ethic of rights and responsibilities”5: the right to welfare assistance required fulfilment of responsibility to take available work. Gordon Brown spelled this out in February 2000 when he said: “to the unemployed who can work: we will meet our responsibility to ensure that there are job opportunities and the chance to learn new skills. You must now meet your responsibility – to earn a wage.”6,7
The encouragement of paid work was to be achieved in two ways. First of all, by ‘making work pay’- i.e. using policy to ensure in-work incomes were high enough to make paid work worthwhile – something that the minimum wage and the WFTC, for example, both aimed at doing. Secondly, as the ‘language of rights and responsibilities’ implied was justified, through increasing compulsion, something seen most explicitly in the new deal for young people, where receipt of benefit was made conditional on engagement in a labour market programme. Subsequently, pro-active encouragement of participation was extended to other groups. (See section 5). Similarly, the work capability test for Incapacity Benefit has been strengthened, with a view to reducing the number of recipients (DSS, 1998). Again, this can be seen as consistent with the view that anyone who can earn a wage should.
In practice, however, once new Labour’s strategy became clear, other principles, like poverty reduction also became central to social security policy. As this happened, the relative importance of the encouragement of paid work as an organising principle perhaps waned – in practice, if not rhetorically. In particular, in spite of the much trumpeted increases in in-work benefits, like the WFTC, for some groups of recipients the Government has also introduced increases in out-of-work benefits, like
5 Blair, 1999a. See also Labour Party, 1997 on this theme.
6 Speech made by Gordon Brown to the East London partnership, 29th Feb 2000.
7 Commentators noted the similarity between this and the message of the then-in-government Norman
income support, on a similar scale. Such benefit increases have been introduced even though, all else being equal, they discourage paid work. To understand why we need to consider other Governmental objectives.
2.3 Redistribution, poverty and different demographic groups
Redistribution and the shape of the income distribution were not an early theme of new Labour. Indeed, in 1997 the Prime Minister’s ambitions on poverty reductions seemed to be rather muted. He said, “if we don’t raise the standard of living of the poorest people in Britain we will have failed as a government.” (Blair, speech on opening of Social Exclusion Unit, 1997). In normal circumstances economic growth can be used to deliver an increase in the absolute incomes of the poorest, even without radical government intervention – indeed, the incomes of the poorest rose significantly under John Major’s premiership (Clark and Goodman, 2001). Even in 2001, the Prime Minister seemed ambivalent on the question of inequality. Asked whether it was “acceptable for the gap between rich and poor to widen”, he failed to contradict the suggestion. Instead, he argued that “the key thing is not … the gap between …the person who earns the most in the country and the person that earns the least” and he once again restricted his concern to ensuring that “people on lower incomes” were getting better-off.8
The apparent similarity of the Prime Minister’s statements at the start and the end of the 1997-2001 Parliament actually masks a sea-change in new Labour’s underlying policy on redistribution. In particular, since 1997 the Government has explicitly identified its desire to reduce relative income poverty for children and pensioners. Having rarely mentioned poverty in the early stage of the government, Tony Blair announced an aspiration to eliminate child poverty within a generation in May 1999. This soon became a 10 year economic ambition for the Treasury to halve child poverty, and a public service agreement for the Treasury and the old DSS (now the DWP) to reduce it by at least a quarter by 2004.9 The aim has not been quantified
8 P10 Transcript of BBC Newsnight interview with the Prime Minister, 5th June 2001. Available from
http://news.bbc.co.uk/hi/english/events/newsnight/newsid_1372000/1372220.stm.
9 The target to reduce the number of children in poverty by “at least a quarter by 2004” is to be
for pensioners: the Government merely wants to “tackle pensioner poverty” (DSS, 2000b).
The particular relative poverty lines that the Government has emphasised most – which define poverty as living in a household with an income of less than a certain fraction of the median – effectively commits the Government to a reduction in inequality in the bottom half of the income distribution, at least for children and pensioners. And the focus on pensioner and child poverty actually goes a long way towards a pledge to help the poor in general – 70% of the poorest 4 deciles of families contain either a child or a pensioner. So, although the Government is not explicitly committed to reducing inequality, the targets on child and pensioner poverty actually commit it to increasing – in relative terms – the incomes of the majority of the poor. The Prime Minister’s apparent indifference to the general gap between the rich and poor, therefore perhaps sits rather oddly with these targets. It is not necessarily an incoherent position, however. It could be that the government does care about the distance between the bottom of the income distribution and the middle, but not between the middle and the top. Another explanation is that the Government believes that – even though they jointly constitute a majority of the poor – pensioners and families with children are special cases, where concern for relative incomes is justified. It could be that children and pensioners are seen as unable to affect their own incomes through work, and so it is right that they should be helped through benefit increases. By contrast, work could still be viewed as the best form of welfare for most working-age adults.
The Government’s client-group-specific approach could instead have been driven by a desire to maintain popular support for its progressive benefit increases. The public might share the view that it is appropriate to support children and pensioners through benefits. Also, redistribution to these groups is effectively redistribution over the ‘life-cycle’, meaning very large numbers of people will expect to benefit from it at some stage in their life. This might make it easier to gather
support for the approach. Another explanation for the apparent incongruity between the Government’s attitudes to income inequality and to relative poverty is that the Government is not yet clear on its position towards poverty, and has not yet found a way of defining poverty it that it is comfortable with. Its annual poverty report,
Opportunity for All, contain 31 indicators of poverty (see DWP, 2001b, for example), but these do not define a poverty line that separates the population into the poor and the non-poor, and at the time of writing, the Government was consulting on other ways of measuring and defining poverty (see DWP, 2002b, and Brewer et al, 2002, for a brief overview of these).
2.4 How much social security spending?
In his 1996 ‘covenant’ with the British people Tony Blair announced, “I vow we will have reduced the proportion [of national income that] we spend on the welfare bills of social failure”.10 This was not quite an explicit commitment to reduce social security as a share of GDP, but it seemed to crystallise contemporary perceptions that Labour regarded controlling the level of social security spending as a central aim.
In Labour’s first months in Government, benefit increases did not seem to be on the political agenda, largely because of the Government’s commitment to stick to the previous Conservative Government’s very tight spending plans for its first two years in office. Indeed, such was the desire to rein in spending that the Government risked the wrath of its backbenchers and core supporters in pushing ahead with a cut in one-parent benefit, initially proposed by the Conservatives. Bizarrely, this benefit cut involved taking money away from the major demographic group that the Government has since done most to help. In addition, the fact that the cut involved a simultaneous reduction in means-tested and universal support made it harder to sell as part of a strategic ‘rationalisation’ of the benefit system. Rather, for a time it seemed that the Government really believed that social security needed to be reined back, even if some very poor families lost out as a result.
Very soon afterwards, however, things began to change. In the March 1998 Budget the WFTC was unveiled, implying significant real increase in means-tested support for families with children. Interestingly, however, this increase in means-tested support was promoted as being very different from a conventional benefit increase. The WFTC ‘rebadged’ family credit as an income tax cut, allowing the Government to continue to avoid being seen as increasing welfare spending. The Government has sometimes chosen to highlight public finance figures that include this reclassification, meaning that a given system of redistribution can be associated with a lower tax burden. As Labour’s term in Government progressed, ‘credits’ were given an ever-greater role in the transfer system, raising the prospect that ever-more benefit spending could be reclassified as tax credits. In practice, however, it now seems to have reached the limits of this process. The new Pension Credit will count exclusively as spending in all official accounts, and so too will the great bulk of the redistribution done through the new credits for children and low-paid workers. This might simply be a pragmatic response; the Office for National Statistics refused to reclassify the WFTC as a tax cut in the Blue Book, leading to a tension between different government figures which could have cancelled out any presentational gains from the classification. Alternatively, perhaps the Government is now more relaxed about increasing, and being seen to increase, social security spending as a way to meet its distributional objectives. (See Appendix C on the accounting treatment of credits).
From March 1998 onwards, however, tax credits have been a long way from being the full story. In that Budget the Government also started the introduction of significant and more general benefit increases when it quietly stated that income support for families with children was to rise. Since 1998 a large range of changes to the benefit system have been introduced, the most important of which (although not all) have had the effect of increasing spending. As we will see in the following sections, however, a change in the balance between different types of social security spending has been crucial.
2.5 The expansion of means-testing
the next Labour Government to achieve what in 50 years of the welfare state has never been achieved. The end of the means test for our elderly people" (Brown, Speech to the Labour Party Conference, Brighton, 1993). Yet when in power expanded means-testing – together with the emphasis on work and the willingness to increase benefit rates – has become one of the hallmarks of new Labour’s social security policy. The Government has not only increased means-tested benefits rates, but has increased them by far more than other benefits.
The main means-tested benefits changes were as follows. Income support rates for families with children and for pensioners, and support for low-paid families with children, have all risen very substantially in real terms since 1997 (see Table 1). Income support rates for a lone parent with two children under 11 will be 33% higher at the end of 2002 than they were in 1997 – even allowing for inflation and including the abolition of the lone-parent premium. The maximum WFTC rates for the same “specimen family” is 44% higher in real terms than the equivalent 1997 family credit rates. Income support rates for pensioners – now the ‘Minimum Income Guarantee’ – have also risen considerably between 1997 and 2002: by 31% for a single pensioner under 75, and 25% for a pensioner couple where one is aged 75 or over, for example. All these increases dwarf the real increases over the first 9 years of the operation of these benefits (1988-1997). Means-tested benefit premiums for people with disabilities and carers were also increased above inflation in 2000/1 and 2001/2 respectively.
Table 1. Maximum means-tested benefit and tax credit awards for some “specimen” families
Family type April 2002a Real
increase, 1988–97
Real increase, 1992–97
Real increase, 1997–2002a
Single person £53.95 1% 2% 1%
Lone parent, two children under 11 £142.70 4% 2% 33%
Low-income working lone parent, two
children under 11b £112.90 11% 2% 44%
Single pensioner under 75 £98.15 7% 6% 31%
Couple pensioner over 75 £149.80 11% 6% 25%
a Includes increases announced in Budget 2002 due in October 2002. b Shows maximum FC/WFTC
award assuming part-time work and no eligible childcare costs. Note: Real increases calculated using ROSSI index.
These very large – and, in recent times, unprecedented – increases in means-tested benefits were accompanied by much smaller increases (in terms of percentage increases in maximum entitlement) in non-means-tested benefits. And the increases in non-means-tested benefits that there have been have often seemed like one-offs, further suggesting that they are not central to the Government’s social security strategy. The real increase in child benefit leaves the benefit about 25% (about £3.20 in real terms) higher than it would have been. But the increase – in April 1999 – was restricted to the first child, and has proved a one-off. Other increases in support have been introduced through new payments of non-means tested support to pensioners: a winter allowance that now provides £200 a year paid in a lump-sum, and free TV licenses for the over 75s. Again, these certainly seemed like one-off measures, and certainly not a basis on which to proceed with strategic social security reform. We consider the retirement pension in the next subsection, but the increase in this was relatively modest, and also seems to have been one-off. Furthermore, there have been a number of cuts to various non-means tested benefits – including incapacity benefit and some bereavement benefits. We will consider these in a bit more detail in the next subsection, but for now the significance is that they have further increased the relative reliance on means-testing.
government’s goals equally cost-effectively. But more than 50% of all families contain a pensioner or a child, and, indeed, couples with children and pensioner couples are no more likely to be poor than average, (see Table 2). This suggests
general increases in support for children or pensioners would involve redistributing significant sums to families which are not poor, which may help explain why the government has used income testing to target its extra support.
Table 2. Families with children and pensioners in the income scale
Family type % of family type with income
below 60% median
Pensioner couple 22
Single pensioner 27
Couple family with children 19
Lone-parent family 54
Couple family without children 11
Single adult without children 22
Average 22 Source: Table J1 of Department for Work and Pensions, 2002c.
Once the broad strategy of increasing means-tested benefits had been accepted, the debate in the second half of Labour’s first term shifted on to the more detailed issues of how to ameliorate the weaknesses of the approach. Many of the most important issues concern incentives of various types. Possible tax and benefit integration has sometimes been mentioned as a way of tackling certain problems, (and was being discussed even early in Labour’s period in office, see HM Treasury, 1998). A recent focus has been on how means-tests can be designed to minimise the burden that they impose on benefit claimants,11 and we discuss this issue in section five. One or two
other points are worth touching on briefly here. One is the fact that – given that the Government has kept the means-tested benefit system’s reliance on family income assessment – it has involved an expansion of joint testing. The Government has been open about the change. Alistair Darling has argued that: “going away from joint assessment is to raise the obvious point of the duke and the duchess. The duchess has no money but the duke has millions. Do you say that you should pay the duchess income support or do you say that the duke has an obligation to his family that the state does not always have to have?” cited in House of Commons, 2000, para 90).
Another concern with extended means-testing is that it may undermine broad coalition of political support for the welfare state which universal benefits arguably promote. The extension of means-tested benefits might lead to a drop in support for the welfare state as the benefits are concentrated at the bottom of the income distribution, and so offer little to the supposedly crucial voters of so-called “middle Britain”.12
The Government has at times been characterised (or has characterised itself) as responding to this political risk in two ways. First, it has tried to maintain support for the welfare state by increasing funding to the universal services (notably health and schooling) that the middle classes most care about, whilst at the same time increasing the re-distributive nature of the financial support provided by the state. The oxymoron “selective universalism” has been coined to describe this approach, (see Timmins, 2001, p.574, for a fuller discussion). Secondly, it is reforming the system of financial support itself in a way that will help to maintain a broad base of support. Some benefits have been structured in a way that, in the words of the Chancellor, “helps all and is at the same time progressive - a progressive universalism”13. This label has been used most frequently to describe the set of benefits that are being put in place to support families with children, and also the proposed structure of endowment payments into Child Trust Fund accounts.14 But the pattern of “something for all but
more for the poorest” also applies to the government’s reforms for its other “favoured group”: pensioners. This universalism might help popular support by extending the gains from benefits up the income distribution. As more people become claimants this might also make it more socially acceptable (less stigmatising) to claim benefits. Around 90% of all families with children will be eligible for the Child Tax Credit and the Government hopes that this will “remove the stigma attached to claiming the traditional forms of support for the poorest families by creating one system of income-related support for all families with children” (Inland Revenue, 2001b, para
12 We put this term of journalese in inverted commas since, according to most (implicit or otherwise)
definitions used by the media, “middle Britain” is populated by moderately high-earners who are well into the top half of the income distribution.
13 Speech by Gordon Brown to the National Council for one-parent families, Tuesday 5th December
19). The introduction of the pension credit might have similar effects since it is estimated that slightly more than half of all pensioners will be eligible.
We argued above that a focus on pensioners and children might in itself be a way of maintaining popular support for increased social security benefits, even aside from a “progressively universal” structure. On the other hand the ‘work-first’ approach has implied not similarly extending means-tested benefits for working-age adults, and sometimes making the conditions that must be satisfied in order to claim them stricter. This could be seen as a conflicting message on the merits of social security safety-net benefits, especially where criticism of a ‘dependency culture’ (Blair, 1999b) has been used to justify reforms, (see Lister, 2001a,b). Incentives, joint assessment and the question of public support aside, it may also be argued that a means-tested approach cannot be appropriate to achieve some desirable ends for a social security system. To correct market failures such as the moral hazard at which precludes the supply of unemployment insurance, for example, a universal approach seems to be required. Non-means-tested benefits might also be appropriate if it is desired that the state help people to bear certain costs such as those of bringing up a family or those imposed by disability. The government is not proposing the abolition of all non-means-tested social security, but it would seem appropriate that there be more debate about the balance that is being struck. Such a debate must consider what functions the social security system is intended to fill.
2.6 The decline of the contributory principle
decline of the contributory principle, at least in the sense in which we have defined this principle.15
What changes have there been to contributory benefits? Most importantly, there have been some long-term significant cuts in contributory benefits, notably incapacity and bereavement benefits. Since 2001, new awards of incapacity benefit have been reduced by 50p for each £1 of private pension income claimants have in excess of £85 a week, a form of partial means-testing. At the same time that this was introduced, payment of the benefit also became contingent on having worked and paid NICs on more than a minimum level of earnings in one of the last three years, rather than at any point in one’s working life. The second element of the reform is a change in the way that the contributory principle operates with respect to this benefit, but the former is a definite step back from the principle that benefit receipt be a function of cash contributions and non-financial circumstances, rather than current income. Both elements contributed to a retrenchment of this contributory benefit: the reform package was originally intended to eventually save one-fifth of the incapacity benefit bill, although amendments reduced this figure. 16 Changes to the system of benefits for widows (now bereavement benefits) sharply reduced their long-term cost (even after allowing for the cost of making men eligible for the first time), principally by paying the new bereavement allowance – the old widow’s pension – for a year only rather than until remarriage. These should eventually save £500m a year.17 More
recently, in Budget 2002, it was announced that child additions to contributory benefits would be abolished, another benefit cut.
A second set of changes to contributory benefits is that some National Insurance benefits have been made to look more like universal benefits. For example, the maternity allowance has been extended to mothers with incomplete contributions records. Likewise, people who have been severely disabled from a young age – and so were never able to build up a contribution record – will now nonetheless be able to claim incapacity benefit. Thirdly, in the area of the ‘second-tier’ of state pension
15 ‘Furthered’ the decline because the contributory principle in UK social security policy has been
waning since (at least) 1961 when income-related NICs were introduced.
16 The savings also came from changing the way that the work capability test operated.
17 Both, though, are long-term, changes, applying to new claimants only. The incapacity benefit
provision, the Government is replacing the old SERPs system with the State Second Pension. For people who choose to remain part of the second-tier state system the link between benefit entitlement and the contributions paid will be weakened.18
In addition to changes to the contributory benefit system there have also been changes to the system of NICs which operate in the same direction. For example, the last remnants of Beveridge’s flat-rate system of contributions (seen as fair because they were financing flat-rate benefits) was abolished with the scrapping of the ‘entry-fee’ – a minimum charge that all workers had to pay to be in the National Insurance benefit system. In addition, the Government has started paying National Insurance ‘credits’ for some low-paid workers.19
A final way in which we can see how far the contributory approach is from the Government’s thinking becomes clear when we consider the non-means tested benefits which have been increased. True, the real value of the (contributory) basic state pension was increased (by about 6.5% or £4.60 for a single person). But it was introduced only in the aftermath of a strong public reaction to the Government’s earlier decision to stick with default indexation even where this had implied a weekly increase of just 75p. Indeed, it was explicitly put forward as a one-off interim measure designed to get extra cash to pensioners with moderate incomes before the new Pension Credit system could be made effective.
The other major increases in means tested benefits have been to non-contributory benefits. For example, in the case of pensioners the Government decided to institute a new annual (and non-contributory) £200 winter-fuel allowance, even though the distributional effects are almost indistinguishable from an increase in the state pension. Free TV license to the over-75s could also easily have been emulated through an increase in the basic pension. Other non-contributory benefits, which deal with the meeting of specific costs – like Child Benefit and Disability Living Allowance – have also been made more generous.
18 This is because the contracted-out rebate will remain earnings related while the benefit will be
In summary we have seen reforms to the contributory benefit system – on both the benefit and contribution side – which weaken the link between what is paid in and what is paid out. This constitutes a weakening of the contributory principle. The tendency to spend any available extra resources on benefits that relate to current circumstances rather than to past contribution records, has strengthened this trend. The most important benefit increases have been to the main means-tested benefits, which depend on current financial and other circumstances; but we have also seen that some non-means tested benefits have increased, but that these too relate only to one’s non-financial current circumstances (in terms of health, age, or children) not one’s contribution record.
To some extent the decline of the contributory principle is the inevitable flipside of targeting – which means, after all, that payments are directed on the basis of a family’s financial or other needs. This is certainly how the Government sees it: the decisions to means-test incapacity benefit, to reduce the value of bereavement benefits, and not increase the real value of the basic state pension for three years were all defended as methods of targeting social security spending (House of Commons, 2000, paras 74-76). Whether we should worry about the trend we have identified here is a complex matter, and not one we will attempt to deal with in a descriptive paper such as this. In one sense, however, it does fit rather oddly with Labour’s declared strategy of bringing about the “end of a something for nothing welfare state” (Blair 1999a). Benefits paid in return for financial contributions might be thought of as something that epitomises a ‘something for something’ system.
2.7 Next steps
The trends we have identified look set to be continued over the next Parliament through the three new credits due to be introduced by the Government in 2003. These are: a pension credit, which will increase means-tested support for pensioners and
19 This occurred when the Government increased the level of the income tax personal allowance. To
reduce the 100% benefit withdrawal rate in the Minimum Income Guarantee (MIG, which is income support for people aged over 60); a new child tax credit, which will bring together child-related support currently delivered through income support, WFTC and the existing children’s tax credit; and a working tax credit for all adults in work on low incomes, regardless of whether or not they have children or a disability (see Brewer et al, 2001, and Clark, 2002). These new credits imply further increases in means-tested benefit expenditure. It is projected that once the credits are fully implemented in 2004/5, expenditure on them will be £4-5 billion a year greater than expenditure on the benefits that they replace. Furthermore, their real cost will grow over time as the Government has promised to increase the new pension credit and the Child Tax Credit in line with earnings, presumably to help it hit its poverty-reducing targets. The innovative feature of both the new tax credits and the pension credit is the way that they will be means-tested, and this is discussed more in Section 5.
3. Social security spending and the numbers receiving benefits
We have argued in the last section that Labour has increased benefits, and that it has also introduced policies which should have had the effect of rebalancing the social security system – increasing the reliance on means-tested benefits, and downgrading the role of contributory benefits. In the light of this characterisation we now turn to official data to see what has happened to benefit expenditure and receipts.
3.1 Total Social Security spending
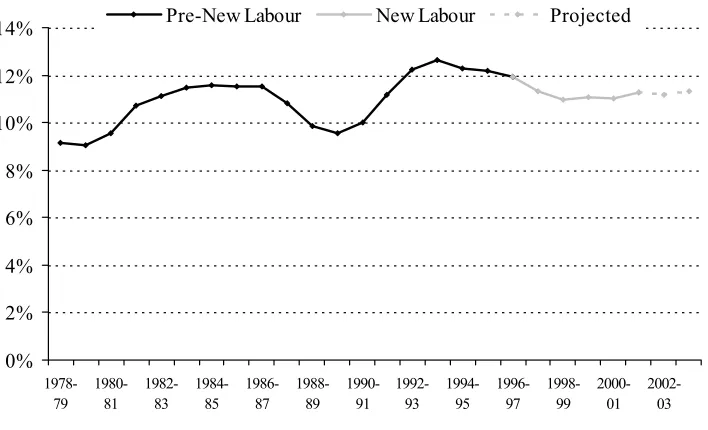
Overall, real social security spending has increased substantially since the introduction of the modern welfare state in the 1940s, both in real terms and as a share of national income. The figure charts social security as a share of national income since 1978/79 and goes through till 2003/04 on the basis of official projections. (See box below on our treatment of the tax credits).
In the two decades before Labour came to power, social security spending as a share of GDP fluctuated strikingly with the economic cycle. In spite of the Government exerting a tight grip on benefit rates during these years – with a considerable number of benefit cuts, and real increases relatively few and far between – there was, however, a seeming secular trend upwards, so that total social security spending had risen from about 9.2% of GDP in 1978/79 to 11.9% in 1996/97.
Figure 1: Spending on benefits as % GDP, 1978/79 –2003/04
0% 2% 4% 6% 8% 10% 12% 14% 1978-79 1980-81 1982-83 1984-85 1986-87 1988-89 1990-91 1992-93 1994-95 1996-97 1998-99 2000-01 2002-03
Pre-New Labour New Labour Projected
Source: Authors’ calculations from HM Treasury (2002) and DWP (2002a).
Under Labour, the proportion of GDP spent on benefits initially fell - down to 11.0% in 1998/99 - due to the combination of a continued freeze in almost all benefit rates with a buoyant economy and falling unemployment. However, after 1998/99 the policy of increasing benefit rates starts to show up. In spite of continuing falls in unemployment and economic growth, social security spending in the economy stopped falling and even rose modestly, returning to 11.3% in 2001/02. Of course, given that the economy was growing overall, stability in the share of it that social security expenditure represents – as we have roughly seen in the last few years - implies a growing budget in real terms. It is also interesting, therefore, to look at what happened to real social security spending.
In Labour’s first two years in Government total real social security spending actually fell from £104 to £102 billion (2001/2 prices). This was because falling unemployment and rising incomes reduced welfare costs, while there were few significant changes in benefit rates. Since then, however, the story is very different, as the increased generosity of benefits came to dominate the path of social security spending. It is forecast to continue to increase in the foreseeable future. The real increase over the 5 year period 1998/99 – 2003/4 is set to be 17 per cent, an annual average of 3.2 per cent, increasing the budget from £102 bn to £119bn. Looking at the whole 7 year period from 1996/7 – 2003/4 the real increase is set to be just 14 per cent, implying average growth of just 1.9 per cent increase a year. By historical standards this remains extremely low – since the 1940s social security spending has tended to grow at an average annual rate of around 4%.
3.2 Have we seen a rise in means-testing?
What determines the number of people claiming means-tested benefits and their total cost? There are four potential factors: demographics, affecting the size of groups – such as pensioners and families with children – that tend to rely on state support; economic changes affecting, for example, the number of people who are in work, the wages that they receive and the coverage and level of private pensions; the generosity of means-tested benefits, as an increase in generosity means that more people are entitled; and the proportion of those entitled who actually take-up a means-tested benefit.
Starting with the last of these, government estimates suggest that take-up rates for out-of-work benefits have changed little over recent years, at around 83% for pensioners and 98% for lone parents on income support, where take-up is measured as actual expenditure on the particular benefit as a proportion of the estimated expenditure with full take-up.20 For this reason, we characterise the two main factors affecting caseload and expenditure as being “the economy” (a shorthand which captures both the demographic and economic factors that determine the pre-transfer household income distribution) versus discretionary social security policy changes. 21
We look first at the number of people receiving a means-tested benefit. Table 3 shows administrative data on claimants of some means-tested benefits, as well as some analysis of the number of families on any of the main means-tested benefits. The impact of the strong economy and the discretionary policy changes affecting New Deal participants can be seen in the substantial fall in JSA claimants. Between 1997/8 and 2000/1, the number of people over 60 claiming income support fell slightly, as the impact of rising incomes amongst pensioners exceeded that of the discretionary increases in generosity. From 2000/1, though, caseloads rose as the impact of the
20 The situation is a little more complicated for WFTC. The government’s first prediction of 1.4 million
discretionary policy changes dominated (the justification for the last clause follows in Table 4). For families with children, the number of lone parents claiming income support has fallen, reflecting rising employment rates, but the number of families claiming FC/WFTC has risen, reflecting both increased employment and the discretionary increases in generosity (the policy changes were more significant overall, as the number of children in a family receiving either income support or FC/WFTC grew by 14% between late 1998 and 2001). The number of housing benefit and council tax benefit claimants – which are both available to claimants of all ages, whether or not they work – have fallen as pre-transfer incomes have risen despite small, offsetting, increases in entitlement for families with children and people over 60.
21 Of course, some social security policy changes may have induced changes in employment rates and
Table 3. Numbers of families on key means-tested benefits, 1997–2001 (GB)
Caseload (thousands) in:
May 1997 May
2001 2001 Nov Change, May 97–Nov
01
Individual means-tested benefits
Jobseeker’s allowance (all) 1,562 942 889 -42%
Jobseeker’s allowance (income-related) 1,225 701 800 -35%
Income support, of which 3,958 3,928 3,950 -0.2%
over-60s 1,720 1,717 1,741 +1%
disabled (under 60) 827 1,017 1,044 +26%
lone parents (not disabled) 1,013 888 867 -14%
FC/WFTC 747 1,215 1,247 +67%
Housing benefit 4,640 3,874 3,816 -18%
Council tax benefit 5,543 4,671 4,608 -17%
All benefits by client groups (see notes below for exact definition)
Working-age adults 6,374 6,174 6,131 -4%
Children n/a (4,363
in Nov 98)
4,948 4,982 a n/a (+14%
from Nov 98 – August 01) a August 2001.
Notes: “Working-age adults” includes adults claiming WFTC/DPTC or their predecessors, jobseeker’s allowance (JSA), incapacity benefit (IB), severe disablement allowance (SDA) or disability living allowance (DLA). Of these, IB, SDA and DLA are not means-tested benefits. “Children” counts dependent children in those families.
Source: Authors’ calculations from various DWP/DSS/IR quarterly statistical enquiries.
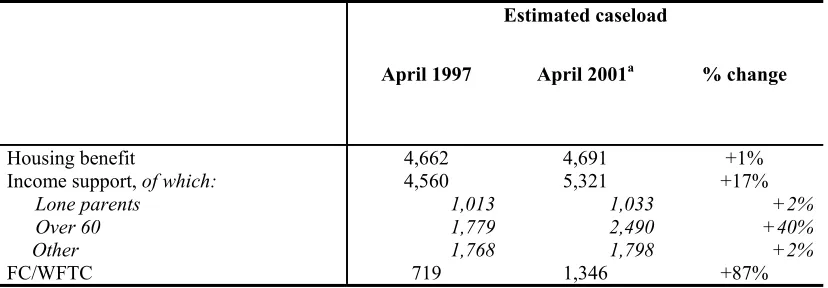
Table 4. Effect of policy changes on numbers of families entitled to means-tested benefits
Estimated caseload
April 1997 April 2001a % change
Housing benefit 4,662 4,691 +1%
Income support, of which: 4,560 5,321 +17%
Lone parents 1,013 1,033 +2%
Over 60 1,779 2,490 +40%
Other 1,768 1,798 +2%
FC/WFTC 719 1,346 +87%
Notes: The estimates were based on Family Resources Survey data from 1997/8, and so measure changes in entitlement assuming full take-up abstracting from changes in demographics.
a Includes increases announced in Budget 2001 due later in 2001. In addition to this, the pre-announced
increases in income support for the over-60s due in April 2002 will mean a further 0.1 million families will be entitled to income support.
Source: authors’ calculations.
We can extend the micro-simulation further into the future, and investigate the impact of changes to social security policy between 1997 and 2003 on the proportion of families entitled to a means-tested benefit, holding demographics constant (and keeping incomes fixed in real terms): we estimate this to have increased from 17% to 29%. 23 Focusing on couples, the increase is from 17% to 49%; as means-testing as done at a family level, this is also an estimate of the increase in the proportion of couples who face joint assessment on some part of their incomes through Labour’s reforms (these proportions correspond to 2.4 and 6.8 million couple families).
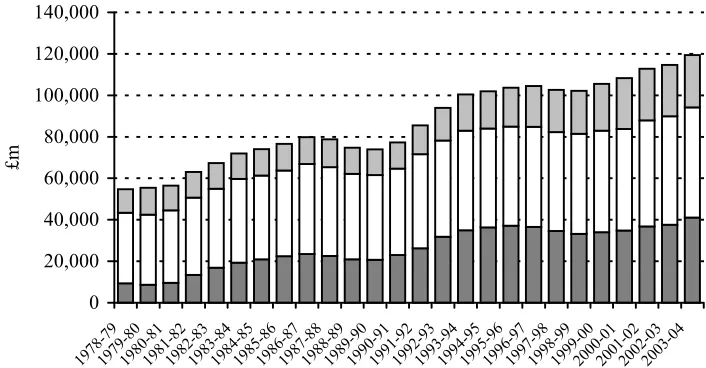
Similarly to the data on caseloads, data on the level and composition of social security spending do not yet reflect increases in the rates of means-tested benefits as clearly as might have been expected given the size of the increases. Figure 2 shows actual spending split between means-tested, contributory, and means-tested, non-contributory benefits (using official definitions repeated in Appendix C). As discussed in Appendix C, we include spending on the WFTC and the new tax credits in our
22 When data from 2001/2 becomes available, it will be possible to attempt a fuller decomposition than
presented here.
23 Our definition of a family is an adult over 18, their partner (if they have one) and their dependent
definitions in order to avoid a structural break. Since 1979, means-tested benefits have increased in importance, and contributory benefits declined in importance.24
Figure 2: Real social security spending, 1978-2003 (2001/02 prices)
0 20,000 40,000 60,000 80,000 100,000 120,000 140,000
1978-791979-801980-811981-821982-831983-841984-851985-861986-871987-881988-891989-901990-911991-921992-931993-941994-951995-961996-971997-981998-991999-002000-012001-022002-032003-04
£m
Means-tested Contributory Non-means-tested, non-contributory
Source: Authors’ calculations from DWP (2002a) adjusted to include spending on tax credits.
Notes: the definitions of means-tested, contributory and non-means-tested, non-contributory benefits is given in Appendix A. Includes WFTC spending. Figures for 2001/2 and beyond are forecasts. Does not include the benefit increases announced in Budget 2002, nor all the parts of the new tax credits.
It is projected that real spending on all three types of benefit will be higher in 2003/4 than 1996/7: non-means-tested, non-contributory benefits will see the fastest increase from the lowest base. Between 1997 and 2003, spending on means-tested benefits as a proportion of all benefits is expected to fall by 0.6 percentage points, with the share of spending on non-means-tested, non-contributory increasing by 1.2 percentage points. Again, there is a dramatic difference between the out-turns and the predictions that hold demographics and incomes constant and assume full take-up: our micro-simulation model suggests that Labour’s policy changes between 1997 and 2003
24 Just after the second world war, 60 per cent of social security spending went on contributory
alone would increase expenditure on means-tested benefits by around 50 percent, compared with the actual change of 13 percent. 25
Breaking social security spending down by the type of recipient reveals more.
26 As a proportion of the total, social security spending on children and on pensioners
are both forecast to increase between 1996/7 and 2003/4: from 12.7% to 15.3% and from 50.9% to 53.9% respectively. 27
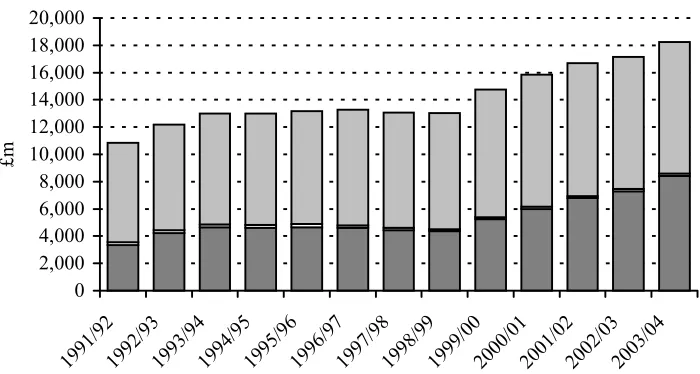
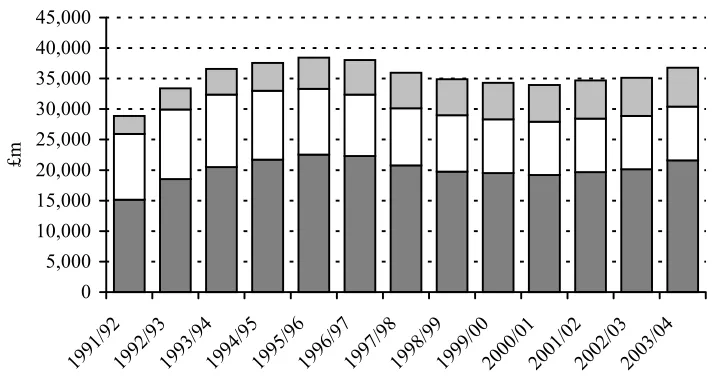
Spending on children is expected to increase by 37 per cent between 1997 and 2003. In this period, means-tested benefit spending on children grew at a much faster rate than the other types of benefit (see Figure 3): including the new tax credits, spending on means-tested benefits is forecast to increase by £4 bn by 2003/4 from 1996/7, compared to £1.2 bn extra on child benefit and the other non-means-tested, non-contributory benefits. In proportional terms means-tested benefits will have increased their share of the spending on this group from 35% to 46%, while non-means-tested, non-contributory benefits have declined from 63% to 53%. The data show that the increases in child-related support for non-working and low-paid working families much more than offset potentially falling benefit expenditure as parents’ employment rates rose.
25 Means-tested benefits defined as in note 23.
26 The categories are defined in the original source. Note that payments to families with children have
been split between “working age” (to reflect the components of, for example, income support for families with children that supports the parents) and “children”, although the methodology has not been published. In addition, we have had to assume how the spending on WFTC and the new tax credits will be split.
27 Source: data underlying Figure 2. Between 1991/2 (the earliest date at which we have this data) and
Figure 3: Social security spending on children
0 2,000 4,000 6,000 8,000 10,000 12,000 14,000 16,000 18,000 20,000
1991/921992/931993/941994/951995/961996/971997/981998/991999/002000/012001/022002/032003/04
£m
Means-tested Contributory Non-means-tested, non-contributory
Source: Authors’ calculations from DWP (2002a) adjusted to include spending on tax credits.
Figure 4: Social security spending on working age
0 5,000 10,000 15,000 20,000 25,000 30,000 35,000 40,000 45,000
1991/921992/931993/941994/951995/961996/971997/981998/991999/002000/012001/022002/032003/04
£m
Means-tested Contributory Non-means-tested, non-contributory
Source: Authors’ calculations from DWP (2002a) adjusted to include spending on tax credits.
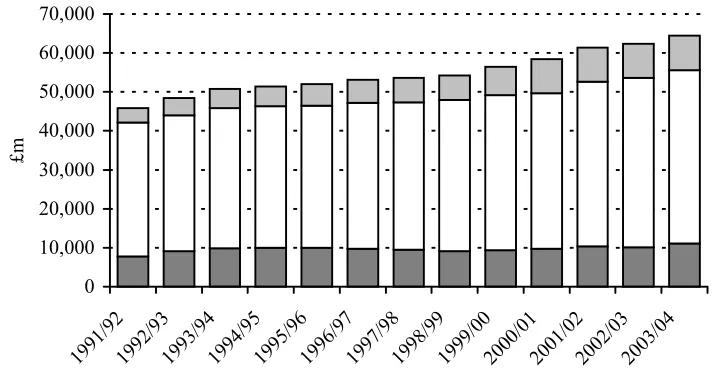
For the over 60s, benefit expenditure has continued its long-run trend of increasing in real terms, by 21 per cent over the 7 year period. Of the three benefit types non-means-tested, non-contributory benefits have grown at the fastest rate, principally due to the discretionary policy changes of the winter allowance and free TV licences. There was little change in spending on means-tested benefits for the over 60s between 1997/8 and 2000/1, as the impact of rising incomes amongst pensioners exceeded that of the increases in generosity of income support. From 2000/1 the impact of the discretionary policy changes have outweighed rising incomes, though. The introduction of the pension credit – which comes into operation midway through 2003/4 – makes it very likely that means-tested benefits will grow in importance. 28
28 Indeed, the cost of the pension credit alone could vary between 0.1% of GDP and 1.1% of GDP by
2040, depending on whether the minimum income guarantee is uprated with prices or earnings beyond 2006. See: Department for Work and Pensions, The Pension Credit: Long-Term Projections,
Figure 5: Social security spending on pensioners
0 10,000 20,000 30,000 40,000 50,000 60,000 70,000
1991/921992/931993/941994/951995/961996/971997/981998/991999/002000/012001/022002/032003/04
£m
Means-tested Contributory Non-means-tested, non-contributory
4. Incomes, poverty and inequality under Labour
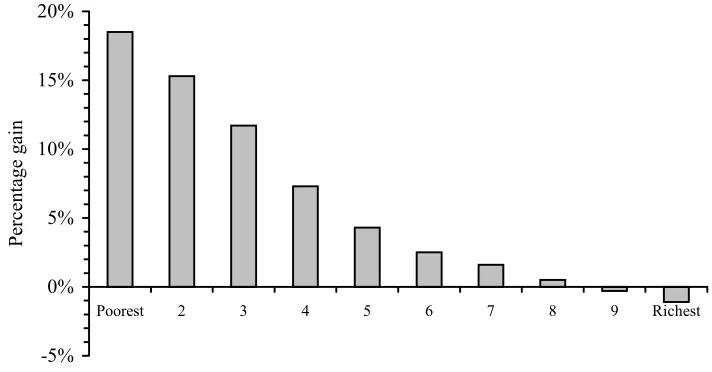
This section considers the redistribution achieved by Labour’s reforms. The results we present include the effect of all of the changes to direct personal taxes, and most of the social security reforms, but hold economic and demographic changes constant (in other words, it is on the same basis as Table 4). 29 Figure 6 shows the average change in disposable income from reforms to personal taxes and benefits in the budgets between 1997 and 2002 by deciles of the income distribution. The pattern of effects from the reforms is strongly progressive – proportional gains fall steadily as incomes rise, and become average losses amongst the top 20%.30 Gains in the bottom thirty percent of the income distribution have been very large: 18.5% of incomes for the poorest 10% of households, and even in the third decile the resulting income rise exceeds 10% (11.7%). In cash terms, households in each of the bottom three deciles have experienced an average gain of around £25 a week.
It is possible to extend the results to include the effects of Labour’s reforms to employer’s national insurance. Economic theory suggests that the eventual effect of a particular change to employer and employee national insurance should be identical.31 One possibility is that – through the wage bargain – the employer is eventually able to pass on the whole of any increase in employer national insurance to the employee, leaving the tax fully incident on the worker. If changes to employer National Insurance are simply added in to direct changes in households’ liabilities the results become even more progressive as the contributions of lower-paid workers have been reduced relative to those of higher-paid workers.32 Each of the bottom eight income deciles sees their overall gain from Labour policy increase very modestly, the top two
29 We do not model the impact of some of the reforms to contributory benefits such as the cuts to
widow’s pension and incapacity benefit. This is both because these reforms affect new claimants only and so will take an extremely long time to be fully effective, and because of data limitations.
30 This section looks at the impact of Labour’s policies across the household income distribution. If
instead we were to look at the impact across the family income distribution then the impact is a little less progressive. That is because of the very significant number of very low-income individuals who are classed as separate families by the benefit system (e.g. adult children living at home) who have not seen any significant rise in their benefit rates. Full results on this basis are available from the authors. 31 An increase in either represents a widening of the wedge between the two prices in the Labour
market, the net wage (which employees should care about) and the cost of employing (which is what employers should care about).
32 Increases in the earnings level at which NICs are first levied, and reforms to the structure of
income deciles see their losses increase. The effect on the top income decile is especially marked. Once employer National Insurance is included, the average cash loss it suffers from the entirety of Labour’s reforms roughly doubles to £21.70 a week.
Figure 6. Effect of social security and direct personal tax reforms announced July 1997-April 2002, across the income distribution
-5% 0% 5% 10% 15% 20%
Poorest 2 3 4 5 6 7 8 9 Richest
Household equivalised deciles
Percentage gain
Notes: Deciles are constructed by dividing UK households into 10 equal-sized groups, ranked by income adjusted for family size. The first decile contains the poorest 10% of the population, while the tenth decile contains the richest 10%. Employer National Insurance is ignored.
Source: TAXBEN run on survey data from the 1999/00 Family Resources Survey
Table 5. Average weekly gains by family type, for all announced measures, April 2001 prices
Family type Average weekly gain
Families with children
Single-parent family £28.66
No-earner couple with children £40.36
Single-earner couple with children £21.35
Two-earner couple with children £7.13
Pensioners
Single pensioner £23.48
Pensioner couple £23.09
Others
Single, not employed £0.56
Single employed £1.54
No-earner couple without children £6.58
Single-earner couple without children -£3.17
Two-earner couple without children -£6.33
Notes: Average cash changes are arrived at a family rather than a household level. Source: TAXBEN run on survey data from the 1999/00 Family Resources Survey.
These projections in Figure 6 and Table 5 are calculated on the same basis as those occasionally published by the government: they estimate how much incomes will change compared to a hypothetical world where benefits are indexed with inflation and income tax allowances increased according to statutory rules. They therefore do not consider how disposable incomes changed as a result of changes in demographics and the primary income distribution sources. In particular, they ignore the growth of wages and of any change in wage-relativities. They also assume that 100% of benefits are taken-up.33 When we look instead at how the actual distribution of incomes has evolved, Labour’s track record on inequality and relative poverty seems less impressive. There is a considerable delay in obtaining survey data on actual incomes, and some of Labour’s proposals are not yet in force, so we cannot yet use surveys to evaluate the effect of Labour’s whole package. However, data is now available for financial year 2000/1, the last year of the first Labour term, and this data includes the effects of many of Labour’s most important tax and benefit reforms. On the most widely used summary statistic for income inequality, the Gini coefficient, inequality was actually higher in 2000-01 than it was in 1996-7, having peaked previously in 1998-99 (see Figure 7, and see Goodman, 2001 for other measures).
33 The Government’s own figures suggest that around 10% of income support and 24% of WFTC goes
Figure 7. The Gini coefficient 1979-2000/1
0.20 0.22 0.24 0.26 0.28 0.30 0.32 0.34 0.36 0.38 0.40
1979 1981 1983 1985 1987 1989 1991 1993 1995 1997 1999
Year
Gini coefficient
BHC AHC
Notes: Years on the y-axis refer to calendar years until 1993 and are for financial years thereafter – e.g. 1999 means financial year 1999/00. BHC is before housing costs, and AHC means average housing costs.
Source: Authors’ calculation based on FES from 1979 to 1993 and FRS from 1994/95 onwards.
Table 6. People below 60%-contrmporary median income poverty line After Housing Cost income below 60% median
1996–97 1997–98 1998–99 1999-00 2000-01
Total people
Number (m) 13.9 13.6 13.4 13.3 12.9
Proportion 0.246 0.241 0.237 0.235 0.226
of whom:
Children
Number (m) 4.4 4.3 4.3 4.1 3.9
Proportion 0.340 0.334 0.332 0.323 0.305
Pensioners
Number (m) 2.2 2.3 2.3 2.4 2.4
Proportion 0.266 0.271 0.271 0.256 0.246
Source: Family Resources Survey, based on Department for Work and Pensions methodology.
mixture of changes in the primary income distribution and government measures. In practice underlying incomes do change – most obviously, earnings have grown in real terms over time. And given that the Government’s measures are phased in over a number of years this has the effect of increasing the poverty line significantly. Indeed, if the poverty line had been frozen in real terms during Labour’s first term in power then child poverty would have fallen by about 1.4 million – far more than the 500,000 recorded in the data, and slightly more than the 1.2 million projections (see Brewer et al, 2002).
5. Administrative changes to the social security system: JobCentre Plus and modernising the means-test
The Labour Government has always made clear that it wants to reform not just how much people receive but also how benefits are delivered, with the 1998 Welfare Reform Green Paper calling for: “an Active Modern Service, providing positive help into work and delivering an efficient and straightforward service to everyone – whether they are able to work or not” (DSS, 1998, para 27). There are two changes of note. The first has been the increasing work-focused nature of social security benefits both for the unemployed and those previously considered inactive, accompanied by a transfer of responsibilities between departments that reflects the way the Government now views certain social security benefits. The second change is very much ongoing and is to modernise means-tests: as the Government has expanded the scope of tested benefits and tax credits, it has promised to reform the way the means-test operates, presumably to reduce compliance and administration costs, and try to increase take-up rates. This shows how the Government is prepared to tailor what was a fairly uniform administration of social security benefits to achieve its wider goals: for its preferred target groups of families with children and pensioners, benefit administration is modernised and made less cumbersome; for other groups (but not all), benefits come with more responsibilities and conditions.
34 See HM Treasury, 2001c and Piachaud and Sutherland, 2001; our own estimates of the impact of all
5.1 A “work-focused” benefit regime
The key transfer of responsibilities between government departments are as follows. Responsibility for NICs, the WFTC, and child benefit have all been transferred from the old Department of Social Security to the Inland Revenue, and the Inland Revenue will also operate the new child tax credit and working tax credit.35 An equally important change is encapsulated in the merger of the old Employment Service and the Benefits Agency. The former administered Jobseeker’s Allowance and helped to match employers and the unemployed, while the latter administered most other benefits. Together they will form “Jobcentre Plus”. The name changes are also of note: this new “Jobcentre Plus” will be an agency of the new “Department of Work and Pensions”, responsible for the New Deal, pensions, and benefits other than those run by the Inland Revenue. 36
These latter changes (announced just before the 2001 election) merely confirm the steady trend throughout the first parliament to increase the responsibilities of unemployed and inactive out-of-work benefit claimants, and introduce a consistent work-focus to all benefits. This became apparent with the New Deal in January 1998. The original reforms were for a compulsory New Deal for people aged between 18 and 24 who have claimed jobseeker’s allowance (JSA) for six months, and a compulsory New Deal for the long-term unemployed (those claiming JSA for over 2 years). Both involve extra help with job search and training, a wage subsidy, and penalties for non-compliance (see Table 7). Since then, various voluntary New Deals – involving assistance but no sanctions – for lone parents, partners of the unemployed, those over 50 years old and disabled people have been introduced.
35 Given these changes (and others besides), it is suggested that the Inland Revenue may even see a
name change in the future, now that it is in the business of paying out substantial parts of the old social security as well as collecting taxes (Inland Revenue, 2001a).
36 The name is not perfectly descriptive: it will retain responsibility for sickness and disability benefits,
Table 7. The New Deal programme Client group Conditions and
eligibility Provision
18- to 24- year-olds
Compulsory after unemployed for six
months
Personal adviser. Gateway period for four months (advice, guidance, preparation), then one of: training or education, job with wage subsidy, voluntary work, public sector employment through the environmental
task force. Help with travel and childcare costs.
25- to 50-
year-olds unemployed for 18 Compulsory after months
Personal adviser. Gateway period for four months (advice, guidance, preparation), then one of: training
or education, job with wage subsidy, work placements. Help with travel and childcare costs.
Sanctions for non-compliance.
Aged 50 and over
Voluntary after unemployed for six
months
Personal adviser. Help with job search. One year’s employment credit if move into low-paid work.
Lone parents Voluntary for lone parents who are not
working
Personal adviser. Help with job search, training, childcare arrangements and in-work support. Financial help for training and childcare. May join
other New Deals.
Partners of unemployed
people
Voluntary if partner claiming out-of-work benefit for six
months
Personal adviser. Help with job search, training, childcare arrangements and in-work support.
Financial help for training and childcare.
Disabled people Voluntary if receiving
disability-related benefits
Personal adviser and access to job broker.
Source: drawn from Appendix 10 of CPAG, 2002.
5.2 Modernising the means-test
No means-tested benefit achieves full take-up. Take-up of income support for those over 60 and of WFTC is particularly low, with as many as 30% of those eligible not claiming (see McKay, 2002, for WFTC, and Appendix B for income support). By contrast, take-up of non-means-tested benefits is much higher: take-up of the state pension is very high and take-up of child benefit is almost universal. 37 Non-take-up of means tested benefits means that some people – by definition on low-income – are missing out on government support to which they are entitled. An increased emphasis on means-tested benefits therefore raises a concern that support will not reach all of those that the Government wishes to help. Labour intends to tackle this by making new means-tests less hassle and less stigmatising for claimants, and easier for the Government to administer.
The Government has mentioned a number of features. First, shortening and simplifying means-tests. The Government’s own view of means-tested benefits is that “[income support] involves a weekly means-test which contrasts with the less intrusive, less burdensome annual requirements for wealthier [people] in the tax system.” (DSS, 2000b). Both the new tax credits and the pension credit have been put forward as simpler, less intrusive programmes than those they will replace. Part of this may be achieved by simplifying claim forms. This process has already begun for pensioners: over-sixties used to have to fill out the same income support claim form as working-age adults, but now the twelve page form for the MIG is much simpler than the 46-page form that working age claimants must claim. In the same way, for those with children, claiming the new child tax credit may be simpler than claiming income support. On the other hand, it looks like the Government will need more information from families to administer the new tax credits than it does to administer the current WFTC or the children’s tax credit (for example, the Inland Revenue will need information on all sources of incomes over a year, rather than a few payslips which are needed for the WFTC), and this may make the new tax credits more complicated for families used to receiving support in those ways.
37 Although families are usually entitled to these benefits for a long period of time, greatly increasing
Perhaps a more significant hassle-reducing element of introducing the new tax credits and the pension credit is the switch to annual systems. Awards will be assessed on an annual measure of income and potentially fixed for a year or longer.38 A pure annual means-test would achieve simplicity by ignoring all changes in circumstances within the present year, but the downside of such simplicity would be unresponsiveness. The Government recognises this trade-off – “[the pension credit] will seek to balance the need for secure incomes with the need for a system which is sensitive enough to ensure that vulnerable pensioners get the help they need” (DSS, 2000b) – and so none of the new credits will be pure annual systems. Pensioners receiving the pension credit should “not normally have to report any changes for five years at a time”, except for “major changes in their lives” (DWP, 2001c). The new tax credits will be fixed over a tax year unless one of several events occurs.39
The need to police these annual systems could limit the hoped-for reduction in hassle for claimants. Entitlement to the new tax credits will be checked at the end of the tax year once the Inland Revenue knows actual income received; over- or under-payments will then be corrected.40 The Government hopes that ignoring annual income changes of less than £2,500 will keep the number of such end year reconciliations manageably small. This hope might be frustrated if the weekly hours of work rule for entitlement that will operate alongside the annual income rule, makes it difficult to accurately project likely entitlement for the new tax credits. For the low-income families involved end year reconciliations might be onerous, especially for those asked to repay excess receipts.
In case of the Pension Credit, by contrast, there is no automatic reconciliation at the end of the five-year assessment period. This leaves the system more open to
38 In what follows, details are drawn from DWP (2001c) for the pension credit and HM Treasury
(2002b) for the working tax credit and new child tax credit; they are discussed in Clark (2001, 2002) and Brewer, Clark and Myck (2001) respectively.
39 First, for families with children, a successful claim for income support or jobseeker’s allowance will
automatically entitle the family to the maximum amount of child tax credit, regardless of their previous income (preserving the income safety net). Second, changes in family composition could lead, in general, to immediate changes in credit awards. Third, families whose current-year income differs “significantly” from their income over the previous tax year could ask to have their current-year credit entitlement adjusted. Lastly, changes in “average” hours of work and childcare costs may also lead to change in entitlement for those receiving any working tax credit.
40 It is not known how the Government will monitor the incomes of pensioners receiving the pension