3D convolutional GAN for fast simulation
SofiaVallecorsa1,2,∗,FedericoCarminati1,∗∗, andGulrukhKhattak1,3,∗∗∗
1CERN, Switzerland
2Gangneung-Wonju National University, Korea 3University of Peshawar, Pakistan
Abstract.Machine Learning techniques have been used in different
applica-tions by the HEP community: in this talk, we discuss the case of detector sim-ulation. The need for simulated events, expected in the future for LHC ex-periments and their High Luminosity upgrades, is increasing dramatically and requires new fast simulation solutions. We describe an R&D activity aimed at providing a configurable tool capable of training a neural network to reproduce the detector response and speed-up standard Monte Carlo simulation. This rep-resents a generic approach in the sense that such a network could be designed and trained to simulate any kind of detector and, eventually, the whole data processing chain in order to get, directly in one step, the final reconstructed quantities, in just a small fraction of time. We present the first application of three-dimensional convolutional Generative Adversarial Networks to the sim-ulation of high granularity electromagnetic calorimeters. We describe detailed validation studies comparing our results toGeant4Monte Carlo simulation. Fi-nally we show how this tool could be generalized to describe a whole class of calorimeters, opening the way to a generic machine learning based fast simula-tion approach.
1 Introduction
The future High Luminosity LHC phase will be very demanding in terms of computing re-sources, because of the amount and complexity of data that will be collected, stored and analysed [1]: correspondingly, the need for simulated data is expected to grow by one or-der of magnitude. For this reason, High Energy Physics (HEP) software and, in particular, Monte Carlo-based simulation, are going through an important phase of restructuring and optimisation for new computing architectures. In order to increase the performance of sim-ulation applications, new methods and algorithms for fast simsim-ulation are being studied. Fast simulation approaches are already being used to reduce computation time: they are typically
parametrized on physics quantities previously calculated or measured, trading-offsome
per-formance, in terms of physics accuracy, for speed. These solutions suffer from being specific
to individual experiments and detectors and they can reach different levels of accuracy and
speed.
Our proposal is to leverage state of the art deep learning algorithms to design a generic, fast simulation tool. The idea is to treat simulation as a black-box and replace detailed Monte Carlo with a deep neural network (DNN) that can be trained on a range of particle types, mo-menta, positions and detector configurations. In fact, the recent developments in deep learn-ing provide a very promislearn-ing avenue to replace complex algorithms with a suitably complex deep neural network that is able to reproduce the results of the former at a much higher speed. Generative models, like Generative Adversarial Networks (GANs) [2], are particularly suited to replace Monte Carlo simulation: their key feature is the ability to learn the underlying dis-tribution and relevant features from the training dataset and reproduce new realistic samples according to the features they have learned.
This paper describes the first steps towards an automated tool to configure and train an optimised DNN according to the specific detector to simulate. We report on results of the initial prototyping and validation phase, focused on a specific use case, an example of future fine grained digital calorimeters. After a short introduction about related work in section 2, sections 3 and 4 introduce the calorimeter data and describe the GAN model architecture. Selected examples of physics validation are summarised in section 5. Section 6 presents an overview of computing performance for the inference and training processes, while section 7 concludes with a summary and an outlook on our future plans.
2 Related Work
GANs were introduced in 2014 [2]: they consist of two networks, a generator and a discrimi-nator, trained in an adversarial manner. The original formulation defined the training problem as a min-max game with the generator and the discriminator competing against each other. The generator network is trained to generate realistic sample starting from random noise, while the discriminator network analyses the generator output and tags it as real (belonging to the original dataset) or fake. Assuming a large enough training sample, a unique solution to the problem exists with the generator covering the entire data distribution and the discrimi-nator estimating a 50% probability of being real for both real and generated images [2]. Many
different GAN applications have been developed in the past past few years, in particular in
the field of image processing [3], [4]. As we will see, the output of HEP detectors can be also be interpreted as an image, thus these same techniques can be employed to simulate their output. The LAGAN or (Location Aware GAN) [5] and CaloGAN [6] were among the first examples interpreting calorimeter simulation in these terms: CaloGAN, for example, gen-erated the ATLAS Liquid Argon calorimeter output as a sequence of three two-dimensional images.
The present work is intended to move further along this direction, simulating three-dimensional calorimeter showers as a whole.
3 Calorimeter Data
The training data set was produced in the context of the CLIC detector design [7]. It
con-sists of energy showers generated with theGeant4software [8] inside the CLIC
electromag-netic and hadronic calorimeters detector prototype [7]. Our current study focuses on the electromagnetic calorimeter (ECAL). This is an example of next generation highly granular calorimeters and therefore it represents a demanding use case simulation will have to face
during High Luminosity LHC runs. The data set was produced in an effort to provide the
HEP community with a common benchmark to perform tests, development and optimization
of different machine learning techniques [9]. The ECAL is a sampling calorimeter consisting
of 25 layers of Tungsten absorber with silicon sensors in between them. The first 17 absorber layers have a thickness of 2.4 mm, while the other 8 layers are twice as thick. Each plane of silicon sensor is 0.5 mm thick and it is segmented in (5.1 mm x 5.1 mm) cells. The inner radius of the calorimeter is 1.5 m.
An individual entry in the data set represents the energy deposited in the calorimeter cells, by the particle shower propagating through the detector. Each cell is characterised by
the energy recorded in it and three indices (iX, iY, iZ), identifying its position. Thezaxis is
chosen along the direction of the incoming electron, whilexandyare on the transverse plane,
perpendicular toz. For each of the 25 ECAL sensor planes, a 25x25 array of cells is defined
around the energy shower barycentre. The information stored for the ECAL shower is then E(iX, iY, iZ) for each of the 25x25x25 cells. Each dataset entry also includes the information on the nature of the incoming particle and its energy. About 1M showers have been generated for each particle type (electrons, photons and pions). The energy of the incoming particle is
sampled from a uniform [10−500] GeV spectrum. The baseline training dataset is composed
of particles entering the calorimeter along a direction orthogonal to its surface (thezaxis). A
second dataset was generated including particles with an incident angle 60◦< θ <120◦. The
corresponding 3D images are 4x larger in order to entirely contain the energy deposits: they result in 51x51x25 pixels. We use this "angle-" dataset to perform generalisation studies as explained in section 5.
4 The 3DGAN model architecture
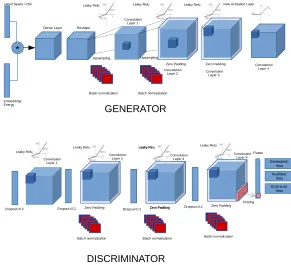
Our 3DGAN model is based on three-dimensional convolutions in order to capture the whole shower development along the three spatial dimensions. Both the generator and discrimina-tor networks contain four convolutional layers [10]. The generadiscrimina-tor uses as input a vecdiscrimina-tor of random numbers (the latent vector) generated according to normal distributions. The latent
vector is multiplied by the input particle energy, a continuous parameter that effectively
"con-ditions" the training [11]: in an unconditioned generative model, there is no control on the modes being generated. However, by conditioning on additional information it is possible to direct the data generation process and isntruct the Generator to create, for example, energy showers corresponding to a specific particle energy. Convolutions are chained to up-sampling layers in order to produce images of increasing size. Batch normalization layers for regular-ization and leaky rectified linear units activation functions are used to take into account the level of sparsity of the input images. The generator output consists of a 25x25x25 ECAL image.
The discriminator takes as input the generated image. Its structure is very similar to the generator. In addition, it includes pooling layers with the dual purpose of down-sampling and regularization. A 2% drop out provides additional regularization against over-fitting. A
set of three dense layers maps the flattened discriminator network response to three different
outputs.
Loosely following the strategy of auxiliary classifier GANs [12], indicating that the in-troduction of labels provides faster convergence and stability, we assign to the discriminator
two additional regression tasks: an estimation of the incoming particle energy (Ep) and of the
total energy measured by the calorimeter (Ecal), corresponding to the sum of all the energy
depositions in the cells of the image.
The adversarial training uses a loss function based on the probability of the discriminator
correctly differentiating between real and fake images (binary cross entropy). The
*
Latent Space =256
Embedding/ Energy
Dense Layer Reshape
Convolution Layer 1
Batch normalization Batch normalization Leaky Relu Leaky Relu
Leaky Relu
Upsampling Upsampling
Zero Padding
Zero Padding Convolution Layer 4 Convolution
Layer 3 Convolution
Layer 2
Relu Activation Layer
Convolution Layer 1
Leaky Relu Leaky Relu
Zero Padding
Convolution Layer 4 Convolution
Layer 2
Dropout=0.2 Dropout=0.2
Leaky Relu
Zero Padding Dropout=0.2
Leaky Relu
Zero Padding Convolution Layer 3
Leaky Relu
Zero Padding
Batch normalization Batch normalization
Batch normalization
Dropout=0.2
Flatten
GENERATOR
DISCRIMINATOR
Generation loss Auxiliary
loss Generation
loss
Ecal sum loss
Pooling
Figure 1.The three dimensional GAN model showing the generator and discriminator network archi-tectures
deposited in the detector. Weights are employed to balance the contributions of the three individual terms to the total loss. The generator and discriminator cross entropy loss func-tions evolution is shown for a typical training run in Figure 2: the losses change smoothly during the training process and asymptotically approach the expected value describing the Nash game equilibrium [2]. Figure 2 also shows the real/fake probability, as estimated by the discriminator, for a real image (in blue) and a generated one (orange). The optimal result in the "training game" should peak around 0.5 showing that the discriminator can no longer distinguish generated images from the original ones.
The RMSProp [13] optimizer is used, with a learning rate of 10−3. We train the GAN models on 200000 electrons generated with a uniform energy between 10 and 500 GeV.
5 Physics validation
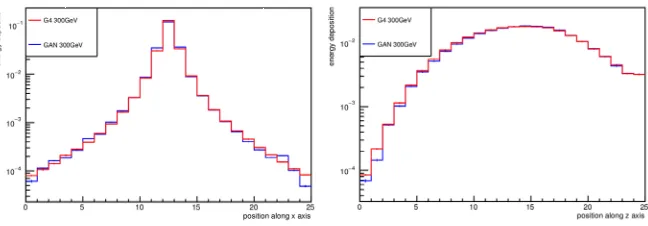
To fully validate GAN results in terms of physics we compare to standard Monte Carlo simu-lation based onGeant4. We have studied both low level variables describing the calorimeter energy response, i.e. the single cell energy distributions, and more complicated features such as average profiles of the electromagnetic showers along the three calorimeter axes. Figure 3 shows the shower profile along thexandzaxes for 300 GeV electrons: the distributions in
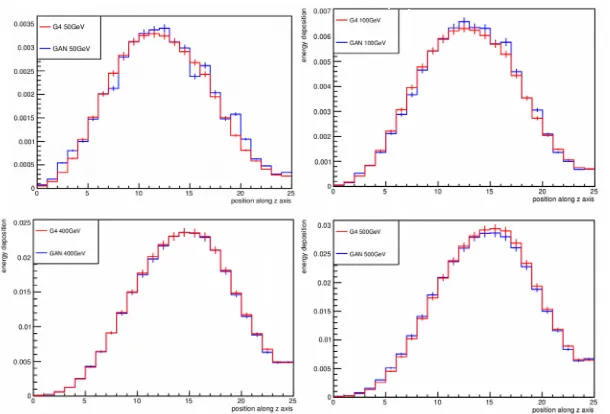
xandyare similar so only thexprofile is presented. Figure 4 shows the longitudinal profile for different electron energies. The GAN prediction (red) is compared to the corresponding
repro-*
Latent Space =256
Embedding/ Energy
Dense Layer Reshape
Convolution Layer 1
Batch normalization Batch normalization Leaky Relu Leaky Relu Leaky Relu Upsampling Upsampling Zero Padding
Zero Padding Convolution Layer 4 Convolution
Layer 3 Convolution
Layer 2
Relu Activation Layer
Convolution Layer 1 Leaky Relu Leaky Relu Zero Padding Convolution Layer 4 Convolution Layer 2
Dropout=0.2 Dropout=0.2
Leaky Relu Zero Padding Dropout=0.2 Leaky Relu Zero Padding Convolution Layer 3 Leaky Relu Zero Padding Batch normalization Batch normalization Batch normalization Dropout=0.2 Flatten GENERATOR DISCRIMINATOR Generation loss Auxiliary loss Generation loss Ecal sum loss Pooling
Figure 1.The three dimensional GAN model showing the generator and discriminator network archi-tectures
deposited in the detector. Weights are employed to balance the contributions of the three individual terms to the total loss. The generator and discriminator cross entropy loss func-tions evolution is shown for a typical training run in Figure 2: the losses change smoothly during the training process and asymptotically approach the expected value describing the Nash game equilibrium [2]. Figure 2 also shows the real/fake probability, as estimated by the discriminator, for a real image (in blue) and a generated one (orange). The optimal result in the "training game" should peak around 0.5 showing that the discriminator can no longer distinguish generated images from the original ones.
The RMSProp [13] optimizer is used, with a learning rate of 10−3. We train the GAN models on 200000 electrons generated with a uniform energy between 10 and 500 GeV.
5 Physics validation
To fully validate GAN results in terms of physics we compare to standard Monte Carlo simu-lation based onGeant4. We have studied both low level variables describing the calorimeter energy response, i.e. the single cell energy distributions, and more complicated features such as average profiles of the electromagnetic showers along the three calorimeter axes. Figure 3 shows the shower profile along thexandzaxes for 300 GeV electrons: the distributions in
xandyare similar so only thexprofile is presented. Figure 4 shows the longitudinal profile for different electron energies. The GAN prediction (red) is compared to the corresponding
Geant4simulation (blue). Figures 3 and 4 show that 3DGAN is capable of correctly
repro-Figure 2.(left) Binary cross-entropy loss function for the generator and discriminator networks. (right) The discriminator real/fake probability for a real image (in blue) and a generated one (orange). The optimal result should peak around 0.5 showing that the discriminator can no longer distinguish the generated images from the original ones.
1 Figure 3.Transverse energy profile along x (left) and longitudinal energy profile along z (right) for 300 GeV electrons. Geant4 prediction is shown in blue and the GAN’s in red. Units are GeV/50.
ducing the different profiles over a large energy range. The same agreement can be seen in Figure 5: it represents the calorimeter response in terms of deposited energy (calorimeter sampling fraction) for electrons and neutral pions. The network performance over this large energy range is remarkably good considered that no effort was made to optimise the network architecture for different energy values. Convolutional layers are sensitive to the spatial shape of the energy showers, which changes according to the primary particle energy, while the ar-chitecture parameters were optimised to reproduce at best particles with energies around the central region of the spectrum. The agreement in the case of neutral pions slightly deterio-rates: we observed that this behaviour is consistent with the slightly smaller average energy depositions with respect to the electron sample.
1 Figure 4. Longitudinal energy profiles along z for 400 and 500 GeV electrons. Geant4 prediction is
shown in blue and the GAN’s in red. Units are GeV/50.
50 100 150 200 250 300 350 400 450 500 Ep GeV 0
0.005 0.01 0.015 0.02 0.025 0.03
Ecal/Ep
Ratio of Ecal and Ep for 2-500 GeV
G4 GAN
50 100 150 200 250 300 350 400 450 500 Ep GeV 0
0.005 0.01 0.015 0.02 0.025 0.03
Ecal/Ep
Ratio of Ecal and Ep for 2-500 GeV
G4 GAN
Figure 5.Calorimeter sampling fraction as a function of the incoming electron (left) and neutral pion (right) energy as predicted by Geant4 simulation (in blue) and GANs (in red)
We have trained the network using 200000 single electrons generated with energies sampled from a uniform [100−200] GeV spectrum and an angleθsampled from a [60◦−120◦]
spec-trum . Figure 6 compares the energy shower shapes generated by the angle-aware 3DGAN to theGeant4 showers. Although preliminary, these results show very good agreement to Monte Carlo. Detailed validation studies are on-going. This results were obtained by man-ually adjusting architecture hyper-parameters to fit the new image size. Our plan is to test an automated optimisation procedure to achieve similar or better performance and extend to different calorimeter examples.
6 Computing performance and training time
Once trained, the GAN simulation tool is a relatively lightweight application: a few MB are enough to describe the layers configuration for the two networks and the inference step is
Figure 6.Top: Transverse energy profile along x (left) and y (right) for 100-200 GeV electrons, with incident angles uniformly distributed between 60 deg and 120 deg. Bottom: Longitudinal energy profile along z for 100−200 GeV electrons, with incident angles uniformly distributed between 60 deg and 120 deg (left). ExampleY−Zview of an electron shower with energy=150 GeV andθ=60 deg (right). Geant4 simulation is in red. GAN results in blue.
orders of magnitude faster than a standard Monte Carlo. We have run a test on a Intel Xeon 8180 processor (codenamed "Skylake") measuring the time it takes to generate one electro-magnetic shower for our benchmark detector. We obtained 17 s/shower usingGeant4and 4 ms/shower using our trained GAN model, yielding a speedup factor larger than 2500. Using dedicated hardware, such as GPGPUs, the generation time reduces further (we choose not to quote comparison results since theGeant4application can not run on GPGPUs). On the other hand, the GAN training process is more time consuming. As mentioned above, the core struc-ture of both generator and discriminator is based on four 3-dimensional convolutional layers, so the models are not very deep, compared to other existing convolutional networks: in total, the generator and discriminator networks sum up to about 1M parameters, when a relatively small latent space is chosen (200 elements). Moreover, the adversarial training itself, rely-ing on continuous feedback between the discriminator and the generator is particularly time consuming. We also train each network twice following a process that is explained in [10]: in fact, a two-step discriminator training (on separate real and fake image batches) helps to insure fast convergence of the network [14]. This results in a relatively large computing time: training the 3DGAN on 200,000 electrons for 30 epochs takes about 1 day on a NVIDIA
7 Conclusion and future plans
Monte Carlo production has been so far a major fraction of the LHC Grid computing work-load and the High Luminosity LHC experiments needs will increase by orders of magnitude. In this context, generative models relying on the possibility to treat detector response as im-ages, seem natural candidates to speedup simulation. Generative Adversarial Networks, in particular, require relatively small amounts of data to train and are the subject of many ongo-ing studies. Their performance as imagongo-ing tools for calorimeter simulation is very promisongo-ing, and from a computing resources perspective, the gain in the time needed to generate a shower
is huge. As mentioned above it reduces to roughly 4 ms/shower compared to the 17 s/shower
needed by Geant4 simulation on a Intel Xeon 8080 CPU. We have presented an applica-tion of 3D convoluapplica-tional GANs to the simulaapplica-tion of high-granularity detectors. We have
successfully generated three-dimensional images of energy showers, according to different
energy and incident angle values. A detailed validation of the physics results based on the comparison to state-of-the-art Monte Carlo software shows very good agreement. We plan
to extend this performance studies to the angle-aware architecture and experiment different
optimisation frameworks in order to adapt the best architecture design to the specific
simu-lation use-case. Furthermore, we will test the performance of our approach on different high
granularity calorimeter architectures such as CLIC hadronic calorimeter [7] or the SDHCAL prototype [19].
8 Acknowledgement
The authors wish to acknowledge the contribution of Intel to the project through the Intel Performance Computing Centre (IPCC) program.
References
[1] Bird I 2016WLCG wokshop
[2] Goodfellow I et al. 2014 (Preprintsstat-ml/1406.2661)
[3] Karras et al., 2018 (ICLR2018)
[4] Wu J et al 2016.NIPS conf proc.
[5] Paganini M et al 2017 (Preprinthep-ex/1701.05927)
[6] Paganini M et al 2017 (Preprinthep-ex/1705.02355)
[7] Tehrani, N et al 2017 (PreprintCERN/CLICdp-Note-2017-001)
[8] Geant4 project, "Geant4" [software], version 10.3.2, 2017. Available from
https://github.com/Geant4/geant4/releases/tag/v10.3.2 [accessed 2017-08-17]
[9] Pierini M. 2016DS@HEP at the Simons Foundation
[10] Vallecorsa S et al., ACAT2017 proceedings, Journal of Physics: Conference Series, 1085, 3, 2018.
[11] Mirza M, Osindero S 2014 (Preprintsabs/1411.1784)
[12] Odean A et al., (Preprintsstat.ML/1610.09585)
[13] Hinton G et al., Lecture 6a overview of minibatch gradient descent, 2012.
[14] Chintala S et al., https://github.com/soumith/ganhacks.
[15] Vallecorsa S et al., ISC 2018 Workshops, LNCS 11203, 2018. [16] Vlimant, J-R et al. CHEP2018 proceedings.
[17] Vallecorsa S et a., HiPC 2018 proceedings.
[18] https://www.hnscicloud.eu.