Optimal stocking rate for cow-calf enterprises
range and complementary improved pastures
R.H. HART, J.W. WAGGONER JR., T.G. DUNN, CC. KALTENBACH, AND L.D. ADAMSAbShCt
Complementary pasture-native range systems are known to increase production per cow and per hectare of cow-calf enter- prises, but the proper ratio of complementary pasture to range and the optimum stocking rate on each has not been established. From 19784985, crested wheatgrass [Agropyron duertorum (Fiscb.) Scbult.+native range and meadow bromegrass (Bromus bieber- steinii Roem. and Scbult.)-alfalfa (Me&qo s&vu L.)-native range systems were grazed by cow-calf pairs and yearling heifers at a range of grazing pressures. Gains of all clrwes of cattle and conception rate of cows remained constant 8cross 8 ringe of low grazing pressures, then declined linearly as grazing pressure increased. These response functions were used to calculate eco- nomically optimum p8sture-to-rurge ntios 8nd stocking r&es at 1980-1984 average costs and prices. Tbe optimum ratio of created wheatgrass to range at estimated yields, costs and prices was 1~3.94 (0.66 ha of wheatgrass and 2.60 ha of range per animal unit), which returned S35.70/ba to land, labor, and management. Usual ratios of 1:8 to 1:12 were much less profitable. At optimum stocking rates, the brome-alfalfa-nntive range system retumed only 83.38 more per bect8re tban the crested wbeatgr8ss-native range system, not enough to pay additional cost of irrigation. Optimum ratios, stocking rates, and returns will vary with levels of forage produc- tion, production costs, and livestock prices.
Key Words: pasture systems, gains, reproduction, profitability, crested wheatgrass, alfalfa-brortlegrass
Cow-calf herds grazing crested wheatgrass [Agropyron deserro- rum (Fisch.) Schult.] in spring and native range the remainder of the grazing season generally produce greater calf crops, weaning weights, and pounds of weaned beef per hectare (Houston and Urick 1972, Hart et al. 1983b) than herds grazing native range season-long. Similar results have been reported from cow-calf herds grazing other types of complementary pastures in conjunc-
Authors arc range scientist, USDA, Agricultural Research Service, High Plains Grasslands Research Station, Chcycnnc, W
reproductive physiolo@sts (now Dean o r
o. 82009; and animal nutritionist, former Graduate School and Asst. Dean of Research and Educatton, respectively); and former graduate assistant, Animal Science Dept., University of Wyoming, Laramie 82070.
Manuscnpt accepted IO May 1988.
JOURNAL OF RANGE MANAGEMENT 41(5), September 1988
on native
tion with range (Mcllvain and Shoop 1973, Sims 1984, Manske and Conlon 1986). Cattle gains and carrying capacity have been greater on crested wheatgrass-range systems than on range alone (Cook et al. 1983, Jefferies et al. 1967, Lodge 1970, Smoliak and Slen 1974).
Kearl(1984) and Cordingly and Kearl(l975) cited a number of studies showing increased forage production, calf crop;and calf weight gains, plus lengthened grazing season, reduced winter feed requirement, and development of special use pastures as benefits of seeding crested wheatgrass complementary pastures. They calcu- lated that seeding 385 ha of a 5,844-ha ranch to crested wheatgrass would, within 5 years, increase net ranch income 26% and the return to capital 35%. Godfrey et al. (1979) used estimated rates of gain before and after seeding crested wheatgrass to estimate the economic returns from seeding. Spielman and Shane (1985) con- cluded it was profitable to seed crested wheatgrass pastures if meadow hayland and range forage resources were not limiting on the ranch in question.
These studies did not consider the functional relationships among stocking rate, livestock performance, and profitability; data on these relationships are seldom available. The grazing stu- dies compared range and range-complementary pasture systems at a single stocking rate on each. Often the stocking rates were differ- ent for the 2 systems, and were less than those required to maximize profits. Because stocking rate has an over-riding impact on profit- ability of grazing systems (Quigley et al. 1984, Hart et al. 1988), comparisons&ystems are valid only at the optimum stocking rate or grazing pressure (GP) on each. Determining this rate depends upon reliable estimates of biological responses.
We concluded that the superiority of complementary pasture systems over native range alone had been adequately demon- strated, but that optimum management of each system, in terms of the area and stocking rate of each component, had not been defined. Our objective was to quantify these parameters for com- plementary pasture systems combining dryland crested wheatgrass or irrigated bromegrass-alfalfa pastures with nativerange, and to
demonstrate how these parameters could be used for economic analysis.
Materials and Methods
The study site was on the High Plains Grasslands Research Station located 7 km northwest of Cheyenne, Wyo. Climate at the Station is semiarid continental. Mean January and July tempera- tures in Cheyenne are -3 and 200 C, respectively, and mean (1871-1986) annual precipitation is 338 mm, with 55% falling April-July (NOAA 1987). Average frost-free season is 127 days (Stevenson et al. 1984).
Pasture Mmqtment
Four crested wheatgrass pastures, established 30-40 years before the study began in L978, were grazed. The 2 pastures grazed in 1978-1979 were on Nucla loam (tine-loam, mixed, mesic Aridic Haplustoll) and Ascalon loam, (fine loamy, mixed, mesic Aridic Argiustoll). The 2 pastures graxed 1980-1985 were on Wheatridge loam, a tine-loamy over sandy, mixed, mesic Aridic Argiustoll. Crested wheatgrass and smooth bromegrass (Bromus inermis L.) provided about 90 and 10% of the forage from the pastures grazed in 1978-1979, with only traces contributed by other species. Forage from the pastures grazed 1980-1985 was 98% crested wheatgrass with traces of several native grasses and forbs.
The irrigated ‘Regar’ bromegrass (Bromus biebersteinii Roem. and Schult.)-alfalfa (Medicogo suriva L.) pastures were established in 1976 on Wheatridge loam. Brome and alfalfa were seeded in rows 20 cm apart at 6 and 7 kg/ha, respectively. Superphosphate was applied at 20 kg/ ha of P before seeding and annually there- after. Irrigation was by flooding as needed. During the years the pastures were grazed, forage composition averaged 28% alfalfa and 72% bromegrass.
The native range pastures were on mixed-grass prairie. Botani- cal composition averaged approximately 50% blue grama [Boufe- louu gracilis (H.B.K.) Lag ex Griffiths], 17% western wheatgrass (Agropyron smithii Rydb.), 19% other graminoids (chiefly needle- andthread (St&a comuru Trin. and Rupr.) and needleleaf sedge (Curex eleochuris Bailey), and 14% forbs and half-shrubs [chiefly scarlet globemallow, Sphuerulceu coccineu (Pursh.) Rydb.; Drum- mond milkvetch, Astrugulm drummondi Do@.; and fringed sagewort, Artemesiu frigidu Willd.]. Topography is rolling hills at altitudes of 1,915 to 1,975 m. Soils are predominantly Altvan, Ascalon and Ascalon Variant loams (fine-loamy, mixed, mesic Aridic Argiustolls), with smaller areas of Albinas loam (fine- loamy, mixed, mesic Pachic Argiustoll), Cascajo gravelly loam (sandy-skeletal, mixed, mesic Aridic Calciorthid), and Larim Var- iant gmvelly loam (loamy-skeletal, mixed, mesic Ustollic Haplargid). The bromegrass-alfalfa pasture was grazed as a single unit in 1978. In 1979 it was subdivided into 2 pastures, each further divided into 2 paddocks and managed as a 2-pasture l-herd system. Grazing and rest periods were 5 to 10 days, depending on forage supply and growth rate. Crested wheatgrass pastures were not subdivided but pastures used in 1978 and 1979 were different from those used in 1980 through 1985. The native range area originally consisted of 2 pastures. In 1982 a portion of the larger pasture which had been fenced off and excluded from the study in 1980 was brought into the experiment to provide a third and heavier stock- ing rate. In 1985 this area was again excluded, and the smaller of the 2 original pastures was subdivided into 4 units to provide a total of 5 stocking rates. Pasture sixes and stocking rate are presented in Table 1.
Tabk 1. Padure da, forage produetlom (sta~&~I error in parenthe@ and stoeklag rate (SR).
Ycaf
1978
1979 1980
1981 1982
1983
1984
1985
Bromegrass-alfalfa crested whcatgrass Native range
Ha/ Forage. SR. Ha/ Forage SR. w Forage, SR,
pasture kc/b AUD/ha pasture kg/ha AUD/ha pasture kg/ha AUD/ha
8.1 2740 90 7.4 ($g 103 191.4 - 30
(210) 10.3 76 283.3 m
3.5 4270 106 1::: 18rn 82 191.4 -
4.6 (430) 81 WV 60 283.3 z
3.5 136 11.3 1650 49 191.4 - 27
4.6
(Z
103 14.6 (190) 38 248.9 21
3.5 27m 180 11.3 980 42 191.4 -
4.6 (430) 146 14.6 (160) 35 248.9 ii
3.5 2570 170 11.3 1030 50 34.4 1180 44
4.6 (380) 97 14.6 (60) 23 191.4 (270) 32
214.5 13
. l 34.4 1450 60
191.4 (260) 40
202.4 11
* + 34.4 :tG 47
191.4 30
202.4 13
l l 24.3 50
24.3 42
24.3
118.6 f
202.4 26
*In 1983-1985, all cattle grazed together ore 8.1 ha bromcgrass-alfalfa and 25.9 ha of crested wheatgrass during the improved pasture grazing season.
Appendlr Table 1. Program for ukulatinS reepotue
of
everqedally gain to~~pnrrure,~c~ADCbaowcritierlpuia~prarure;eemple date eet; end nmple reeponee curve. Coded in Compeqt BASIC, vemion 3.
10 DIM X(64), Y(64)
20 PRINT “REGRESSION OF ADG ON GRAZING PRESSURE” 30 INPUT “TITLE “,Q3
40 INPUT “MEASURE OF GRAZING PRESSURE (X) “,X3 50 INPUT “UNITS OF ADG “,YS
60 INPUT “NO. OF DATA POINTS “,N
70 PRINT INPUT X & Y. WITH X5 IN ORDER FROM SMALLEST TO LARGEST”
80 FOR I=1 TO NPRINT -X”; LINPUT X(I):PRINT “y”; 1:INPUT Y(I):NEXT I
90 FOR I=1 TO N:Sl=Sl+X(I):SZ=SZ+Y(I)
100 S3=S3+X(I)-2:S4=S4+Y(I)‘ZSS=W(X(I)*Y(I)):NEXT I 110 S7=S4(S2-2/N):B=(N*S5-S2+Sl)/(N+S3-Sl-2):A=(S2-B*Sl)/N 120 R=(S5-((Sl+S2)/N))-2/((S3-Sl-2/N))*(!+4-(S2-2/N)))
130 LPRINT QS:LPRINT :LPRINT “ADG (“;Ys;“) = “;B;“(“;XS;“) +“;A 140 LPRINT “R SQUARED q “;R:LPRINT
150 FOR M=2 TO (N-l)
160 Sl=OS2=OS3=OS4=OzS5=OS6=CkR2=O 170 FOR I=M TO N:Sl=Sl+X(I):S2=S2+Y(I)
180 S3=SFX(I)‘2:S4=S4+Y(I)‘2:SS=S5+X(I)’Y(I):NEXT I 190 Bl=((N-M+l)‘SS-S2+Sl)/(N-M+l)*S3-Sl-2):Al=(S2-Bl+Sl)/
(N-M+l)
2OOFORI=l TOM-l:S6=S6+Y(I):NEXTI:S6=S6/(M-l):Zl=(S6-Al)/Bl 210 FOR I=1 TO N:IF X(I)>Zl GOT0 230
220 Rl=(S6-Y(I))-Z:GOTO 240 230 Rl=(Y(I)-(Bl+X(I)+Al))-2
240 IU=RZ+Rl:NEXT I:R2=(S7-R2)/S7 250 IF R2CR GOT0 270
269 R=R2:A=Al:3=Bl:Z=Zl:S8=S6 270 NEXT M
280 IF Z=O GOT0 340
299 LPRINT’TFGRAZING PRESSURE IS LESS THAN”; (INT(Z*lOO))/ 1oO;Xs;” THEN”
300 LPRINT” ADG (“;Ys;“) =“;S8
3l0LPRINT”IFGRAZlNGPRESSUREISMORETHAN”;(INT(Z*lOO)) / loO,xS;” THEN”
320 LPRINT ” ADG (“;Ys;“) q -;B-(“;XS;“) +“;A 330 LPRINT “R SQUARED q “;R
340 END Grazing pmssule AUD/ t DM
11 28 32 45 62 a9 101
ADG. kg 0.98 0.97 1.01 0.86 0.69 0.48 0.26
Teet
ADG (kg) = -8.409248E33 (AUDI tonne DM) + 1.192086 R SQUARED = .9342105
IF GRAZING PRESSURE IS LESS I THAN 33.22 AUD/ tonne DM THEN
ADG (kg) = .9866667 IF GRAZING PRESSURE IS
MORE THAN 33.22 AUD/tonne DM THEN
ADG (kg) = -1.009543Ea2 (AUD/ tonne DM) + 1.322086
R SQUARED = 9880446
Herbage dry matter yields and utilization were estimated by clipping inside and outside exclosures. In 1978-1982,5 exclosures were located at random on each crested wheatgrass pasture. Two 0.18-mr quadrats were clipped inside and 2 outside each exclosure at theend of grazing each year. In the same years, 6 exclosures were located on each brome-alfalfa pasture, 3 in each half of each pasture. Two quadrats inside and 2 outside each exclosurc were clipped whenever cattle were removed from that half of the pas- ture; if cattle were to be rotated back to that half later, the exclo- sums were moved a few meters to another location.
On the native range pastures, production was not estimated until 1982. Four, 9, and 7 exclosures were placed on the small, interme- diate, and large pasture in 1982-1984. In 1985,3,6, and 7 exclo- sure8 were placed on each 24.3~ha, the 118.6-ha, and the 202.4ha pasture, respectively. Locations of exclosures were stratified by soil type each year. Herbage production inside the exclosures was measured in August at the approximate time of peak standing crop. Standing crop outside the exclosures was clipped after the cattle were removed from the pastures in late fall when possible, although in some years snow prevented clipping outside some or all of the exclosures on the range pastures. Two 0.18-m2quadrats were clipped inside and outsideeach exclosure in 1982-1984, in 1985 one quadrat per exclosure was clipped after herbage standing crop was estimated on both quadrats with an electronic capacitance meter (Neal et al. 1976). Correlations (rs) between clipped yields and meter estimates were 0.90 in August and 0.74 after grazing; n=l8. Estimated herbage dry matter yields are shown in Table 1.
Cattk Management
All pastures were grazed with mixed herds of Hereford cows with calves, yearling heifers, bulls in breeding season, and in 1978-1981, esophageally fist&ted steers (the latter were used in a diet study reported by Samuel and Howard 1982 and Hart et al. 1983a). In some years dry cows were included in the herds on the most lightly stocked pastures. Grazing on the improved pastures began between 13 and 23 May and ended between 13 June and 6 July when cattle were moved to range pastures. Cattle were removed from the range to winter pasture between 7 and 21 November, except in 1985 when snow forced removal on 9 October. Cattle were assigned randomly to improved pastures, then randomly reassigned to range pastures. Stocking rates on all pastures are shown in Table 1. Stocking rates and graxing pressures were calculated assuming each cow-calf pair, dry cow or bull was 1 animal-unit (AU) and each yearling heifer or steer was 0.75 AU.
Cattle were wintered together on a large pasture, partly native range and partly crested wheatgrass and smooth bromegrass. They were fed good quality grass-legume hay ad lib and 0.5 to 1 .O kg of concentrate daily to maintain gains of approximately 0.5 kg/day during the third trimester of pregnancy. In all years but 1984, estrus was synchronized with Lutalasei or similar products. The breeding season began between 26 May and 10 June and ended between 21 July and 14 August. Cows were artificially inseminated at the first estrus after synchronization; bulls were present for the entire breeding season. All cattle were weighed every 2 weeks, after an overnight shrink without feed or water. Pregnancy was determined by palpation in late summer or early fall each year.
Expcrhental Design and Data Analysis
The experiment was designed and analyzed as a non-replicated sampling study. Responses of weight gain and conception rate to grazing pressure (GP. animal-unit days per tonne of herbage dry matter produced) were fitted to the model of Hart (1978) by regression; see Appendix Table 1 for the program used. Replica- tions are superfluous in regression analysis, although they provide additional data points. Validity of the model used is supported by the SMART model of forage growth, forage intake by cattle, and cattle gains (Hart 1986).
lMention of x trademark or proprietary product does not constitute its approval by USDA to the cxchsion of similar products.
Expressing the independent variable as grazing pressure rather than stocking rate eliminated effects of years on forage production, but effects of year-to-year variation in nutritional quality of cattle diets (Hart et al. 1983a) were necessarily confounded with those of grazing pressure. Variation in cow weight and condition at the beginning of the breeding and grazing seasons was minimized by maintaining a high plane of nutrition during each winter. Differen- ces in potency and enthusiasm of bulls also may have contributed to variation.
o---- aromegrarr-alfalfa . - Crested wheatgrass
Available land limited the number of graxing pressures which could be tested each year and the number of animals which could be carried at each grazing pressure; it would have been desirable but not practical to have greater numbers of both. For example, to estimate conception rate to the nearest 4% within each experimen- tal pasture would require 25 cows per stocking rate. If all stocking rates were tested each year, a minimum of 4 stocking rates on each type of improved pasture would be needed, for a total of 200~0~s. Our average stocking rates were 123 AUD/ha on brome-alfalfa and 48 AUD/ ha on crested wheatgrass, and average length of grazing season on improved pastures was 32 days. Thus this ideal experiment would have required 26 ha of bromealfalfa and 67 ha of crested wheatgrass. Average stocking rate and graxing season on range were 30 AUD/ha and 141 days; 940 ha of range would be needed to accomodate the 200 COWS. And these areas do not include the requirements of 40 to 50 replacement heifers necessary to maintain the herd. Such an ideal experiment was impractical in terms of land, cattle, and money. However, we felt that estimates of production based on less precise data from a less-than-ideal exper- iment were preferable to estimates based on no data at all as a basis for economic analysis.
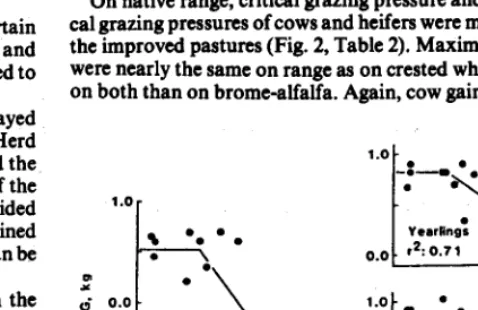
Fig. 1. Grasingpressure andaverage &iiy gains (ADG) of lactating cows. yearling heifers and calves on irrigated bromegrass-alfolfo or drybnd crested wheatgrass pastures, 19784982.
grazing pressure, gains declined linearly with increasing graxing pressure as on brome-alfalfa, but the rate of decline was more rapid for all age classes. Thus gains were higher on crested wheatgrass at intermediate grazing pressure but higher on brome-alfalfa at high and low grazing pressures (in the case of calves, the difference between pasture types was extremely small).
Reonomic Analysis
The functions defining the response of gain and conception rate to grazing pressure were used to calculate the most profitable stocking rate on a matrix of improved pasture-native range combi- nations. These calculations demanded certain assumptions about returns and costs.
Calf gains decreased very slowly with increasing grazing pres- sure, because milk provided most of their nutritional needs. Because of the nutritional demands on the cow for milk produc- tion, cow gains declined precipitously with increasing grazing pres- sure. Cows lost weight at the highest grazing pressures in this study, even though quality of crested wheatgrass and brome-alfalfa usu- ally are assumed to be excellent.
Returns derive from the sale of calves and dry cows. Certain fixed costs, including but not limited to interest, veterinary and supplement costs, death losses, and transportation, are incurred to maintain an animal unit.
On native range, critical grazing pressure and gains below criti- cal grazing pressures of cows and heifers were much lower than on the improved pastures (Fig. 2, Table 2). Maximum gains of calves
were
nearly the same on range as on crested wheatgrass but loweron
both than on bromealfalfa. Again, cow gains declined sharply When cows lose weight and condition, estms may be delayedand conception rate reduced (Dunn and Kaltenbach 1980, Herd and Sprott 1986). Thus a simplified objective might be to end the grazing season with cows at the same weight as at the start of the season. If cows have lost weight, additional feed must be provided to restore that lost weight; on the other hand, if they have gained weight, less winter feed will be needed and this weight gained can be considered a return.
l.Oy
I-
s
..*.
.
. .
1.0
-t-e
.
. .
.
0.0
I
\ Yeding: l 12: 0.7 1 =A..
Finally, a cost is incurred if a cow does not conceive. In the simplest case, this is the cost of buying a replacement heifer times 1.09 (in the study reported here, 109 bred yearling heifers were needed to produce as many live calves as 100 bred cows), minus the price received when the open cow is sold.
6 0.0
9
-1.p
Results and Discussion
60 0 60Liveweight Gain8 AUD/tonne forage DM
Gains of lactating cows, yearling heifers, and calves declined linearly with increasing grazing pressure (GP) on irrigated brome- grass-alfalfa pastures (Fig. 1, Table 2). There was no indication that any of the graxing pressures imposed were below the critical grazing pressure (i.e., the graxing pressure heavy enough to reduce gains). On dryland crested wheatgrass pastures, on the other hand, critical grazing pressure was estimated as approximately 40 animal-unit days (AUD) per tonne (1 tonne = 1,000 kg) of forage dry matter produced (Fig. 1, Table 2). Below the critical grazing pressure, cow, heifer, and calf gains remained approximately con- stant at 1.27,l. 16, and 0.97 kg/ day, respectively. Above the critical
Fig. 2. Grasingpressure and average abily gains ADG) of kzctating cows, yearling heifers. and calves on native range, 1981-85.
with increasing grazing pressure above the critical grazing pres- sure, and cows lost weight at the highest grazing pressures. Year- ling heifers, which still had the potential for rapid growth, showed a higher rate of gain below the critical graxing pressure than did cows, and heifer gains declined more slowly with increasing grax- ing pressure, as they did on improved pastures.
Conception Rates
Data on conception rate do not include first-calf heifers, which
Tsble 2. Relati-blp of aversp daily gdm (ADG)
of
lactating
cons, yeullng bdfar, and calves, and conceptron rate (C) of cows, to 3rsziq prenure (GP, mtmd-lmit-day&nne of barbage dry matter produced) OII irrigated bromepu-alfah, dryland created wbutpm, and mixed-paw native mwmPasture, parameter and sample siz.c (n)
Bromegrass-alfalfa (n = 9) Cow ADG
Heifer ADG Calf ADG Conception rate
Crested wheatgrass (n = 10) Cow ADG
Heifer ADG Calf ADG
Conception rate, 1979 Conception rate, 1980 Conception rate. 1981& ‘82 Conception rate, 1979. ‘81 & ‘82
Native range (n = 14) Cow ADG Heifer ADG Calf ADG
Critical GP, AUDI t
41.1
40.2 40.1 42.0 28.1 6.6 47.0 41.0
18.9 15.6 9.3
Units
ks ke ks %
ke kg kg z!
;
ke kg k
Estimates of pcrfomancc Below critical
GP Above critical GP
ADG = 2.69 - 0.0477 GP ADG = 2.50 - 0.0170 GP ADG = 1.33 - 0.0104 GP 100 C = 129 - 0.708 GP
1.27 ADG = 5.77 - 0.112 GP 1.16 ADG = 2.85 - 0.0421 GP 0.97 ADG = 1.47 - 0.0119 GP
100 C q I17 - 0.67 GP 100 C= 104-0.67GP 100 C = 129 - 0.67 GP 100 C = 125 - 0.67 GP
0.52 ADG = I .39 - 0.0459 GP 0.81 ADG = 1.16 - 0.0222 GP 0.94 ADG = 1.00 - O&l607 GP
P
0.52. 0.40, 0.84. 0.86’
0.84*+ 0.84.. 0.44, 0.83’. 0.91.. 0.96** 0.81.’
0.75** 0.71’. 0.59’ +, l and ** indicate regression is &nifiint at the IO,5 and 1% probability hd, I’eWdVdY.
were bred at the University of Wyoming, Laramie, in 1978-1979 to calve in January and February rather than in March and April with the older cows. In later years heifers were bred at the High Plains Grasslands Research Station, but numbers in all years were too small to provide reliable data on conception rate.
Cow breeding data from 1978 also were excluded from calcula- tions of the response function because of reproductive problems in newly purchased cows. Only 17 of the 32 cows purchased in 1978 calved in 1979, while 28 of the 34 cows raised at High Plains Grasslands Research Station calved.
Timing and length of breeding season had no apparent effect on conception rate. The response of conception rate to grazing pres- sure followed the same model as did liveweight gain. On brome- alfalfa, conception rate was 100% below the critical grazing pres- sure of 41.1 AUD/tonne of herbage dry matter produced, then declined linearly with further increases in grazing pressure (Fig. 3, Table 2).
l~j--. .-.
t .
s -
S .
8
d -
Bromcallalfe I*: 0.86 0\
.
* . lOtO 01901
AUD/tonne
- . o-0
\
'81-i
. 9
my%
79Created .
wboatsress
\ '20 ) P: 0.90
0 80
for8ge DY
Fig. 3. Gras& pressure and conception rates of cows on irrigated bromegrass-avava or drylondcrested wheotgross springpastures. 1979- 19g2.
The response on crested wheatgrass was more complex. The rate of decline in conception rate with increasing grazing pressure seemed to be similar in all years, but the critical grazing pressure varied widely, from 6.6 AUD/ tonne in 1980 to 47.0 AUD/ tonne in
1981 and 1982.
Annual variation in the rate of maturity of crested wheatgrass, caused by variation ‘in temperature and precipitation, may be responsible. In 1980 conception rates began to decline at a very low
JOURNAL OF RANGE MANAGEMENT 41(s), September 1988 439
grazing pressure. June of 1980 was the driest June in 104 years of records. As a result, crested wheatgrass matured early with a resulting rapid decline in quality. Crude protein concentration of crested wheatgrass was 9.8% on 12 June 1980~s. 12.5% on 11 June
1981 (Adams 1986). Brome-alfalfa, under irrigation, maintained higher crude protein levels in both years and showed less difference between years, 13.8% and 15.4% respectively. Because weather conditions during 1980 deviated substantially from normal, the mean response of conception rate to grazing pressure over 1979, 1981, and 1982 was used to calculate optimum stocking rate on crested wheatgrass.
Caleulating the Most Protitable Stocking Rate
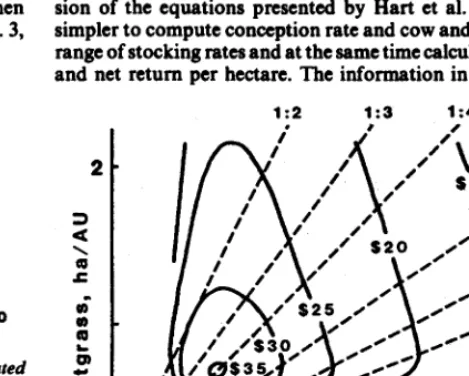
The most profitable stocking rate can be calculated by an expan- sion of the equations presented by Hart et al. (1988), but it is simpler to compute conception rate and cow and calf gains over a range of stocking rates and at the same time calculate values, costs, and net return per hectare. The information in Figure 4 was so
Range, ha/AU
generated. Optimum stocking rate and ratio of crested wheatgrass to native range will depend upon range types, forage production, grazing season, production costs, and livestock prices. Level of management (Wilson et al. 1987) and marketing strategies (Ethridge et al. 1987) also influence returns. Finally, these calculations are based on short-term studies and do not consider possible long-term effects of stocking rate (Torell and Hart 1988).
A 42day grazing season from 1 June to 12 July was assumed on the improved pasture, with forage production of 2,500 and 1,600 kg/ha of dry matter on brome-alfalfa and crested wheatgrass, respectively, during the time. Cattle would graxe native range for 112 days from 13 July to 1 November. Calves would be weaned 20 September so would bc on range only 70 days. Forage production on range was set at 1,200 kg/ha.
Livestock prices of $1.50 per kg for weaned calves, $438 for a 500-kg dry cow in September, and $478 for a pregnant 360-kg heifer at the same date were taken from the 1980-84 averages given in Kearl(l985). Thus the total cost of replacing an open cow is s40 times 1.09 or $43.60. Herd and Sprott (1985) indicate 4.1 kg of shelled corn or its energy equivalent are required for 1 kg of gain by a mature cow. The average price of corn was So. lOS/kg in 1980-84 (USDA 1984); 1 kg of cow gain was valued at 4.1 times SO. 105 or $0.43. Daily fixed costs per AU were estimated at $0.30 from data in Jose et al. (1985) and Kearl(l984); these include interest costs of $0.25 per day.
On improved pastures, conception rate remained at 100% until stocking rate increased beyond the point of maximum net return (Fig. 3). A conception rate of 100% did not mean a 100% weaned calf crop. We found that 95% of the cows and 84% of the heifers which tested pregnant in late summer produced live calves the following spring. Of those producing live calves, 95% of the cows and 98% of the heifers weaned those calves. Thus 90% of the pregnant cows and 82% of the pregnant heifers weaned calves the following year or, as stated in Material and Methods, 109 bred heifers are needed to produce as many calves as 100 bred cows.
Loss of weight by cows limited the stocking rates which could be sustained. At stocking rates in the permissible range of cow gains or losses, conception rate remained at 100%. Calfweaning weights, assuming a calf weight of 100 kg at the start of grazing on 1 June, varied only from 188 to 170 kg over all stocking rates and crested wheatgrass/range ratios simulated, reflecting the relative insensi- tivity of calf gains to stocking rate.
The optimum combination of 0.66 ha of crested wheatgrass and 2.60 ha of range per animal unit, equal to 1 ha of crested wheatgrass per 3.94 ha of range, returned $35.701 ha to land, labor, and man- agement (Fig. 4). This is a much higher ratio of crested wheatgrass to range than is usually used or recommended. Cordingly and Kcarl(1975) based their calculations for “a typical northern plains ranch” (range type and productivity unspecified) on 1 ha of crested wheatgrass per 12.1 ha of range. Houston and Urick (1972) used 1 ha of crested wheatgrass-alfalfa per 8.6 ha of range in Montana; botanical composition was similar to our range, but average pro- duction was only 740 kg/ ha. Hart et al. (1983b) used 1 ha of
crested
wheatgrass per 11.3 ha of the same range used in this study; average forage production was 1,020 kg/ ha. Our calculations indicate pro- duction at such a wide ratio of crested wheatgrass to range would be greater than that on optimally stocked native range alone but less than that from the optimum ratio and stocking rate on a crested wheatgrass-range system. For example, maximum return at a 1:10 ratio of crested wheatgrass to range was calculated as $23.671 ha, on 0.53 ha of crested wheatgrass and 5.3 ha of range per AU (Fig. 4). This return is Zoo/o higher than the $19.77/ha return calculated for optimally stocked range alone (at 4.53 ha/ AU) but 33% less than the return of $35.7O/ha from the optimum stocking rate (3.26 ha/AU) and optimum ratio of crested wheatgrass to range (1:3.94).
Two factors may account for the large increase in net return formerly predicted from a ratio of crested wheatgrass to range of
1:lO. First, net returns from range alone were underestimated because the range was understocked. Houston and Urick (1972) provided 10.4 ha of range per AU and Hart et al. (1983b) provided 10 ha/ AU, but our calculations predict maximum return at 4.53 ha/ AU. Predicted net return at a stocking rate of 10 AU/ ha for a M-day grazing season was $14.62/ha. The combination of 0.53 ha of crested wheatgrass and 5.3 ha of range per AU (A 1:lO ratio) should return $23.67/ha or 62% more. This is in line with pre- viously cited estimates of increased returns which can be expected from seeding 1 ha of crested wheatgrass complementary pasture per 8 to 12 ha of range.
Secondly, other analyses may have overestimated the cost of an open cow, considering each open cow equivalent to loss of income from 1 calf. But if open cows are detected at the end of the grazing season, they can be sold for almost enough to cover the cost of replacements. Figures cited earlier (Kearl 1985) indicated each open cow can be replaced at a net cost of $43.60. Thus the 9% reduction in conception considered by Cordingly and Kearl(1975) would cost only $0.87/ha at the optimum stocking rate of 4.53 ha/AU on range.
Literature Cited
Adams, L.D. 1986. Performance of beef cattle on delayed-spring use graz- ing systems. MS. Thesis, Div. of Animal Science, Univ. of Wyomin& Laramie.
Cook,G.W., J.W. Walker,M.H.Ebberts,L.R.IUttcnbotme,E.T~Butlett, D.A. Cramer. P.T. FarerUn, and M.C. MeKean. 19(13. Alternative grass and grain feeding syst&rs for beef production. Colorado Agr. Sta. Bull. 579s (rev.)
Cordbrgly, R.V., and W.G. KcuI. 1975. Economics of range reseeding in the plains of Wyoming. Wyoming Agr. Exp. Sta. Res. J. 98.
Dunn, T.G., and C.C. Kaltenbrcb. 1980. Nutrition and the postpartum interval of the ewe, sow and cow. J. Anim. Sci. 51 (Supp1.2):29-39. Etbridp, D.E., J.D. Nanee, and B.E. DabI. 1987. Integration of cattle
production and marketing strategies with improved pastures and native range. J. Range Manage. &199-202.
Godfrey, B., L. Sharp, and E. Sellasie. 1979. The economic returns from seeding an area to crested wheatgrass. Idaho Agr. Exp. Sm. Bull. 588. Hut, R.H. 1978. Stocking rate theory and its application to grazing on
rangelands. P. 547-550. In: Hydcr, D.N. (ed.) Proc. 1st Internat. Range. Congr. Sot. for Range Manage., Denver, Colo.
Hut, R.H. 1986. Stocking rate theory and grazing research: a modeling aDDrD8Ch. P. 301-310. In: Gudmondsson, 0. (ed.) Grazing Research at l&them Latitudes. Plenum Press, New kork. -
Hart,R.H.,O.M.AbdaBa,D.H.CIark,M.B.Mamhall,M.H.HamId, J.A. Ha8er, end J.W. Waggoner Jr. 19838. Quality of forage and cattle diets on the Wvomina High Plains. J. Range Manage. 3646-51.
Hart, R.H.,-MJ. &n&l, P.S. Test, and-M.A. S&b. Hgg.Cattle,vegeta- tion and economic responses to grazing systems and grazing pressure. J. Range Manage. 41:282-286.
Hert,R.H.,J.W.Wag8oacrJr,D.H.Clark,C.C.K&enbeeh,J.A.Hager, end M.B. Marshall. 1983b. Bed cattle performance on crested wheat- grass plus native range vs. native range alone. J. Range Manage. 3638-40.
Herd, D.B., and L.R. Sprott. 1985. Body condition, nutrition and repro- duction of beef cows. Texas Agr. Ext. Serv. Bull. B-1526.
Houston, W.R., and J.J. Urlek. i972. Improved spring pastures, cow-calf production, and stocking rate carry-over in the Northern Great Plains. USDA Tech. Bull. 1451.
JefferRs, N.W., R.L. Leng, M. May, and L. Landers. 1967. Cow-calf production on seeded and native range. Wyoming. Agr. Exp. Sta. Bull. 472.
Jose, D., L. BItnay, D. Duey, P. MHer, J. Robb, and L. Sbeffteld. 1985. Estimated crop and livestock production costs. Nebraska Coop. Ext. Serv. Ext. Circ. 84-872.
Keul, W.G. 19g4. Economics of range reseeding. Wyoming Agr. Exp. Sta. AD-79-01-2R.
Keart, W.G. 1985. Average prices of cattle and calves, eastern Wyoming and western Nebraska: 1968-1984. Wyoming Agr. Exp. Sta. B-730. Lodge, R.W. 1970. Complementary grazing systems for the Northern
Great Plains. J. Range Manage. 23:268-271.
Man&e, L.L., and T.J. Conku~. 1986. Compkmentary rotation grazing system in western Northern Dakota. North Dakota Farm Res. 44:(2)6-10.
Mdlvain, E.H., end M.C. Shoop. 1973. Use of farmed forage and tame pasture tocomplement native range. p. l-l to 1-19 In:Raker, F.H. (cd.). Great Plains Agr. Council Publ. #63.
National Oceanic and Atmoepherk Administration. 1987.1986 local cli- matological data. Annual summary with comparative data. Cheyenne, Wyoming. U.S. Dept. of Commerce. Asheville, North Carolina. Neal, D.L., P.O. Cur& end M.J. MO&. 1976. Sampling herbaceous
native vegetation with an electronic capacitance instrument. J. Range Manage. 2974-77.
Quigky, T.M., J.M. Skovlin, and J.P. Workmen. 1984. An economic analysis of 2 systems and 3 levels of grazing on ponderosa pine- bunchgrass range. J. Range Manage. 37309-312.
Samuel, M.J., and G.W. Howud. 1982. Botanical composition of summer cattle diets on the Wyoming High Plains. J. Range Manage. 35305~308.
Slme, P.L. 1984. Use of forage systems to improve the productivity of stocker and cow-calf operation. Proc. O-K Reef Cattle Conf.. p. H-1 to H-6. Arkansas City, Rans. 15-16 Nov. 1984.
Smolkk, S, end S.B. Skn. 1974. Reef production on native range, crested wheatgrass, and Russian wildrye pastures. J. Range Manage. 271433436.
Spielmen, K.A., end R.L. Sbene. 1985. Ranch resource differences affect- ing profitability of crested wheatgrass as a spring forage source. J. Range Manage. 38:365-369.
Stevenson, A., R.E. Beum~r, end G.E. Schuuun. 1984. High Plains Grasslands Research Station, Cheyenne, Wyomingdetailed soil sur- vey. USDA, Agr. Res. Serv. and Soil Conserv. Serv., and Univ. Wyom- ing Agr. Exp. Sta. l-84/ lC/3.62.
Torell, L.A., end R.H. Hart. 1988. Economic considerations for efficient rangeland use. P. 71-76 In: White, R.S., and R.E. Short (cds.) Proc. Symp. Achieving Efficient Use of Rangeland Resources, Montana State Univ. Agr. Exp. Sta. and USDA-ARS, Rozeman and Miles City, Mont. USDA. 1984.Agriculturalstatistics. U.S. Govt. Printing off., Washington,
D.C.