Copyright © 2004, American Society for Microbiology. All Rights Reserved.
Population-Based Hematologic and Immunologic Reference Values
for a Healthy Ugandan Population
Eric S. Lugada,
1,2* Jonathan Mermin,
2Frank Kaharuza,
2Elling Ulvestad,
3Willy Were,
2Nina Langeland,
4Birgitta Asjo,
3Sam Malamba,
2and Robert Downing
2Center for International Health, University of Bergen,1and Department of Microbiology and Immunology,3and Department of
Internal Medicine,4Haukeland University Hospital, Bergen, Norway, and Centers for Disease Control and Prevention
(CDC)—Uganda, Global AIDS Program, National Center for HIV, STD and TB, CDC, and Uganda Virus Research Institute, Entebbe, Uganda2
Received 12 August 2003/Returned for modification 1 October 2003/Accepted 10 October 2003
To assess the validity of the reference values for hematologic and immunologic indices currently used in Africa, we evaluated blood samples from 3,311 human immunodeficiency virus (HIV)-negative Ugandans aged 1 week to 92 years. Erythrocyte, hemoglobin, and hematocrit levels and mean corpuscular volume all signif-icantly increased with age (P< 0.001) and were independent of gender until the age of 13 years, after which the levels were higher in males than in females (P< 0.001). White blood cell, neutrophil, lymphocyte, basophil, and monocyte counts significantly declined with age until the age of 13 years (P< 0.001), with no differences by gender, while platelet counts declined with age (P< 0.001) and showed differences by gender only among adults older than age 24 years. CD4ⴙ- and CD8ⴙ-cell counts declined with age until the age of 18 years;
thereafter, females had higher counts than males. The absolute values for many of these parameters differed from those reported for populations outside Africa, suggesting that it may be necessary to develop tables of reference values for hematologic and immunologic indices specific for the African population. This may be particularly important with regard to CD4ⴙ-cell counts among children because significant differences in
absolute and percent CD4ⴙ-cell counts exist between the values for Western populations and the values for the
population evaluated in our study. These differences could influence the decision to initiate antiretroviral therapy among children infected with HIV.
The reference values of hematologic and immunologic indi-ces currently used in Africa are derived from data collected for populations living in industrialized countries (27). The few small studies with African populations that have been reported
indicate differences in normal values compared with those for populations in industrialized countries (2, 3, 5, 8, 10, 23, 25, 26). Ethnic origin, genetics, gender, altitude, and environmen-tal factors, especially pathogens, may influence some values of
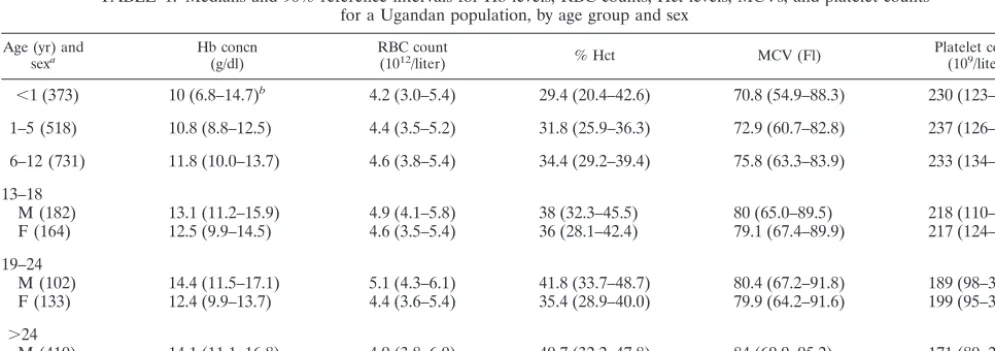
TABLE 1. Medians and 90% reference intervals for Hb levels, RBC counts, Hct levels, MCVs, and platelet counts for a Ugandan population, by age group and sex
Age (yr) and
sexa Hb concn(g/dl) RBC count(1012/liter) % Hct MCV (Fl) Platelet count(109/liter)
⬍1 (373) 10 (6.8–14.7)b 4.2 (3.0–5.4) 29.4 (20.4–42.6) 70.8 (54.9–88.3) 230 (123–487) 1–5 (518) 10.8 (8.8–12.5) 4.4 (3.5–5.2) 31.8 (25.9–36.3) 72.9 (60.7–82.8) 237 (126–376) 6–12 (731) 11.8 (10.0–13.7) 4.6 (3.8–5.4) 34.4 (29.2–39.4) 75.8 (63.3–83.9) 233 (134–355) 13–18
M (182) 13.1 (11.2–15.9) 4.9 (4.1–5.8) 38 (32.3–45.5) 80 (65.0–89.5) 218 (110–327) F (164) 12.5 (9.9–14.5) 4.6 (3.5–5.4) 36 (28.1–42.4) 79.1 (67.4–89.9) 217 (124–353) 19–24
M (102) 14.4 (11.5–17.1) 5.1 (4.3–6.1) 41.8 (33.7–48.7) 80.4 (67.2–91.8) 189 (98–306) F (133) 12.4 (9.9–13.7) 4.4 (3.6–5.4) 35.4 (28.9–40.0) 79.9 (64.2–91.6) 199 (95–368) ⬎24
M (410) 14.1 (11.1–16.8) 4.9 (3.8–6.0) 40.7 (32.2–47.8) 84 (69.9–95.2) 171 (80–288) F (435) 12.5 (10.1–14.3) 4.5 (3.7–5.3) 36.2 (29.6–41.4) 81.4 (67.7–92.6) 198 (100–297)
aValues in parentheses are numbers of subjects. M, male; F, female. bThe 90% reference intervals are provided in parentheses.
* Corresponding author. Mailing address: Centre for International Health, University of Bergen, Armauer Hansens Hus, 5021 Bergen, Norway. Phone: 47 55 97 49 80. Fax: 47 55 97 49 79. E-mail: ericlugada @yahoo.com.
29
on August 17, 2020 by guest
http://cvi.asm.org/
hematologic and immunologic indices, suggesting that the de-velopment of reference values for the African population may be beneficial for improved quality of health care.
Reference values of hematologic and immunologic indices are necessary for the assessment of health and illness. Aside from their use in routine assessments for anemia, infection, and blood disorders, they are important surrogate markers for assessments of immune status, disease progression, and re-sponse to antiretroviral treatment in individuals infected with human immunodeficiency virus (HIV) (16, 18–20). The CD4⫹
-cell count is an essential tool for clinical monitoring of anti-retroviral treatment. CD4⫹-cell counts change dramatically
with age, and specific recommendations for the initiation and monitoring of therapy among HIV-positive children have been made on the basis of data from North America and Europe (17). At present, 29.4 million people in sub-Saharan Africa are infected with HIV, and 3 million (10%) of these are children under the age of 15 years (12). As antiretroviral therapy be-comes more widely available, it is important that normal ref-erence values for CD4⫹-cell counts as well as other
immuno-logic and hematoimmuno-logic markers be developed for the African population in order to appropriately manage individuals in-fected with HIV.
To assess the validity of current reference values of hema-tologic and immunologic indices for an African population, we collected blood samples from more than 3,000 HIV-negative Ugandans aged 1 week to 92 years.
MATERIALS AND METHODS
Subjects.Between January and September 2002 we conducted a population-based cross-sectional survey to investigate risk factors for human herpesvirus 8 infection in a rural parish in eastern Uganda. We administered a household census to all homes and enrolled all willing adults and children resident in the study area during the previous 6 months. Moribund, mentally ill, and institution-alized persons were not requested to participate. The demographic characteris-tics of all participants were recorded.
Consent.Informed consent was obtained in Luganda, the language commonly spoken locally. Adult participants in the study provided consent for minors younger than age 17 years, in addition to individual assent for participants aged 13 to 17 years. Permission for HIV testing was requested from all participants, and counseling was offered to all consenting participants before the HIV test results were given.
Laboratory.Blood was collected between 9:00 a.m. and 4:00 p.m. by venipunc-ture, placed in 3-ml Vacutainer tubes (Becton Dickinson, Franklin Lakes, N.J.) containing EDTA, and transported at ambient temperature to the Uganda Virus Research Institute laboratory at Entebbe. Serological tests for HIV were per-formed by using a standard HIV testing algorithm of two enzyme-linked immu-nosorbent assays in parallel with Western blotting, as required; reverse transcrip-tion-PCR was carried out to confirm the HIV infection status of children younger than age 18 months who were positive by enzyme-linked immunosorbent assay. A complete blood cell count (CBC) and differential were performed within 12 h of the blood draw by using the Act 5Diff instrument (Beckman Coulter). For determination of CD4⫹and CD8⫹cell counts, TriTEST reagents (CD3,
fluo-rescein isothiocyanate/CD4, phycoerythrin/CD45, peridinin chlorophyll protein and CD3, fluorescein isothiocyanate/CD8, phycoerythrin/CD45, peridinin chlo-rophyll protein) were used to stain peripheral blood mononuclear cells according to the protocol of the manufacturer. Blood was stained within 12 h of collection, and the results were analyzed within 24 h. Flow cytometry was performed with a FACScan instrument and MultiSET software (Becton Dickinson) modified to accept manual entry of the total white cell count from the CBC and the per-TABLE 2. Medians and 90% reference intervals for WBC and WBC subset counts for a Ugandan population, by age group
Age (yr) (no. of subjects)
Cell count (109/liter [90% reference interval])
WBCs Neutrophils Lymphocytes Monocytes Eosinophils Basophils
⬍1 (373) 8.8 (4.1–15.8) 2.1 (0.9–4.4) 5.1 (1.9–10.3) 0.68 (0.22–1.83) 0.38 (0.07–1.85) 0.09 (0.02–0.30) 1–5 (518 7.8 (4.9–13.6) 2.1 (1.0–3.9) 4.4 (2.4–8.4) 0.48 (0.26–1.04) 0.58 (0.14–2.03) 0.07 (0.03–0.17) 6–12 (731) 7.1 (4.4–11.5) 1.8 (0.9–3.6) 3.6 (2.2–5.9) 0.42 (0.24–0.75) 0.91 (0.20–3.14) 0.05 (0.02–0.12) 13–18 (346) 6.2 (4.1–10.7) 1.8 (0.9–3.5) 2.9 (1.7–4.7) 0.38 (0.21–0.73) 0.91 (0.26–2.77) 0.04 (0.02–0.10) 19–24 (235) 5.8 (3.7–9.7) 1.8 (1.0–3.5) 2.6 (1.3–4.1) 0.34 (0.18–0.62) 0.82 (0.19–2.42) 0.04 (0.02–0.08) ⬎24 (845) 5.3 (3.4–8.7) 1.8 (0.84–3.37) 2.4 (1.4–4.2) 0.32 (0.17–0.59) 0.58 (0.13–2.11) 0.03 (0.01–0.07)
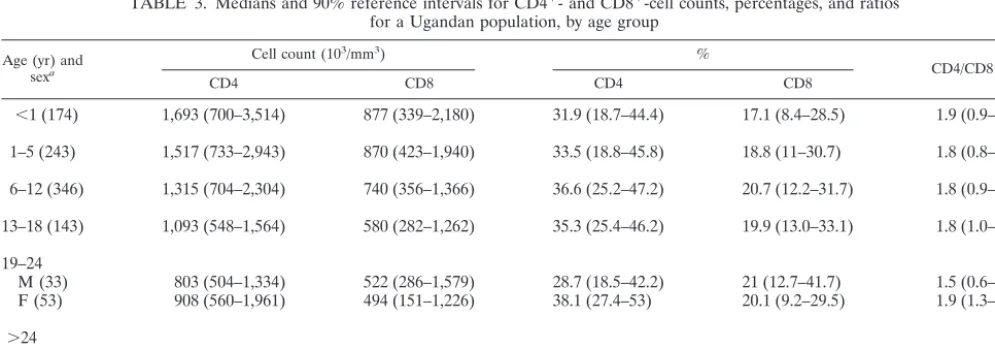
TABLE 3. Medians and 90% reference intervals for CD4⫹- and CD8⫹-cell counts, percentages, and ratios for a Ugandan population, by age group
Age (yr) and sexa
Cell count (103/mm3) %
CD4/CD8 ratio
CD4 CD8 CD4 CD8
⬍1 (174) 1,693 (700–3,514) 877 (339–2,180) 31.9 (18.7–44.4) 17.1 (8.4–28.5) 1.9 (0.9–3.5) 1–5 (243) 1,517 (733–2,943) 870 (423–1,940) 33.5 (18.8–45.8) 18.8 (11–30.7) 1.8 (0.8–2.9)
6–12 (346) 1,315 (704–2,304) 740 (356–1,366) 36.6 (25.2–47.2) 20.7 (12.2–31.7) 1.8 (0.9–3.1)
13–18 (143) 1,093 (548–1,564) 580 (282–1,262) 35.3 (25.4–46.2) 19.9 (13.0–33.1) 1.8 (1.0–2.9)
19–24
M (33) 803 (504–1,334) 522 (286–1,579) 28.7 (18.5–42.2) 21 (12.7–41.7) 1.5 (0.6–2.5) F (53) 908 (560–1,961) 494 (151–1,226) 38.1 (27.4–53) 20.1 (9.2–29.5) 1.9 (1.3–4.6)
⬎24
M (174) 754 (362–1,376) 455 (204–1,174) 33.3 (16.5–45.3) 20.6 (8.4–36.3) 1.6 (0.7–3.5) F (199) 894 (454–1,485) 492 (196–1,133) 36.5 (22.5–48.3) 20.6 (10.2–33.7) 1.9 (1.0–3.1)
aValues in parentheses are numbers of subjects. M, male; F, female.
on August 17, 2020 by guest
http://cvi.asm.org/
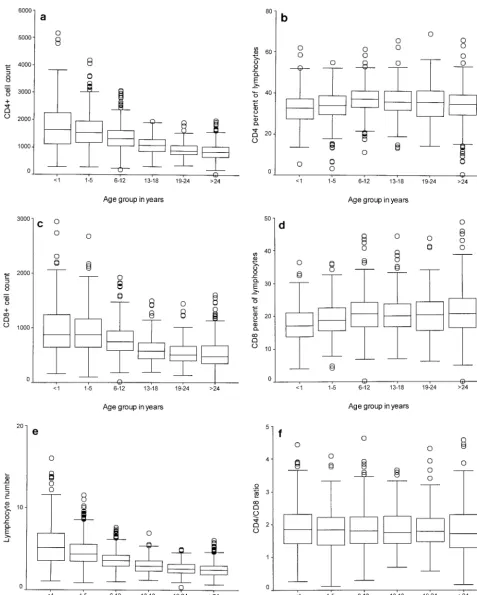
FIG. 1. Box and whisker plot showing the median, interquartile, and range CD4⫹- and CD8⫹-cell counts (103cells per milliliter), lymphocyte counts (109cells per liter), and proportions by age group. The heights of the boxes in the box plots indicate the interquartile lengths. The central bar in each box is the median. Whiskers extend to the most extreme values to 1.5 box lengths from the edge of the box. Circles indicate outliers beyond 1.5 box lengths from the edge of the box. (a) CD4⫹-cell count by age group; (b) CD4⫹-cell proportion by age group; (c) CD8⫹-cell count by age group; (d) CD8⫹-cell proportion by age group; (e) WBC count by age group; (f) CD4/CD8 ratio by age group.
on August 17, 2020 by guest
http://cvi.asm.org/
centage of lymphocytes derived from Attractors software (Becton Dickinson), which reports a three-part differential based on cell surface markers and side scatter. By use of this dual-platform approach, the MultiSET software reported the absolute CD3⫹CD4⫹and CD3⫹CD8⫹cell counts for the specimen.
Ethics.Study protocols were approved by the Science and Ethics Committee at the Uganda Virus Research Institute, the Uganda National Council for Sci-ence and Technology, and the Institutional Review Board at the Centers for Disease Control and Prevention (Atlanta, Ga.).
Statistics.Data were entered into Epi-Info software (version 6; Centers for Disease Control and Prevention) and analyzed by using SAS software (version 9; SAS Institute, Cary, N.C.). The normal distribution was tested by the Kolmog-orov-Smirnov test. To investigate the normal distribution of the dependent variables, we plotted the cumulative quantiles for each variable versus the known quantiles of the normal distribution plot (normal Q-Q plots). The sample pop-ulation was grouped according to the age and gender distribution, and the median was used as a measure of central tendency. The 5th and 95th percentile distributions of the dependent variables were used to specify the 90% reference interval. Kruskal-Wallis nonparametric tests were used to test for differences by age group, and Mann-Whitney U tests were used to test for differences by gender. In the absence of significant differences by gender, the data for all subjects were combined and analyzed as one group. An error probability (P
value) of⬍0.05 was considered significant. Box and whisker plots for lymphocyte subsets were plotted to compare the distribution of this variable across age groups.
RESULTS
A total of 3,421 individuals, 94% of the total population of the community, participated in the study; data for 3,048 indi-viduals were included in the analyses. Of those indiindi-viduals whose data were excluded, 110 (29%) were HIV positive and data for age, gender, or CBCs were missing for 263 (71%). Testing for CD4⫹- and CD8⫹-cell counts was conducted for
1,365 randomly selected samples. Fifty percent of the partici-pants were female, and 65% were children younger than 18 years of age.
Hematologic indices. The medians and the 5th and 95th percentile reference intervals for the hemoglobin (Hb) level, red blood cell (RBC) count, hematocrit (Hct) level, and mean corpuscular volume (MCV) are presented in Table 1. There were significant differences in hematologic parameters by age and gender; Hb levels, RBC counts, Hct levels, and MCVs increased with age until age 13 years (P ⬍ 0.001). Absolute values for Hb levels, RBC counts, Hct levels, and MCVs were significantly higher among male adults than female adults older than age 13 years (P⬍0.001). Significant differences by gender were not detected for any of the indices for children younger than 12 years of age.
Platelet counts.Platelet counts declined steadily with age up to the age of 18 years (P⬍0.001) (Table 1). The values were similar for both males and females for those under 24 years
of age and significantly higher among adult (age,⬎18 years) female participants than adult male participants (P ⬍ 0.001).
WBC counts.Table 2 shows the medians and the 5th and 95th percentile reference intervals for the total white blood cell (WBC), neutrophil, lymphocyte, basophil, and mono-cyte counts; the counts of all of these cells declined with age. Significant differences among age groups were detected among children younger than age 12 years (P ⬍ 0.001). Eosinophil levels markedly increased until 13 years of age and declined thereafter. None of the values for the leukocyte subset showed any differences by gender.
CD4ⴙ- and CD8ⴙ-cell counts.The medians and the 5th and
95th percentile reference intervals for absolute lymphocyte, CD4⫹-cell, and CD8⫹-cell counts displayed dramatic declines
from birth through 18 years of age (P⬍0.001) (Table 3). The CD4⫹- and CD8⫹-cell percentages increased progressively
from birth to adulthood. The distributions of the lymphocyte subset were statistically different by age and gender; among adults, females had higher CD4⫹- and CD8⫹-cell counts and
percentages than males, and children under 18 had higher CD4⫹- and CD8⫹-cell counts than adults. No
gender-spe-cific differences were seen for children younger than age 18 years.
Box and whisker plots for WBC, CD4⫹-cell, and CD8⫹-cell
counts and ratios by age are shown in Fig. 1. Individual plots of absolute WBC, CD4⫹-cell, and CD8⫹-cell counts showed
re-markable declines with age up to the age of 19 years, when values typical of those for adults were attained. The percent-ages of CD4⫹and CD8⫹cells increased with age and leveled
off at the age of 6 years, while the CD4⫹-cell/CD8⫹-cell ratio
was fairly constant among all age groups. There were wider variations in WBC, CD4⫹-cell, and CD8⫹-cell counts among
the younger age groups; but the variation was less among the adult age groups.
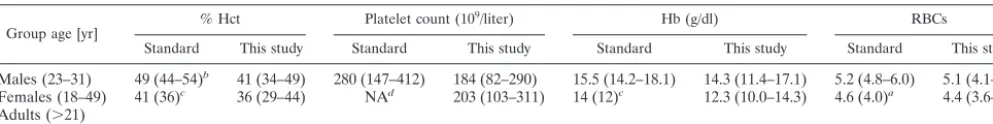
The means and the 5th and 95th reference intervals for the Ugandan population evaluated in the present study and those collected for Western populations are summarized in Table 4 (27). In Uganda, Hb levels, RBC counts, Hct levels, MCVs, platelet counts, WBC counts, and neutrophil counts are lower than standard reference values. WBC, eosinophil, and mono-cyte counts are higher. Inspection of the normal probability plots for all dependent variables for this population in Uganda revealed that they matched the test distribution and were rea-sonably normally distributed.
TABLE 4. Means and 90% reference intervals for absolute units of WBC and RBC subsets for a Ugandan population compared with standard valuesa
Group age [yr] % Hct Platelet count (10
9/liter) Hb (g/dl) RBCs
Standard This study Standard This study Standard This study Standard This study
Males (23–31) 49 (44–54)b 41 (34–49) 280 (147–412) 184 (82–290) 15.5 (14.2–18.1) 14.3 (11.4–17.1) 5.2 (4.8–6.0) 5.1 (4.1–6.0) Females (18–49) 41 (36)c 36 (29–44) NAd 203 (103–311) 14 (12)c 12.3 (10.0–14.3) 4.6 (4.0)a 4.4 (3.6–5.3) Adults (⬎21)
aStandard values were obtained fromWintrobe’s Clinical Hematology, 10th ed. (27). bUnless indicated otherwise, the values in parentheses are 90% reference intervals. cThe values in parentheses are standard deviations.
dNA, not available.
on August 17, 2020 by guest
http://cvi.asm.org/
DISCUSSION
The values of several important immunologic and hemato-logic indices for more than 3,000 apparently healthy HIV-negative children and adults from Uganda were different from the standard reference values. Among adults, most values of hematologic indices were lower than the standard values (27). Similar differences have previously been reported for other African populations (1, 2, 5). However, most of the previous studies had less than 200 individuals and did not cover the entire age range of the population. Similar to studies of West-ern populations, Hb levels, Hct levels, and absolute RBC counts for children in Uganda are comparable from infancy through the age of 12 years, regardless of gender (9, 24). Thereafter, males tend to have higher Hb and Hct levels. The lower Hb levels detected in the Ugandan adult population compared with those detected in Western adult populations have been reported in other studies with African populations (1, 2, 5). This may be due to low levels of dietary iron intake, which cause an iron deficiency state, impaired hematopoiesis, chronic blood loss due to hookworm infestation (2), or chronic
Plasmodiuminfection.
The low platelet counts and the differences in platelet counts by gender in this population are similar to those detected in other studies with African populations (1, 3, 10, 25). The cause of the low platelet counts among populations of African origin is unknown. While environmental factors and undetected ill-nesses have been suggested to explain the difference (1, 10), genetic factors may also play a role (3).
The WBC and neutrophil counts in this population are sim-ilar to those reported in studies of other African and Afro-Caribbean populations and are lower than standard values (3, 8, 13, 21, 23, 25). The etiology of these differences is unknown, although dietary, environmental, and genetic factors have been proposed (3, 8, 23).
The eosinophil counts found in this study are similar to those reported in other studies from Africa (2, 8, 21, 23). They are consistently higher than those found in Western subjects (27). However, the relative eosinophilia does not appear among African or Afro-Caribbean residents in Europe (3) or among black residents in Cape Peninsula, an urban suburb in South Africa (2), suggesting an environmental rather than a genetic etiology (8). This eosinophilia that was observed may result from a high prevalence of infestations with helminths, partic-ularly schistosomes, in this community resident at the shores of Lake Victoria, predominantly engaged in fishing.
The progressive declines in the absolute values of the total WBC counts and the counts of the CD4⫹- and CD8⫹-cell
subsets from infancy to adulthood and the higher values for women are similar to other findings (6, 7, 11, 15, 22). An
important observation in our study is that the decline in CD4⫹
-and CD8⫹-cell counts continues throughout childhood until
the age of 18 years. European and American studies have shown that the counts for T-cell subsets for children younger than 10 years of age approximate the counts for adults (4, 14, 28, 29). However, a study from neighboring Kenya (6) also found that CD4⫹- and CD8⫹-cell counts declined with age
until age 10 years, the oldest age group assessed, and that at that age children had not attained the counts detected in adults. Similar to previous reports, women had higher numbers of CD4⫹cells and percentages than men in this study. Overall,
the population evaluated in this study and that from Kenya (6) tend to have higher CD4⫹-cell counts and CD4⫹-cell/CD8⫹
-cell proportions than populations in Europe, North America, and Asia (4, 7, 11), suggesting an ethnic or environmental etiology. The normal range of CD4⫹-cell counts for the
pop-ulation evaluated in this study is higher than the range of standard Western population-based reference values, which complicates patient management decisions, especially when clinicians must determine the CD4⫹-cell count or percentage
that should be used for HIV-positive children and adults for the initiation of antiretroviral therapy.
The study had several limitations. Despite the large popu-lation-based sample, the health status of the individuals was not assessed and no medical or laboratory examinations were performed. In this community, all consenting apparently health individuals found at home at the time of the survey were recruited. The only specific exclusion criterion used was HIV infection. Although none of the participants was moribund at the time of the study, a proportion could have had minor illnesses. This is unlikely to have affected the median values for the population but may have produced proportionately more extreme values. The influences of environmental factors, preg-nancy, social habits like smoking, dietary components, and lifestyle were not taken into account, yet there is evidence to suggest that they may be responsible for variations in hemato-logic parameters (1, 2, 5, 8). Specimen collection was not conducted at exactly the same time of day for all subjects. The temperature and length of blood storage have been shown to cause alterations in the values for some hematologic parame-ters, and some hematologic parameters have been shown to vary diurnally and day to day, although these differences should have been randomly distributed throughout the study population. All blood samples were shipped at ambient tem-perature and were processed within 12 h, as recommended for hematologic and immunologic investigations. These findings have been drawn from a preliminary study of 3,048 individuals in a single rural community in Uganda. The very high accep-tance rate (94%) for both enrollment in the study and HIV
TABLE 4—Continued
MCV (fl) Eosinophils (109/liter) Monocytes (109/liter) Neutrophils (109/liter) Lymphocytes (109/liter) WBCs (109/liter) Standard This study Standard This study Standard This study Standard This study Standard This study Standard This study
90 (83–97) 82 (69–93) 90 (80)c 80 (67–92)
0.2 (NA) 1 (0.2–3.4) 0.3 (NA) 0.4 (0.06–0.8) 4.4 (1.8–7.7) 2.2 (1.1–5.0) 2.5 (1.0–4.8) 2.7 (1.4–4.1) 7.4 (4.5–11.0) 6.4 (3.8–10.7)
on August 17, 2020 by guest
http://cvi.asm.org/
testing allowed the results to be generalizable to the commu-nity. However, it would be useful to conduct more expansive studies that include information regarding the time of blood collection and the presence of intercurrent illnesses.
In conclusion, there appear to be regional variations in ref-erence values and ranges of hematologic and immunologic indices between the African population and the population in the industrialized West. These data provide region-specific ref-erence values which can be used to guide patient management and interpretation of clinical research findings and which may potentially improve the quality of clinical care provided to patients.
ACKNOWLEDGMENTS
This study was supported by the Centers for Disease Control and Prevention. Eric S. Lugada was supported by the Norwegian govern-ment through the University of Bergen, Bergen, Norway.
REFERENCES
1. Azikiwe, A. N.1984. Platelet count values in healthy Nigeria medical students in Jos. East Afr. Med. J.61:482–485.
2. Badenhorst, C. J., J. Fourie, K. Steyn, P. L. Jooste, C. J. Lombard, L. Bourne, and W. Slazus.1995. The haematological profile of urban black Africans aged 15–64 years in the Cape Peninsula. East Afr. Med. J.72:19–24. 3. Bain, B. J.1996. Ethnic and sex differences in the total and differential white
cell count and platelet count. J. Clin. Pathol.49:664–666.
4. Bofill, M., G. Janossy, C. A. Lee, D. MacDonald-Burns, A. N. Phillips, C. Sabin, A. Timms, M. A. Johnson, and P. B. Kernoff.1992. Laboratory control values for CD4 and CD8 T lymphocytes. Implications for HIV-1 diagnosis. Clin. Exp. Immunol.88:243–252.
5. Coetzee, M. J., P. N. Badenhorst, J. I. de Wet, and G. Joubert. 1994. Haematological condition of the San (Bushmen) relocated from Namibia to South Africa. S. Afr. Med. J.84:416–420.
6. Embree, J., J. Bwayo, N. Nagelkerke, S. Njenga, P. Nyange, J. Ndinya-Achola, H. Pamba, and F. Plummer.2001. Lymphocyte subsets in human immunodeficiency virus type 1-infected and uninfected children in Nairobi. Pediatr. Infect. Dis. J.20:397–403.
7. Erkeller-Yuksel, F. M., V. Deneys, B. Yuksel, I. Hannet, F. Hulstaert, C. Hamilton, H. Mackinnon, L. T. Stokes, V. Munhyeshuli, F. Vanlangendonck, et al.1992. Age-related changes in human blood lymphocyte subpopulations. J. Pediatr.120:216–222.
8. Ezeilo, G. C.1972. Non-genetic neutropenia in Africans. Lancetii:1003– 1004.
9. Flegar-Mestric, Z., A. Nazor, and N. Jagarinec.1999. Reference intervals for haematological parameters in urban school children and adolescents. Clin. Lab. Haematol.21:72–74.
10. Gill, G. V., A. England, and C. Marshal.1979. Low platelet counts in Zambians. Trans. R. Soc. Trop. Med. Hyg.73:111–112.
11. Hannet, I., F. Erkeller-Yuksel, P. Lydyard, V. Deneys, and M. DeBruyere.
1992. Developmental and maturational changes in human blood lymphocyte subpopulations. Immunol. Today13:215–218.
12. The Joint United Nations Programme on HIV/AIDS.December 2002. AIDS epidemic update. The Joint United Nations Programme on HIV/AIDS, Geneva, Switzerland.
13. Kasili, E. G., C. L. Cardwell, and J. R. Taylor.1969. Leucocyte counts on blood donors in Nairobi. East Afr. Med. J.46:676–679.
14. Kotylo, P. K., N. S. Fineberg, K. S. Freeman, N. L. Redmond, and C. Charland.1993. Reference ranges for lymphocyte subsets in pediatric pa-tients. Am. J. Clin. Pathol.100:111–115.
15. Lee, B. W., H. K. Yap, F. T. Chew, T. C. Quah, K. Prabhakaran, G. S. Chan, S. C. Wong, and C. C. Seah.1996. Age- and sex-related changes in lympho-cyte subpopulations of healthy Asian subjects: from birth to adulthood. Cytometry26:8–15.
16. Mellors, J. W., A. Munoz, J. V. Giorgi, J. B. Margolick, C. J. Tassoni, P. Gupta, L. A. Kingsley, J. A. Todd, A. J. Saah, R. Detels, J. P. Phair, and C. R. Rinaldo, Jr.1997. Plasma viral load and CD4⫹lymphocytes as prognostic
markers of HIV-1 infection. Ann. Intern. Med.126:946–954.
17. National Institutes of Health.2001. Guidelines for the use of antiretroviral agents in pediatric HIV infection. December 14. [Online.] http://www .aidsinfo.nih.gov/guidelines/pediatric.
18. O’Brien, W. A., P. M. Hartigan, E. S. Daar, M. S. Simberkoff, J. D. Hamilton, et al.1997. Changes in plasma HIV RNA levels and CD4⫹lymphocyte
counts predict both response to antiretroviral therapy and therapeutic fail-ure. Ann. Intern. Med.126:939–945.
19. Phillips, A. N., C. A. Sabin, J. Elford, M. Bofill, G. Janossy, and C. A. Lee.
1994. Use of CD4 lymphocyte count to predict long-term survival free of AIDS after HIV infection. BMJ309:309–313.
20. Pomerantz, R. J.2001. Initiating antiretroviral therapy during HIV infection: confusion and clarity. JAMA286:2597–2599.
21. Sahr, F., P. K. Hazra, and T. A. Grillo.1995. White blood cell count in healthy Sierra Leoneans. West Afr. J. Med.14:105–107.
22. Shahabuddin, S., I. Al-Ayed, M. O. Gad El-Rab, and M. I. Qureshi.1998. Age-related changes in blood lymphocyte subsets of Saudi Arabian healthy children. Clin. Diagn. Lab. Immunol.5:632–635.
23. Shaper, A. G., and P. Lewis.1971. Genetic neutropenia in people of African origin. Lancetii:1021–1023.
24. Taylor, M. R., C. V. Holland, R. Spencer, J. F. Jackson, G. I. O’Connor, and J. R. O’Donnell.1997. Haematological reference ranges for schoolchildren. Clin. Lab. Haematol.19:1–15.
25. Tsegaye, A., T. Messele, T. Tilahun, E. Hailu, T. Sahlu, R. Doorly, A. L. Fontanet, and T. F. Rinke de Wit.1999. Immunohematological reference ranges for adult Ethiopians. Clin. Diagn. Lab. Immunol.6:410–414. 26. Tugume, S. B., E. M. Piwowar, T. Lutalo, P. N. Mugyenyi, R. M. Grant, F. W.
Mangeni, K. Pattishall, and E. Katongole-Mbidde.1995. Hematological reference ranges among healthy Ugandans. Clin. Diagn. Lab. Immunol.
2:233–235.
27. Wintrobe, M. M., and G. R. Lee.1999. Wintrobe’s clinical hematology, 10th ed. The Williams & Wilkins Co., Baltimore, Md.
28. Yachie, A., T. Miyawaki, T. Nagaoki, T. Yokoi, M. Mukai, N. Uwadana, and N. Taniguchi.1981. Regulation of B cell differentiation by T cell subsets defined with monoclonal OKT4 and OKT8 antibodies in human cord blood. J. Immunol.127:1314–1317.
29. Yanase, Y., T. Tango, K. Okumura, T. Tada, and T. Kawasaki.1986. Lym-phocyte subsets identified by monoclonal antibodies in healthy children. Pediatr. Res.20:1147–1151.