VIDWANS, SHIRIN ASHUTOSH. Application of Lean Six Sigma in Textile Yarn Dyeing (Under the direction of Dr. Warren Jasper).
Lean Six Sigma is a data driven methodology with the end goal of reducing defects and improving quality. Although originally designed for manufacturing, it is becoming more popular in other industries such as healthcare and textiles. This thesis demonstrates an application of Lean Six Sigma in textile yarn dyeing. The DMAIC methodology was used to achieve improvements in dyeing performance and machine utilization for a package dyeing company having low machine utilization rates. Machine utilization is the percent of time a dye run achieves an acceptable outcome.
by
Shirin Ashutosh Vidwans
A thesis submitted to the Graduate Faculty of North Carolina State University
in partial fulfillment of the requirements for the degree of
Master of Science
Textile Chemistry
Raleigh, North Carolina 2018
APPROVED BY:
_______________________________ _______________________________ Dr. Warren Jasper Dr. Peter Hauser
Committee chair
DEDICATION
BIOGRAPHY
Shirin Vidwans was born on 29th October 1994 in Virar, near Mumbai, in India. She completed her undergraduate degree (B.Tech) in Fibres and Textiles processing technology from the Institute of Chemical Technology, Mumbai, India in 2016. She came to USA to pursue Masters in Textile Chemistry at NC State University in fall 2016. She got an excellent opportunity to work under the guidance of Dr. Warren Jasper. After completion of her degree she wishes to gain experience in the textile field.
ACKNOWLEDGMENTS
TABLE OF CONTENTS
LIST OF TABLES ... vi
LIST OF FIGURES ... vii
Chapter 1: INTRODUCTION ... 1
Chapter 2: LITERATURE REVIEW ... 3
2.1. Introduction ... 3
2.2. History of Six Sigma ... 3
2.3. Variation ... 5
2.4. Six Sigma project team ... 7
2.5. DMAIC: Process improvement methodology ... 7
2.5.1. Define ... 9
2.5.2. Measure ... 10
2.5.3. Analyze ... 11
2.5.4. Improve ... 13
2.5.5. Control ... 14
2.6. Quality initiatives in textile industry ... 14
2.6.1. Lean Six Sigma in textile industry ... 15
2.7. Case studies of implementation of Lean Six Sigma in textile industry ... 16
2.7.1. Yarn packing industry ... 16
2.7.2. Garment industry ... 18
2.7.3. Dyeing industry ... 18
2.8. Yarn dyeing ... 21
2.8.2. Package dyeing ... 21
2.8.3. Package dyeing in detail ... 23
2.9. Right first time dyeing ... 24
Chapter 3: CASE STUDY ... 26
3.1. Define ... 26
3.1.1. Problem & mission statement ... 28
3.1.2. Project team ... 29
3.2. Measure ... 29
3.2.1. Process steps ... 30
3.2.2. Data collection ... 32
3.2.4. Important terms ... 32
3.2.3. Identification of inconsistent/incomplete data ... 33
3.2.5. Baseline calculation ... 35
3.2.6. Number of runs per batch ... 36
3.3. Revised define phase ... 37
3.4. Analyze ... 38
3.4.1. Trend in machine utilization ... 38
3.4.2. Trends in time of the year/ seasonal variation ... 40
3.4.3. Reason of failure ... 40
3.4.4. Colors dyed ... 41
3.4.5. Liquor ratio ... 45
3.4.5. Other analysis... 49
3.5.1. Color co-odinates ... 52
3.5.2. Liquor ratios ... 53
3.5.3. Number of runs per batch ... 55
Chapter 4: RESULTS AND DISCUSSION ... 56
Chapter 5: CONCLUSION ... 59
LIST OF TABLES
Table 1: Six Sigma team ... 8
Table 2:Tools used in DMAIC methodology ... 9
Table 3: Short listed colors ... 41
Table 4: Liquor ratios for reactive dyeing ... 44
Table 5: Liquor ratios for direct dyeing ... 45
LIST OF FIGURES
Figure 1: Hank dyeing ... 21
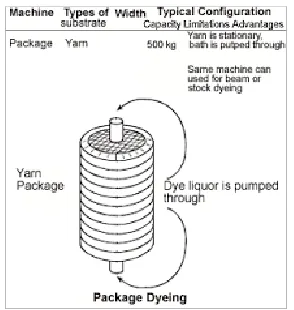
Figure 2: Package dyeing ... 22
Figure 3: Package while dyeing ... 23
Figure 4: Color matching schematic diagram ... 27
Figure 5: Process flow diagram ... 29
Figure 6: Machine utilization for each month... 37
Figure 7: Machine utilization 2014 ... 38
Figure 8: Machine utilization 2015 ... 38
Figure 9: Machine utilization 2016 ... 39
Figure 10: Pareto plot for reasons of re-dyeing ... 40
Figure 11: Structure of Ramazol BR Yellow 4GL ... 42
Figure 12: Structure of Reactive Green 6B ... 42
Figure 13: Structure of Copper complex of formazan ... 43
Figure 14: Liquor ratios ... 46
Figure 15: Trend between machine utilization and %error in liquor ratio ... 47
Figure 16: Month wise batch performance ... 48
Figure 17: Monthe wise run performance ... 49
Figure 18: Reprocessing rate according to dye type ... 50
Figure 19: Performance by procedure type ... 51
Figure 20: Ring (volume: 3L) ... 52
Figure 21: Small base (volume: 3.50L) & large base (volume: 4.5L) ... 53
CHAPTER 1: INTRODUCTION
The fundamental objective of the Six Sigma methodology is the implementation of a measurement-based strategy that focuses on process improvement and variation reduction through the application of Six Sigma improvement projects. This is accomplished using two Six Sigma sub-methodologies: DMAIC and DMADV. The Six Sigma DMAIC process (define, measure, analyze, improve, control) is an improvement system for existing processes falling below specification and looking for incremental improvement. The Six Sigma DMADV process (define, measure, analyze, design, verify) is an improvement system used to develop new processes or products at Six Sigma quality levels. It can also be employed if a current process requires more than just incremental improvement. Both Six Sigma processes are executed by Six Sigma Green Belts and Six Sigma Black Belts and are overseen by Six Sigma Master Black Belts.
Due to its complexity and importance in determining aesthetics, dyeing is the textile manufacturing step in which reworks are the most common. ‘Right first-time dyeing’ is a concept which aims to minimize the amount of rework by getting the shade right the first time. However, it is achieved only under favorable conditions. As extra expenses caused by re-dyeing can be eliminated, ‘Right first-time dyeing’ is sought by dyeing industries worldwide. This makes dyeing a potential process for the application of Lean Six Sigma.
There are very few examples in the literature of the application of Lean Six Sigma tools in the textile industry. As such, there is a huge potential for the application in the dyeing process. This thesis demonstrates the application of Lean Six Sigma in textile package dyeing.
The first section defines the problem, the scope and the goals of the project. The second section is the measure phase where we have identified important steps, collected the required data, and benchmarked the current performance by defining a performance metric called machine utilization. With the help of this information, we revised the problem and mission statement in the define phase. In the fourth section, we analyzed the data by using various tools to explore the underlying root causes of process inefficiency. Based on these findings, we suggested improvements to the yarn dyeing process in the final, fifth section.
In Chapter 4 (Results and Discussions), we discuss the improvements in the machine utilization rate at the end of the project.
CHAPTER 2: LITERATURE REVIEW 2.1. Introduction
Six Sigma is a well-accepted, structured, disciplined and data driven methodology for process improvement and quality control. It has gained popularity since the 1980s in many industries. In the early 2000s, Six Sigma was combined with the Lean principle to become Lean Six Sigma to achieve business and operational excellence.1 It is estimated that Lean Six Sigma has saved companies an estimated $427 billion and that Lean Six Sigma deployments contribute to 2% in sales per year. 2
Lean Six Sigma has shown a high level of growing acceptance in many business circles. Even though there are various critiques, there are no signs that Lean Six Sigma will cease to be important for process improvement in the near future. Lean Six Sigma simultaneously embraces its core principles and elements that have persisted since its inception at Motorola in late 1980s and is highly flexible in adapting to and integrating with alternative management philosophies, methodologies and ideas. This is the main reason behind the survival of Lean Six Sigma.3
The term “sigma” comes from the Greek letter σ which represents the standard deviation of a population in statistical mathematics. When a process is running at a 6σ level, it means that the process is six standard deviations away from process mean, in other words, only an average of 3.4 defects are produced per million opportunities2.
2.2. History of Six Sigma
In the 1950s, Dr. Genechi Taguchi popularized the concept of “design of experiments” in order to improve product quality. By the end of the 1950s, Drs. Edwards Deming, Joseph M. Juran, and Armand V. Feigenbaun had made significant contributions to the quality engineering field by developing the Total Quality Management (TQM) system.1
The Toyota Production System (TPS) provided the basis for what is now known as lean thinking, as popularized by Womack and Jones. The development of this approach was shortly after the Second World War, pioneered by Taiichi Ohno and associates, while employed by the Toyota motor company4. Forced by shortages in both capital and resources, Eiji Toyoda instructed his workers to eliminate all waste. Waste was defined as “anything other than the minimum amount of equipment, materials, parts, space and time which are essential to add value to the product”. Through this trial and error process, Ohno came up with a new manufacturing model– the Toyota Production System (TPS). The TPS became the dominant production model to emerge from several concepts around at the time. To remain competitive with Japanese industries, US and European companies started adopting the TPS under the title of just-in-time (JIT).
Motors, and many other companies initiated Six Sigma programs. Six Sigma is not restricted only to manufacturing and technology industries, and it soon spread to pharmaceuticals, financial institutes, toy makers, military, textiles and many other sectors.1 By the late 1990s, about two-thirds of the Fortune 500 companies had embraced the Six Sigma methodology to reduce cost and improve quality. 1
In the early 2000s, Six Sigma was combined with the lean principle to become Lean Six Sigma to achieve business and operational excellence. M. George is credited as the first person to propose the combination of Lean Six Sigma in his book ‘Lean Six Sigma: Combining Six Sigma Quality with Lean production speed. Lean Six Sigma is more effective than Lean or Six Sigma alone as it takes advantage of both: waste elimination & process acceleration in Lean and variation reduction in Six Sigma. Hence it has become a popular tool for improving business and operational excellence over the last decade.
It is essential that Lean Six Sigma should be understood as a philosophy as well as scientific approach and is more than just a statistical tool for reducing product variation. It is a process that can make a business more successful. Continuous improvement is a must in order to survive in today’s world. Therefore, many companies emphasize on training their employees in Lean Six Sigma.1
2.3. Variation
The term variation is used in three ways in the context of Six Sigma.
1. The natural variation, also known as common cause variation. This variation is difficult to get rid of. This usually can be approximated by a bell shaped normal distribution.
2. Special cause variation induced by special and assignable causes. These events are not common, often few in numbers, but large in contribution to total variation. Events such as machine malfunction, raw material from different supplier or non-standardized work procedures often result in special cause variation.
3. Defects, also known as ‘rework loops’. These occur when the final product does not meet the customer’s expectation.3
Variations in a set of data can be measured by levels of ‘sigma’. The Greek letter σ (sigma) represents the standard deviation of random variables. A Six Sigma process implies that the interval between the Upper Specification Limit (USL) and the Lower Specification Limit (LSL) contains the mean value ±6 × standard deviation of the random variable; therefore, the probability of having any defects is extremely small.1
The core idea behind Lean Six Sigma is to reduce the number of defective outputs of a process to a level of 3.4 defects per 1 million opportunities (DPMO).5 A Six Sigma capable process allows a 1.5 sigma shift. This shift indicates that over the long-term the process will show higher levels of variation than in the short-term and the 1.5 sigma shift takes these shifts in common cause variation into account.6
2.4. Six Sigma Project Team
According to one anecdote, Dr. Mikel Harry had a conversation with a plant manager in Utah who told him that “we’re kicking the heck out of variation” in production. A martial arts metaphor surfaced from their conversation, and then idea apparently caught on and was first published in 1995. As a result, Six Sigma experts have been categorized into layers and referred to as various color “belts”. 7
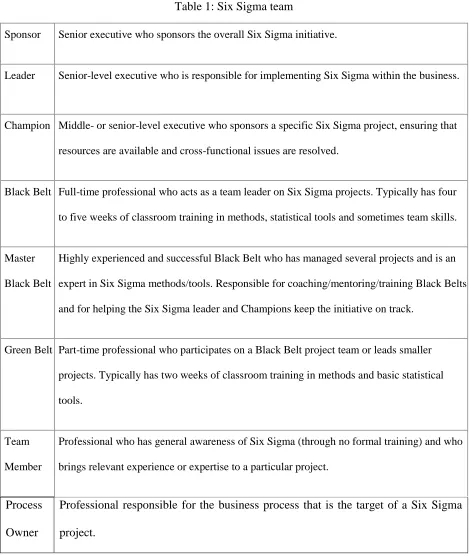
Table 1 illustrates the roles and responsibilities of a Six Sigma team. Leaders and Champions usually receive high-level training on the technical aspects of Six Sigma and specific training on how to lead an initiative. At the “Belt” level, each candidate is assigned an initial “training project” that he/she will work on during the formal training period. Candidates attend classroom training for a week, work on their projects for three weeks, return to class for another week, and so on until they have acquired all the skills appropriate to their role.
2.5. DMAIC: Process improvement methodology
Table 1: Six Sigma team
Sponsor Senior executive who sponsors the overall Six Sigma initiative.
Leader Senior-level executive who is responsible for implementing Six Sigma within the business.
Champion Middle- or senior-level executive who sponsors a specific Six Sigma project, ensuring that
resources are available and cross-functional issues are resolved.
Black Belt Full-time professional who acts as a team leader on Six Sigma projects. Typically has four
to five weeks of classroom training in methods, statistical tools and sometimes team skills.
Master
Black Belt
Highly experienced and successful Black Belt who has managed several projects and is an
expert in Six Sigma methods/tools. Responsible for coaching/mentoring/training Black Belts
and for helping the Six Sigma leader and Champions keep the initiative on track.
Green Belt Part-time professional who participates on a Black Belt project team or leads smaller
projects. Typically has two weeks of classroom training in methods and basic statistical
tools.
Team
Member
Professional who has general awareness of Six Sigma (through no formal training) and who
brings relevant experience or expertise to a particular project.
Process Owner
Professional responsible for the business process that is the target of a Six Sigma project.
2.5.1. Define
This is the first and most important phase of the process. The goals in the define phase are to provide a clear definition to the problem as well as describe the scope of the project such as the focus areas to be addressed as well as the constraints used to delimit the project. A Project charter which is a one-page summary of the project, is created in this phase. The sponsor or the manager of the project approves the project charter before the project starts.
The Suppliers-Inputs-Process-Outputs-Customers (SIPOC) analysis is conducted once the project is approved, to make sure that the project team fully understands the current process, who
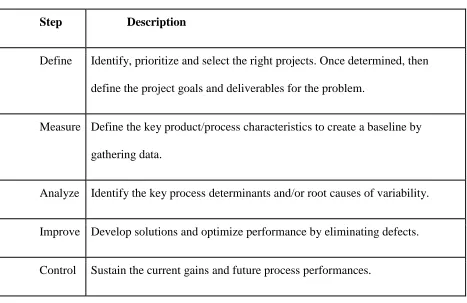
Table 2:Tools used in DMAIC methodology
Step Description
Define Identify, prioritize and select the right projects. Once determined, then define the project goals and deliverables for the problem.
Measure Define the key product/process characteristics to create a baseline by gathering data.
Analyze Identify the key process determinants and/or root causes of variability.
Improve Develop solutions and optimize performance by eliminating defects.
Control Sustain the current gains and future process performances.
understanding of what is critical to the success of the process. A detailed process map can be used to fully understand the entire process by identifying potential failures, data collection points, boundaries, etc.1.
The project charter should contain the following:6
• A problem statement.
• A clearly stated business case for the intended Six Sigma project.
• A well-defined project scope.
• Identification of project sponsor.
• A specific performance metric or metrics that can be used to evaluate the performance improvement before and after the project.
• Identification of the stakeholders, process owner, project team, and project champion.
• Resources required.
• Potential risks of the project not being able to achieve the intended result within the specified project duration.
2.5.2. Measure
A data collection plan is made, and a sampling method is determined. The data collection plan is critical as the data that is gathered must be reliable and accurate because they will be the foundation of the remainder of the project. Before measurements are taken, a measurement system analysis (MSA) may be necessary. The problem statement in the define phase may be needed to revise based on the analysis of the data.
Once the current performance levels are known, they will then be compared to the best performance possible without major investments. The best performance baseline can for example be a historical best performance, benchmarking with similar process or engineering maximum capacity calculations. When the current performance and ideal performance are known, the potential benefits for the project can be estimated more precisely.
Some of the tools used at measure phase:
• Process Analysis
• Failure Analysis
• Performance Baseline
• Capability Analysis
• Measurement System Analysis 2.5.3. Analyze
between the control (i.e., independent) and the response (i.e., dependent) variables are tried to be established. A great amount of the work done during this step is based on statistical analysis tools.
Some of the most commonly used tools in the analyze phase are:
• Hypothesis Testing
• Histogram
• Pareto chart
• Fishbone diagram (Cause and effect diagram)
• FMEA
• 5 whys
• Multi-Variable regression
• Cycle-Time Analysis
• Regression Analysis
• Analysis of Variance
Histograms are used to check the nature and distribution of the data while Pareto charts are used to identify the severity (i.e., frequency) of causing factors. Fish bone or Ishikawa diagrams are used to analyze the cause and effects of the variation in the response metrics. Failure mode effects analysis (FMEA) is used to identify the modes of failures and their effects. Each mode of failure is given severity level, probability of occurrence and risk level. These modes are often identified from the SIPOC or process maps from the define stage. The 5 whys are used to question why something is occurring to get to the root cause.
quantified. Sometimes the number of factors is really high and, in this situation, for example, a Pareto chart can be used to prioritize hypothesis testing.
2.5.4. Improve
In the Improve phase, potential solutions are developed based on the analysis conducted in the Analyze phase to reduce or eliminate the effects of the root causes. These solutions will be evaluated and then implemented. The root causes identified in the Analyze phase will be validated with data after the implementation of the improvement.
The common tools used in this step include FMEA, error proofing to reduce human error by automation, training or redesign of the process, design of experiments (DOE), brainstorming, and potentially simulation modeling. DOEs are used to evaluate the effect of controlled factors on a response variable which is under investigation by planning, conducting, analyzing and interpreting a set of controlled tests. Design of experiments can be performed by keeping all control variables constant except one whose effect on the response is measured by altering the levels of this factor. A factor at a time (OFAT) approach has been shown to not be very effective in comparison to some of the newer design methodologies since this method does not take account potential interactions among the independent variables. There are several DOE designs (i.e., full and fractional factorial, response surface, etc.) used to screen out factors of importance to determine a relationship among the dependent and independent variables. Multiple runs (i.e., replicates) may be necessary to determine which causes are the most important and the best values for these inputs.
performance. Therefore, a pilot trial is run once the solution to the problem are found to determine the true effect of the change.
2.5.5. Control
The last step of DMAIC is called control. The objective of this phase is to sustain the improvements yielded during the improvement stage through a control plan. The control plan uses statistical control charts for monitoring, training workers, and visual controls to determine a problem before it happens. Since Six Sigma is a continuous improvement effort, suggestions for a next-phase project can be made in this phase. It is also common to recommend replication of the process in other parts of the organization to multiply the effects of the improvement.
2.6. Quality initiatives in Textile industry
Seven percent of the total manufacturing jobs in United States are accounted from the fiber, textile and apparel industries. These industries, combined, employ 1.2 million people directly and support more than 2.4 million other jobs. This massive industrial complex is the largest contributor among basic manufacturing industries to the U.S. gross domestic product.
To cope with competition, many textile-related companies in the United States have implemented quality management initiatives to lower costs and improve both products and customer satisfaction. During the past ten years, textile-related industries have invested more than $2 billion annually in new technologies and equipment. This investment has driven remarkable productivity increases.
Manufacturers slowly began to add inspection and control to the quality of raw materials and the production processes.
Statistical process control was implemented in textiles in late 1940s by a yarn manufacturing company. Later, it was implemented by woven, knitted, nonwoven and dyeing and finishing companies. Evaluating the results of a dyeing is highly subjective and not easily automated and that is why very little statistical quality control has been applied in these industries. Intense competition has caused a new focus on quality management in textile companies. An influx of senior management from outside the industry has brought some new methods into the industry, but most initiatives have come from companies within the industry looking at all avenues of improvement.
Milliken & Co. is one of the pioneers in the adopting quality management programs. In 1981, the company's senior management launched its Pursuit of Excellence initiative, a commitment to customer satisfaction pervading all company levels and locations. By 1989 Milliken & Co. was ahead of its competition in all 15 measures of customer satisfaction and won the Baldrige Award. The company has been a leader in building measurement systems and making decisions based on facts. It has also realized that quality management extends to all work processes.8
2.6.1. Lean Six Sigma in textile industries
quickly followed and has made Six Sigma a key part of its management strategy. DuPont uses the program for its productivity and quality improvement strategies. It considers Six Sigma a business-management process that concentrates on eliminating defects from work processes. At one U.S. plant, one such project saved 50 billion BTUs by reducing the amount of purchased steam unnecessarily condensed and lost to drainage. At a DuPont site in the People's Republic of China, a project helped reduce electricity consumption and carbon dioxide emissions. DuPont estimates that one in every 10 employees will be involved in such projects in the near future. It expects the resulting enhancements will be major drivers of the company's growth efforts. Other textile companies, such as Burlington Industries, Unifi and PGI have also started Six Sigma initiatives. The leading textile companies will always continue to search for ideas and methods in quality management that create competitive advantage. Fast implementation of the right methods will make a significant and successful difference in many of these companies' futures. 9
2.7. Case studies of implementation of Six Sigma in textile industry
Even though Lean Six Sigma is gaining popularity among large textile companies, there are only a few examples of successful implementations of Lean Six Sigma projects in small to medium textile companies. This is partly due to resistance to change in the industry.
2.7.1. Yarn packing industry
2.7.2. Garment industry
Mukhopadhyay et al presented a case study done in an Indian garment factory primarily involved in the production of shirts. The key objectives of the project were minimizing the standard minute value of each operation of the process and improving profit by reducing defects and reworks. They constructed a process flow diagram and SIPOC table to understand the process and calculated standard minute value of each operation in the process and measured the capability of the process by performing a capability analysis. With the help of pareto charts they shortlisted eleven defects such as uncut threads, open seam, puckering, broken stitches etc. which were contributing towards most of the rework. Cause effect diagram showed the main causes for defects. Improvements for all the defects were made such as using thread trimmer for uncut threads and maintaining cleanliness at the workplace to avoid the oil marks etc. Percentage of defects dropped down to 3% from 5.66% by the end of the project.
2.7.3. Dyeing Industry
There are two case studies done in the dyeing industry. One is about a company producing terry towels and the other is about a piece dyeing company.
collection plan to collect the data on RFT% They measured the current performance of the company and came up with the define and mission statement. They calculated a baseline sigma and used MSA to carry out a gauge R & R study to test the accuracy of weighing and dispensing systems and pressure and temperature gauges. 10
In the analyze phase they used tools such as pareto charts, cause and effect diagram and 5-why analysis to identify the root causes. From these tools they identified that shade mismatch was the main difficulty which was preventing them from achieving the target performance and the current performance. They also did hypothesis testing by checking hypothesis such as the effect of yarn dye-ability, dye strength, residual peroxide, water quality (pH value) and whiteness or grey material on shade. In the improve part of the project they suggested various remedies such as updating SOPs, checking exhaustion graphs and dye view behavior before recipe generation, as well as chemicals and dyeing testing as a quality check. After the improve stage they did the cost benefit analysis to compare the cost incurred in the project and versus the benefits achieved.
During the control phase they developed a new SOPs for supporting Lab to achieve Bulk RFT, they started testing dye samples every time there was a change in the dye batch. Also, they started scheduling regular training to the workers for enhancing process knowledge and skill level of operators. At the end of the project the RFT% was improved by 4%.10
completion of the project. In the measure phase they developed a proper data collection plan for both historical and planned data, estimated the baseline process performance through the sigma level based on process yield and fixed the target sigma level and segregated the significant factors for next course of study through analysis and improvement phase. They collected data of machine used for dyeing, quality of the fabric, shade and length of the fabric for a lot of fabric for two months. Initial sigma level was 0.81 and target sigma level was set to 1.76. They came up with five shades which were responsible for 68% of the total defective lots using pareto graph. Out of these five they decided to study first three shades further. Similarly, two qualities of fabric and two dyeing machines were selected for further study. In the analyze phase attempts were made to identify the root causes. Fish-bone diagram was used to enumerate possible root causes. From the analyze phase they concluded a few things such as dye uptake is dependent upon lot of linen fabric. Cover factor and RFD value has no significant effect on dye uptake. They found that computerized recipe prediction is superior to manual recipe determination and there is a significant difference in both. They also found out that the temperature indicators for the two machines which were short-listed for further studies were not working properly. In improve phase they decided to use computers for most of the recipe prediction and incorporated most of the dyes in the computer system and some technical changes were done to their process such as not loading machines beyond their capacity checking parameters like temperature, pH hardness value of water regularly and checking padding pressure regularly and setting machine after running thick fabric. When performance was checked after the improve phase the sigma level was at 2.34 and they had annual savings of $29,000.11
2.8. Yarn dyeing
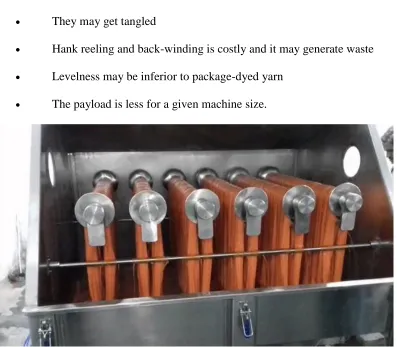
Hank dyeing and package dyeing methods can be summarized as follows: 2.8.1. Hank dyeing
• Hank dyed yarns have fuller bulk and hand.
• They may get tangled
• Hank reeling and back-winding is costly and it may generate waste
• Levelness may be inferior to package-dyed yarn
• The payload is less for a given machine size.
Figure 1: Hank dyeing
2.8.2. Package dyeing
• Leaner yarn, but the yarn gives better fabric definition
• Larger payloads for a machine of a given size
• Faster back-winding and less waste generation
• Saving in energy, water and space
Since the target company uses package yarn dyeing, this thesis concentrate more on package dyeing for this thesis. Package dyed objects can be used for a large range of end uses, some of the end uses are as follows:
• Texturized yarns for both weaving and knitting
• Sewing threads
• Singles yarn for use as such or to produce marl effects
• High-bulk acrylic yarns for machine
• Cotton yarns for weaving or machine knitting12
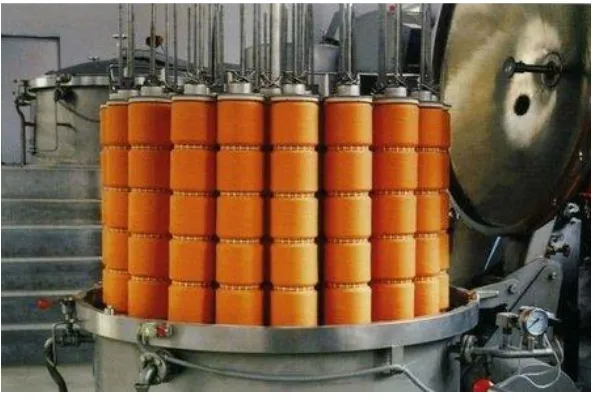
Figure 2: Package dyeing
2.8.3. Package dyeing in detail
high pressure, with the packages mounted on hollow spindles. These spindles are fixed on dyeing carriers, which are inserted into a dyeing vessel. Dye liquor is forced through the packages in two directions (inside out and outside in) and goes on circulating throughout the vessel and yarn. With the start of the dyeing cycle, the dye liquor goes on circulating throughout the vessel and tank. This happens until all the dye is used up or fully exhausted. Once full exhaustion occurs, the carrier of colored yarn is removed from the vessel. Finally, the yarn is dried using an infra-red drying oven.13
Figure 3: Package while dyeing
2.9. Right first-time dyeing
As dyeing and finishing of a textile is often the last step in the manufacturing of a fabric, it requires extra caution to get it right by avoiding waste and maintaining cost control. Only under favorable conditions is it possible to get a right first-time dyeing. Right first-time dyeing means every batch of colored material should be the correct color, without the need for adjustment during the dyeing process or as a corrective reprocessing procedure.
Generally, in the textile industry, a recipe is set according to the fabric, dyes, auxiliaries and shade for dyeing. If the dyed shade does not match to the desired shade, then a correction is made according to the mismatch of the color and another dyeing cycle is run.
CHAPTER 3: CASE STUDY – PROJECT EXECUTION
The purpose of this chapter is to demonstrate the application of Lean Six Sigma tools in the field of textile yarn dyeing. The theory behind the actions has already been presented in the previous chapter. This case study will follow the DMAIC methodology of Lean Six Sigma and highlight how each step of our project proceeded.
3.1. Define
Define is the first phase of DMAIC methodology. This part of the chapter has following goals:
- To define the main business problem
- To define the mission or the goal of the project
- To define the team
The project was launched with a kick-off meeting. The meeting took place at the office of the yarn dyeing plant, where all the team members were present. The team included the Corporate Process Improvement manager, Dyed Process Development and Quality Assurance manager and the Research and Development manager of the plant. The purpose of the kick-off meeting was to define the business problem and establish a mutual understanding of the project’s guidelines. The team took a tour of the dyeing facility to have a better understanding of the plant operations.
Both cotton yarns and synthetic yarns are dyed in the facility. Even though cotton dyeing only contributes to a small percentage of the total business for the company, it can potentially be a growth opportunity if the high percentage of reworks were reduced.
We observed the following things while taking the tour of the production house.
• The contracts for winding yarns on the spring used in yarn dyeing machines are given to another company.
• The yarn received from the winding company must be prepared for dyeing. The plant does all the chemical processing required for the yarn, which includes scouring, bleaching, dyeing, soaping and washing.
• The size of the machine used is determined by the order size.
• Bleaching is an optional process, which is dependent on the lightness and darkness of shade of the order.
• The cotton yarns are dyed with either fiber reactive or direct dyes.
• A color recipe consists of 3-5 dyes.
• The salt used for exhaustion for both direct and fiber reactive dyes is common salt (NaCl).
• While developing color in the lab, the salt is used as solid crystals and added into the dye bath by weighing the salt; -whereas, while dyeing in the production house at bulk scale the salt is used in the form of a saturated brine solution which comes from an external tank.
3.1.1. Problem and mission statement
After getting to know the process and the problem, the team came up with a preliminary problem and mission statement.
Problem statement:
A significant fraction of cotton yarn dyeing batches are being re-dyed. This results in excess use of water, energy and chemicals, which leads to higher expenses. The process also requires more time than would be ideal.
Mission statement:
Improve the machine utilization rate of cotton yarn dyeing resulting in a decreased amount of chemicals, water and energy and increasing the profitability.
We modified these problem and mission statements after the measure phase in which the baseline performance was measured, and performance numbers were added to the above problem and mission statement.
3.1.2. Project Team
After defining the problem and goals, we identified the key individuals for the project. The project team consisted of people working at the posts of corporate process improvement manager,
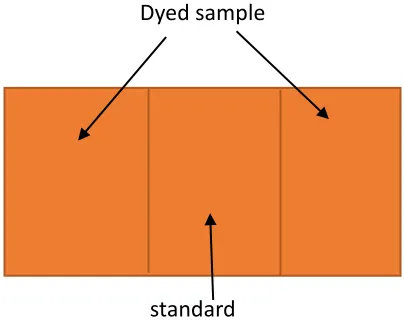
standard Dyed sample
dyed process development and quality assurance manager and R&D manager at the concerned company.
At the end of the Define phase, the team defined the problem, set goals, and eliminated non-critical business issues. This helped in making the scope of the project manageable and focused. The team members who were a part of the company had the most contribution in the define phase as they knew the process closely and were most aware of the problem.
3.2. Measure
Once the problem was identified, the project moved forward with the measure phase in which we identified all the related processes. After that, we evaluated the measurement systems to ensure the validity and accuracy of the data.
The data was provided by the company from their database in tabular form. Data consisted of batch runs, number of re-dyeings per batch, desired shade, and procedure. After the calculation of the baseline performance, we revised define phase. Performance values were incorporated in the problem statement and using the baseline performance measurements, goal performance values were set.
3.2.1. Process steps
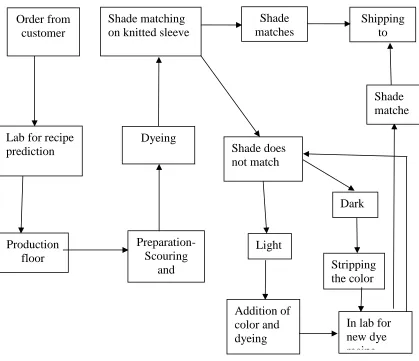
Figure 5: Process flow diagram
Color development and dyeing process- Customer places an order of a color. The ordered color is either from the company’s existing color library or it is a new color sample from the customer.
If the ordered color is from the color library, then the previously set recipe of dyes is retrieved from the system. If the color is a frequently dyed color, then the recipe is sent directly to the production floor and the order is dyed as per the set procedure. If the color is not a frequent color, then it is first dyed according to a recipe in the dye lab. Once the recipe is confirmed in the lab it is sent to the production floor to dye the order.
Light Order from customer Shipping to customer
Lab for recipe prediction Production floor Preparation-Scouring and bleaching Dyeing Shade matching on knitted sleeve
Shade matches Shade does not match Addition of color and dyeing Dark Stripping the color
In lab for new dye recipe
If the ordered color is not from the color library, then the sample provided by the customer is taken to the lab and is tested for its color components with the help of a spectrophotometer. According to the color components of the sample, a recipe made of a combination of dyes is predicted. The predicted recipe is first dyed in the lab and required corrections are made. The final recipe is sent to the production floor and the order is dyed.
Once the order is dyed, washed and dried, it is checked for its color components and visual appearance. To check if the color of dyed yarn matches with the standard, yarns from the dyed sample and standard sample are knitted in the form of sleeve for side by side comparisons. The company has standard yarn packages with the desired color. If the standard and the dyed order have color coordinates within the tolerance limit and they match visually, then the dyed order is packed and sent to the customer.
If the color of the order does not match, then it must be corrected. If the color is lighter than expected or has a different shade, then a recipe of dyes required to get the correct shade is predicted with the help of software and the order is dyed in the production floor. If the color is darker than expected, then it is first stripped using bleaching agents to a lighter shade, but the color is not completely removed.
A process flow diagram (Figure 5) was developed by the team after studying the process carefully.
3.2.2. Data Collection
The data used to determine the reprocessing rate included information on dyed batches from December 2013 until April 2017. The batch-specific data included a unique batch ticket number, number of runs required for every batch to get the correct shade, color name and color number, procedure codes, machine number, starting and ending date, type of dyes, color coordinates and reason for reprocessing.
3.2.3. Important terms
While working towards calculating the current performance we came across some terms which are defined as follows:
• Batch- A batch is an order sent by a customer. There is a specific amount of yarn associated with each batch which is dyed and delivered to the customer.
• Run- A run is a single machine dyeing cycle. A single batch consists of one or more runs.
If the color of a batch is not correct after the first run, then it has to be dyed again. Therefore, a batch can have multiple runs.
• % Re-processing - % re-processing is defined as the percentage of batches processed more than once i.e. %of batches which had more than one run.
% of reprocessed batches for entire data= (𝑁𝑜.𝑜𝑓 𝑟𝑒𝑝𝑟𝑜𝑐𝑒𝑠𝑠𝑒𝑑 𝑏𝑎𝑡𝑐ℎ𝑒𝑠
𝑇𝑜𝑡𝑎𝑙 𝑛𝑜.𝑜𝑓 𝑏𝑎𝑡𝑐ℎ𝑒𝑠 ) X 100
• Successful run- A successful run is the run which results in the correct shade and is accepted by the customer.
• % Machine utilization – percentage of use of machine which resulted in a successful run.
% Machine utilization = 1 – ( No.of failed runs
• Process sigma - The sigma level provides baseline metric to understand the capability of a process to meet the customer’s requirement. When calculating the sigma performance level, a common metric that is used is defects per million opportunities (DPMO).
• Calculation for the Sigma Level:
1. Determine the number of units produced.
2. Determine the number of defect opportunities per unit. 3. Count the number of defects.
4. Calculate DPMO using the formula.
DPMO = (No.of defects x 1,000,000)
(No of defectect opportunities per unit)x (No.of units)
3.2.4. Identification of inconsistent/incomplete data: Data Integrity
Not all the data provided by the company was consistent and complete. Error proofing is an important first step in insuring data integrity, or otherwise there is a high probability of drawing misleading or incorrect conclusions. Therefore, all the data was checked for its accuracy and reliability.
Color co-ordinates: The data was supposed to have had color co-ordinates corresponding to each dyeing batch and each dyeing run for batches with multiple runs. L*, a* and b* values of the standard sample (expected value) and of the dyed sample (actual value) and ΔE i.e. color difference between standard and sample were provided. However, for many batches, the color co-ordinates were provided for only some of the runs, making the dataset incomplete.
(CMC ΔE) is less than 1.0. In the given data, there were some batches having ΔE values as low as 0.14 that were still reprocessed and some batches having color coordinates outside the general tolerance limits that were not reprocessed. Some batches had a color difference as large as 3.4 that were only dyed once. Also, if any batch was dyed multiple times, there was only one set of color co-ordinate values given in the data. After discussing this issue with the team members, we came to understand that if a dyed sample was not a visual match, then the company did not measure or record the color co-ordinates and directly sent the batch for stripping and rework. There were no records of the color co-ordinates for all the runs of a batch that were dyed multiple times. This makes the data of color co-ordinates unreliable.
Processing time: We were given the start date and end date of each batch. From the discussion with the team, we realized that some end dates corresponded to the date on which the last procedure took place (for a given batch) while other dates corresponded to the time the batch was shipped to the customer. Therefore, the data regarding dates of the batches were inconsistent and unreliable for measuring the time required for a batch to complete its procedure and we decided not to consider the processing time as a metric of performance.
After going through the data, we concluded that the data, other than the color co-ordinates and time required for a batch to process, was of good quality and valid.
3.2.5. Calculation for baseline performance % Re-processing:
Total number of batches = 2232 Number of batches reprocessed = 375
% of reprocessed batches for entire data= 𝑁𝑜.𝑜𝑓 𝑟𝑒𝑝𝑟𝑜𝑐𝑒𝑠𝑠𝑒𝑑 𝑏𝑎𝑡𝑐ℎ𝑒𝑠
𝑇𝑜𝑡𝑎𝑙 𝑛𝑜.𝑜𝑓 𝑏𝑎𝑡𝑐ℎ𝑒𝑠 = 375
2232 𝑋 100 = 16.80%
From the above calculation we see that 16.80% of batches were reprocessed. % Machine utilization:
To calculate % Machine utilization: Total number of runs = 3255 No of failed runs = 1023
% runs failed = 𝑁𝑜.𝑜𝑓 𝑓𝑎𝑖𝑙𝑒𝑑 𝑟𝑢𝑛𝑠
𝑇𝑜𝑡𝑎𝑙 𝑛𝑜.𝑜𝑓 𝑟𝑢𝑛𝑠 = 1023
3255 𝑋 100 = 31.42 %
% Machine utilization = 1 - 𝑁𝑜.𝑜𝑓 𝑓𝑎𝑖𝑙𝑒𝑑 𝑟𝑢𝑛𝑠
𝑇𝑜𝑡𝑎𝑙 𝑛𝑜.𝑜𝑓 𝑟𝑢𝑛𝑠 = 68.57 %
Process sigma level
• No of opportunities = 3255
• No of defects = 1023
• DPMO (Defects per million opportunities) = 314286
• % Defects = 31.43 %
• % Yield= 68.57%
3.2.6. Number of runs per batch
As we can see in the measure phase, 16.80% of the total batches are reprocessed which contribute towards 31% of the failed runs. This is because each failed batch is reprocessed more than once until the shade is right. There are some batches which have as many as 20 runs. If a batch failed once, it is hard to get the shade right the second time. The average number of runs for each batch which did not get the shade right the first time is 3.7. Only 85 batches out of 2232 had 5 or more runs but they contributed towards more than 550 failed runs.
3.3. Revised define phase:
After the Measure phase, the define phase was revised with the numbers related to the performance. Following are the problem and mission statements as revised with the help of data from the current performance.
Problem Statement-
The company has a 69% dyeing machine utilization rate and 16.80 % of the cotton batches (orders) are getting re-dyed from December 2013 till April 2017 resulting in the loss of 9.072 lbs of water per pound of yarn, and 0.0891kWh of energy per pound of yarn.
Mission Statement
Improve the machine utilization rate of cotton yarn to 93% in next six months resulting in savings of water, energy and chemicals.
3.4. Analyze
After identifying the important steps of the process, learning the baseline performance and setting up the goals for future in the measure phase, we moved forward with the analyze phase. The next step, using performance data was to identify gaps between the desired performance and current performance and understand the reason behind these gaps. We first analyzed the reasons behind the low machine utilization rates. We gathered more data about them and tried to find out the root cause behind the problem. We analyzed the other parts of the data to eliminate any other potential root causes.
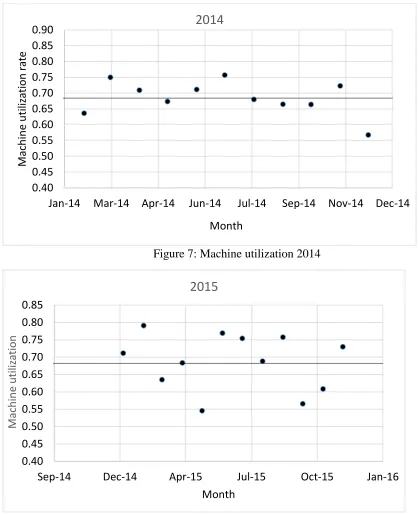
3.4.1. Trend in machine utilization
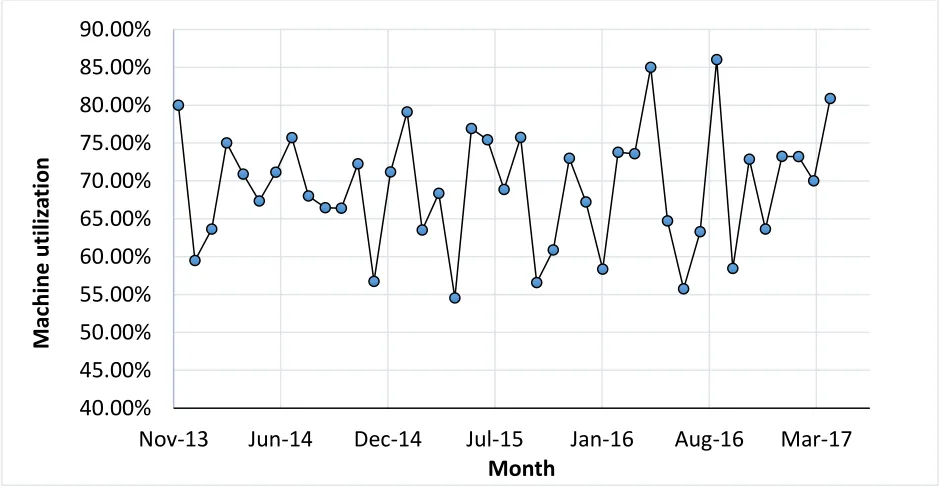
We calculated machine utilization for each month from December 2013 till April 2017 and looked for identifying trends if any. Figure 6 is the graphical representation of machine utilization for each month.
Figure 6: Machine utilization for each month
40.00% 45.00% 50.00% 55.00% 60.00% 65.00% 70.00% 75.00% 80.00% 85.00% 90.00%
Nov-13 Jun-14 Dec-14 Jul-15 Jan-16 Aug-16 Mar-17
From Figure 6 we can see that there is no apparent trend in machine utilization values and they are randomly distributed. The average of machine utilization is 0.69 with the median of 0.70
Figure 7: Machine utilization 2014
Figure 8: Machine utilization 2015
0.40 0.45 0.50 0.55 0.60 0.65 0.70 0.75 0.80 0.85 0.90
Jan-14 Mar-14 Apr-14 Jun-14 Jul-14 Sep-14 Nov-14 Dec-14
M achin e u tiliz at ion r at e Month
2014
0.40 0.45 0.50 0.55 0.60 0.65 0.70 0.75 0.80 0.85Sep-14 Dec-14 Apr-15 Jul-15 Oct-15 Jan-16
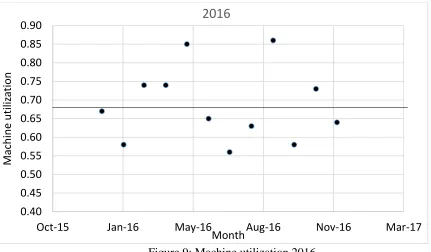
Figure 9: Machine utilization 2016 3.4.2. Trends in time of the year/ seasonal variation
We also explored whether there was any trend according to specific time of the year. From Figures 7-9, we can see that there is no apparent trend in machine utilization specific to any season or time of the year. Performance for each year was statistically the same. We used ANOVA to check if the average machine utilization was same over the course of the first three years. After checking the assumptions, we used ANOVA in JMP- statistical software.
The p-value turns out to be 0.94, so we fail to reject the null hypothesis of equal means. Therefore, we can say that there was no statistically significant difference in the machine utilization for first three years.
3.4.3. Finding root causes for redyeings
For each dyed batch, one of three reasons were given for reprocessing the dyed yarn: shade, depth and unlevelness. A pareto chart in the Figure 7 shows that shade is the most common reason for reprocessing, depth is second and unlevelness is last.
0.40 0.45 0.50 0.55 0.60 0.65 0.70 0.75 0.80 0.85 0.90
Oct-15 Jan-16 May-16 Aug-16 Nov-16 Mar-17
Figure 10: Pareto plot for reasons of re-dyeing
After knowing that shade was the main reason for reprocessing a batch, we analyzed the colors that were being dyed and shortlisted some colors which contributed towards most of the failed runs.
3.4.4. Colors dyed
Next, we determined if certain colors or shades were more problematic than others. From a total of 421 different shades, 244 were never re-dyed. Therefore, around 58% of colors hit the shade correct the first time.
Table 3 : Short listed colors
Color
No. of rework batches
Total no. of
bathes No. of failed runs
Beige 1 12 12 61
Khaki 1
6 21 43
Teal 5 9 30
Khaki 2
7 31 26
Blue 1 6 14 22
Blueish-green 4 18 18
Charcoal 2 16 18
Navy blue 6 18 18
Beige 2 6 15 18
Beet red 4 6 17
Each color was made up of a dye recipe containing 3 to 5 dyes. While knowing the L*a*b* color co-ordinates of each run could be important information, as mentioned earlier in the measure phase, we observed that some of the data was missing and the remaining data was not reliable. Therefore, the available data were not used for further analysis of find out trends in off shades and tracing down dyes which are the root causes of errors in shade.
Dye recipes:
Dye recipe composition: 1. Remazol BR Yellow 4GL
Figure 11: Structure of Ramazol BR Yellow 4GL
2. Reactive Green 6B
Figure 12: Structure of Reactive Green 6B 3. Remazol BR Blue BB
formazan and the word Ramazol in the name suggests that reactive group in this dye is a vinyl sulfone. Figure 9 shows the structure of copper complex of formazan.
Figure 13: Structure of Copper complex of formazan
From the structures we can see that the yellow dye has a vinyl sulfone-monochlorotriazine reactive groups which dyes cotton at 60oC whereas the green dye has dicholorotriazine as a reactive group which dyes cotton at 40oC. Dyes of different classes do not react in the same manner, therefore reactive dyes used for a ternary should all exhaust and react with the fiber at about the same rate and dyes with different ranges with different reactive groups should not be used together because of their different character and reactive group.17
Use of dyes with different reactive groups and fixation temperature makes the repeatability of the shade difficult and can be a potential root cause for the errors in shade.
3.4.5. Liquor ratio
The Liquor ratio is defined as the ratio of weight of substrate (cotton yarn in this case study) to the weight of dye liquor.
dyeing with direct dyes, 7 packages are loaded on each spindle. Even though number of packages are different while dyeing with different dyes, the amount of liquor was the same for both types of dyes. This suggested that there would be a difference in the liquor ratios between direct dyeing and reactive dyeing while dyeing in the production. We decided to measure the liquor ratios for lab and production for each machine type.
Table 4: Liquor ratios for reactive dyeing Machine type Dyeing volume
(liters)
Number of packages
Average batch weight (KG)
Liquor ratio
1 475.5 32 44.48 10.69
2 792.5 48 66.72 11.88
3 1,109.5 64 88.96 12.47
4 2,060.0 128 177.92 11.58
5 4,136.6 272 378.08 10.94
Table 5. Liquor ratios for direct dyeing Machine type Dyeing volume
(liters)
Number of packages
Average batch weight (KG)
Liquor ratio
1 475.5 28 38.92 12.22
2 792.5 42 58.38 13.58
3 1,109.5 56 77.84 14.25
4 2,060.0 112 155.68 13.23
5 4,136.6 238 330.82 12.46
6 6,181.6 322 447.58 13.81
Liquor ratio in lab:
Figure14: Liquor ratios
From Table 4 &5 and Figure 14 it can be seen that the liquor ratios are different for different machines and there is a difference in the liquor ratios between lab and production for both reactive and direct dyeing. The liquor ratio plays an important role in the depth of shade and possible hue angle. We concluded that the difference between the lab and the production liquor ratios could be a potential root cause of errors in shade.
Correlation between machine utilization of each machine and %error in the liquor ratio Machine utilization and %error in the liquor ratios between lab and production for each machine type was calculated. We observed a trend between the machine utilization and % error in the liquor ratio. To confirm the trend, we did correlation analysis with the help of JMP.
8 9 10 11 12 13 14 15
G3 G26 G13 G5 G39 G7
Liquor ratios for each machine type
Direct liquor ratio Reactive liquor ratio Lab liquor ratio
Figure 15: Trend between machine utilization and %error in liquor ratio
After the analysis it was seen that correlation coefficient was -0.93 and decision point for the sample size was 0.87 which meant that there was a strong correlation between %error in liquor ratio and machine utilization for each machine. The negative sign suggests as the %error increases machine utilization decreases.
0.5 0.55 0.6 0.65 0.7 0.75 0.8 0.85 0.9
11 13 15 17 19 21 23 25
M A C H INE UTILI ZA TION F OR E A C H M A C H INE
% ERROR IN LIQUOR RATIO
Machine utilization vs %Error in liquor ratio
3.4.6. Other analyses
Number of batches and runs
We can see in the following figure the month wise number of batches dyed and number of batches reprocessed.
Figure 16: Month wise batch performance 0
20 40 60 80 100 120
monthwise reprocessing performance
The following figure shows the passed and failed runs according to each month.
Figure 17: Month wise run performance
From the above bar graphs, we can see that there is no apparent trend in the number of failed batches or runs over the course of 3.5 years. However, there are comparatively fewer batches dyed in the past year than in the first two years. In the first two years the company dyed an average of 56 batches per month whereas in the past year average number of monthly batches dyed dropped down to 47. There were fewer batches dyed, hence fewer runs. However, machine utilization has showed no significant difference.
Dye type
Figure 16 shows that approximately 47% of the batches are dyed with direct dyes and 53% of batches are dyed with fiber reactive dyes.
0 20 40 60 80 100 120 140 160 180
Failed and passed runs
Table 6: Batch wise performance for each dye type
Dye type No. of batches dyed No. of batches reprocessed % Failure
Direct 850 173 20.35%
Reactive 945 201 21.26%
Figure 18: Reprocessing rate according to dye type
From the above table and bar graph showing the percentage of reprocessed batches we can clearly see that there is no significant difference. Therefore, it was concluded that dye type is not one of the root causes of errors in shade.
Pre-bleach
There were total 24 different types of procedures for cotton yarn dyeing. They differed in the dye types, pretreatments, post treatments and auxiliaries used as per the different needs. Out
0 200 400 600 800 1000 1200 1400
Direct Reactive
Reprocessing rate according to dye type
of 22 different procedures 11 involved prebleach as a part of the process. Out of 2232 total batches 1830 batches i.e. 82% of the total batches used the procedure which involved prebleach.
Out of all prebleached batches, 19.56% of the batches werevreprocessed and out of all non-prebleached batches, 15.64% of the batches were reprocessed.
Figure 19: Performance by procedure type
From the reprocessing numbers, we concluded that pre-bleach or non-prebleach is not one of the root causes of errors in shade.
3.5. Improve
After analyzing the data and discovering some potential root causes for the low machine utilization rates, we moved into the improve phase.
3.5.1. Color co-ordinates:
Recording correct color co-ordinates for every run: Color co-ordinates play an important role in the dyeing and color matching process. If the color co-ordinates are accurate then we can determine if there are trends in the off shades, find out if any dye is causing problems and discover root cause. Therefore, we suggested the company to measure the color co-ordinates for all the batches as one of the improvements.
0 200 400 600 800 1000 1200 1400 1600 1800 2000
Non prebleach Prebleach
Performance by procedure type
Also, if a batch is dyed multiple times, the company does not measure color coordinates at all if a dyed batch does not visually match the standard. If color coordinates are measured after every run for every batch dyed multiple times it will be easier to figure out what went wrong with each unsuccessful run and we will be able to determine the trend in the mistakes. Once the trend is figured out, improvements can be suggested, and mistakes can be avoided. Hence, we suggested measuring the color coordinates after every run. Even though it is time consuming, it will help set up a data base and will be helpful in the long run.
3.5.2. Liquor ratios:
As stated in the analyze phase, there was a significant difference in the liquor ratios between lab and production. Liquor ratios should be matched to have lab-to-production reproducibility. We suggested consistent liquor ratios between lab and production as a part of the improve phase.
It was easier to alter the liquor ratios in the lab than in production, therefore team decided to change the liquor ratios in the lab to match with the average of existing liquor ratios in the production. Ring, small base and large base (Figure 20 and 21) are used in the lab to alter the volume of the dye bath in the lab.
Figure 21: Small base (volume: 3.50L) & large base (volume: 4.5L)
The original set-up in the lab was ring and small base. After calculating liquor ratios for different combinations of ring and bases, the team decided to use only large base while dyeing with direct dyes and ring and small base while dyeing with reactive dyes.
Following is the calculation for the liquor ratio for different combination. Original volume of lab machine = 22.54 L
Lab set up: Ring + Large base
Effective volume = (22.54 – 7.5) = 15.04 L Avg. weight of package = 1.39 KG
Liquor ratio = 10.82 Direct dyeing:
Average liquor ratio in production = 13.25 Volume of Large base = 4.5L
Liquor volume with large base = 18.04L Liquor ratio = 12.97
Reactive dyeing:
Volume of Small base + Ring = 6.5L Liquor volume with large base = 16.04L Liquor ratio = 11.53
3.5.3. Number of runs per batch:
As we saw in the analyze part, if we get the shade wrong the first time it becomes difficult to get the shade right the second time. The probability of getting the shade right gets smaller as the number of runs per batch increases. Also, every failed run results in the wastage of water, electricity and time, eventually costing money.
CHAPTER 4: RESULTS AND DISCUSSION
This thesis presents an application of Lean Six Sigma methodology in the field of textile yarn dyeing. Lean Six Sigma tools are usually used in the manufacturing sector and there are very few examples of its application in the textile dyeing industry. This thesis uses DMAIC methodology to go about the project.
At the end of the project, i.e. after seven months, the performance of cotton yarn dyeing was evaluated both in terms of % right first-time dyeing and machine utilization for every month.
Figure 22: Overall machine utilization 40.00%
50.00% 60.00% 70.00% 80.00% 90.00% 100.00%
Oct-13 Apr-14 Nov-14 May-15 Dec-15 Jun-16 Jan-17 Aug-17 Feb-18
Machine Utilization
0.69
Figure 23: Overall % right first-time dyeing
JMP (Statistical software) was used to perform t-test analysis to find out if there is a significant difference in the performance before and after the beginning of the project. We concluded after t-test analysis that the difference in the performance before and after the beginning of the project is statistically significant and both the average percent right first-time dyeing, and the machine utilization values are higher after the project began.
Average machine utilization went up from 0.69 to 0.88, as shown in Figure 1 which illustrates machine utilization for each month. Figure 2 is the graphical representation of monthwise percent right first-time dyeing and we can see that average percent right first-time dyeing increased from 0.83 to 0.88. The average number of runs for each non- right first-time dyeing batch decreased from 3.7 to 3.3. Process sigma improved from 1.98 to 2.67.
We know from the analyze phase in Chapter 3 that, shade and depth are two major reasons behind reprocessing. Due to missing and unreliable data it was not possible to analyze the color
60.00% 65.00% 70.00% 75.00% 80.00% 85.00% 90.00% 95.00% 100.00%
Oct-13 Apr-14 Nov-14 May-15 Dec-15 Jun-16 Jan-17 Aug-17 Feb-18
%Right First Time dyeing
0.83
data. However, difference in the liquor ratios between lab and production was discovered which could be a potential root cause behind the low machine utilization values.
The improvements in the calculations in the liquor ratios were suggested and implemented. We can say that the improvement of 19% in machine utilization can be explained by the improvement implemented in the liquor ratio correction. It is anticipated that improvement in the shade performance could also be explained by the liquor ratio adjustments.
CHAPTER 5: CONCLUSION AND FUTURE WORK
The goal of this research was to improve the target company’s machine utilization rate for dyeing cotton yarns. This was done by using DMAIC – a Lean Six Sigma process improvement methodology. At the end of the project, we observed that there was a 19% improvement in the machine utilization rate.
In the define phase of the DMAIC methodology, the team defined the problem of a high number of reprocessing batches resulting in low machine utilization rates. The average machine utilization rate was 0.69 prior to starting the project with the goal of having the machine utilization rate increased to 0.93. The performance metric of machine utilization was defined and determined from the data provided. Using pareto plots, potential root causes for low machine utilization rate were determined to be shade and depth mismatch. Although color co-ordinate data is very important to measure the shade difference, the data was missing for many batches. This restricted us from further analyzing the problem and suggesting improvements. From the existing data, we realized that the liquor ratios were different in the lab and production. Also, we observed that in some of the colors dyed with reactive dyes the recipe consisted of dyes fixing at different temperatures which could potentially cause different exhaustion rates.
Improvements were suggested based on this analysis. The major improvements we suggested were to keep a record of color co-ordinates for all the runs of each batch and make the corrections in the calculations for the liquor ratio while scaling up from lab to production. We also suggested using dyes fixing at the same temperature instead of mixing dyes fixing at different temperatures.
The improvements in the performance were achieved without making any radical changes in the process that required major expense.
As Lean Six Sigma is a continuous improvement methodology, the current project has potential to evolve into various future studies.
The last phase of DMAIC methodology i.e. control phase can be implemented by regularly calculating the performance and checking all the important parameters of the process.
As a part of a future project, a study of color co-ordinates of failed runs can be done to identify trends in the mismatch of the shade. Certain dyes may be traced down that are responsible for the mismatch. Such problematic dyes and can be exchanged with better dyes, thus solving the problem.
A study of exhaustion of dyes in the different liquor ratios can be done by designing the suitable experiment to confirm the dependence of shade on the liquor ratio.