DEVELOP
ING
3D GEOSPATIAL DATABASE FROM
TERRESTRIAL LASER SCANNED DATA
A
li as
A
bd ul
R
ahm an'
,
and
G
urcan Buyuk
sa
l
ih
'
"Department of Geoi
nformati
cs,
Facul
ty
of Geoinformatio
n
Scien ce
and Engineenng
,
Unive
rsiti Teknologi Mala
ysia.
813
10
UTM Skuda
i,
Johor
,
Malaysia
alias
@utm
.my
'
Istanbul
Greater Municipa lity
(IBB,
BIMTAS
),
Tophanelioglu
ca
d.
ISKI
Binasi,
No.
62
,
K:3-4,
Altu
nizade,
Istanbul,
Tur key
gbu
yuksalih@ yah oo.com
A
BSTRACT
Most major cities are being managed spatially by 20 geo-DB MS, however, unlike Istanbul city it is in the verge of 3D spat ial infor mation system espec ially for the historical peninsular region. Thousands of its 3D objects (mainly build ings - old and new) are in the process of 3D database development Istanbul city municipal ity iscurrentlybusy with variousGISprojects incl uding an initiative toward s a 3D databa se for the city. This paper describ es the development of 3D dat abase from terrestrial laser scanned data where a leading geo-D AMS, i.e. Oracle Spa tial 109 were utilised . Useful 3D geoinformat ion could be genera ted from such 3D database, thus the initiative would pro vide an excellent tool forthecity 's decisio n making process
e.g.
for thecityplanni ng purposes.and etc.The 3D gee-database approach described III this paper is certainly would be very benefici al10 the city and other GIS users since the current and commercial GIS softwa re face some difficu lties in providing suchGIS operations and information to the relevant authorities. The paper also highlight s new 3D spatial operation s developed for possib le spatial analysis of 3D object s (surface and under ground objects).1.
INTRODUCTION
Three -dimen siona l (3D) spatial database will become one of the important components in any near future spatial informationsystems.The trend shows that more and more GIS users wo uld like to inco rpor ate 3D spat ial objects in such syste ms. thus the more realistic
spatial database is ine vitabl e. The pro blem is that current databases are still 20 in nature and very cumbersome for the 3D objects and still many issues need to be add ressed before we could really be able to manipulate realworld 3D objects as mostusers would like to have (Abd ul-Rahma n cr al. 2006). The same sentiment on 3D geo-DB MS was also repo rted by Arens
a
al (200 5) where the unavailability of 3D primitives in the existing geo-D BMS is the main dra wback. This scenario motivates us to do some inves tigat ion works especially by make use of the available 3D data set s. e.g, buildings and other type of objec ts forthe 3Dgeo-DBMS ope rationsand ana lysis. Therefo re. theaimofthispaperis to review fewrecent research works especially 011 3D spatial data modcling and describes our recent work on the manage ment of 3D laser scannerdata using geo -DBMS. In this paper. 3D data acq uiredfrom new acquisi tiontechnology. i.e. terrestrial laser scanned datasets will be investigated and experimented for the development of 3D spatial database. Initial resu lts have been presented recen tly. see Abdul-Rahmana a/( 2008).ho we ver.more testsare needed to be carried OUI for a better understand ing of thepro blem.Section 2.0describesthe study area. the terrestrial laser scanning data acquisiuo n in Sec tion 3.0 3D spatial database de vel opment descr iption is discussed in Sec tion 4 and visualizatio n of retrieved 3D objects in Section S. and finall y the conclusion in Secti on 6 with someissuesthat still need tobeloo ked further.
2
.
0
STUDY
AREA
Suley maniye. Istanbul,Turkey is the study area .It is a place of histori ca l objects and monument s. which
-contains approximately48,00 0 bu ild ings, andanareaof
1500 hect are. In this area , we assume the following scenario: the user has 3D data organized only in a database (aquite co mmon case for realworlddata), i.e. no file with gra phical informat ion (e.g. OG :\) exists. We have expe rime nted with a set ofbuildi ngs from the Suleyma niye area. Planar rectangular faces constitute
each bui lding. The dat a are built in CAD and furth er converted to thc geometry representation of Oracle Spatial 10g_ The conve rsion is completed with a topology-geometry of the 20 and 3D spatial object.
Since the Oracle Spatia l 109 geometry does not maintain a true 3D object. we represented every
building as a set of faces (walls, tl at roofs and foundati on s). The faces arestored as polygons with 3D
coo rdinates. In this expe rimen t table, namely LOT sto red 20 object. table 13UILDING represe nt3Dobject
stored face-by-face and table BODY_BUILDf NG
sto red the whole3D object as one object.
Figure I The Ista nbulpeninsula historical
area
3.0 TERRESTRIAL LASER SCANNING
3.1 Dataacquis it ion
The 3D datascts were captured via Terre strial Laser
Scanning (TLS) syst em. Leic a LS4 500 (static and
mobile). Initially. static system was used 'but then 0 more rob us t and quickersystem was uti lised.i.e.mobile
laser scanning (\113 L) system - due to project time constra ined. TheM13 Lconsists oflaserunit, I\1U, and
GPS and mounte d on a vehicle. Huge amountof data
werecapture d, it is the order of more than 50 Terra-byre
and the data managem ent system has been properly esta blished by the laser-scanning unit at 1\ol P (Ista nbul
Metro politan Planning)and 131'vlTAS offices.
For this proj ecta new productionorganisat ion was built
up at BL\1TAS using modern 3D mapping and
computer technology. The terre strial loser scanning
group includes 24 staff. which uses the following
technical equipme nt for data acq uisition: five l.c ica
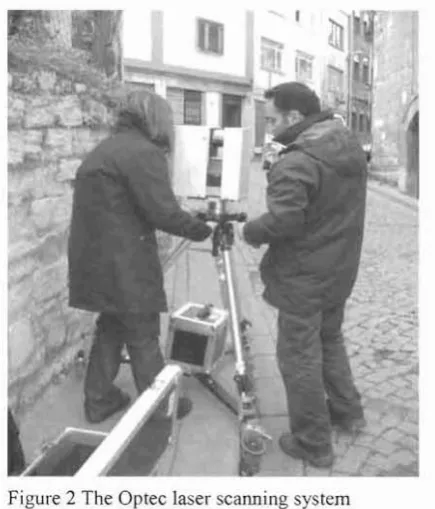
scan ne rs (four HDS4500 and one HDS3000), to ur ILRIS-3D scanners from Oprech (Figure 2), lo ur
Top con total stations tor geode tic contro l point
measurements and pre-ca librated SLR cameras Nikon 070 with I4mm and 28m m lens es for digital
photo gramme tric documentation. The technical
specifi cation of the terre str ia l laser scanning systems used for thisprojectarcsummarised in Table I.
Figure2TheOptec laserscann ingsystem
The threescanne r types use two different princ iples of
distan ce measuremen t: LcicaHDS4500 usesphase shi ft method ,while Leica HDS300 0 and ILRIS-3Dscan with the time-of-flight method. In general it can be stated that phase shift method is fast but the signa l to noise
ratiodepends on distanc e range and lighting cond itions.
If one compares scan distance and scanning spee d
shown in Table 1,it is obvious, that the sca nner using
the time-of-flig ht meth od can mea sure longerdistan ces
bUI is relative ly slow compared to the phase shift
scanner.
Thc IIDS4 500 measures distances up to 53m, whileIhe
HDS3000 and the ILRIS can measure up to 100m and
1500 m, respecti vel y. Due to the lim ited speed of 1500 or 4000 pointspersecondand due to the limitedfieldof view it quickly became clear that the ILRIS scanners
and the HDS 3000 arc not usefu l for the busy and
narro w streets of the proj ect area. These scanners arc
more suitable for thedocumen tati onoflandmarks.Thus. all bui ldings were scanned with a scan resolution of -LSmrn at the object usin g four IIOS4 500. for data
the scans from differen t scan stations as illustra ted in
Figure 3 (right). The targets have black- whi te quarters
ofacircle with adiameterof I26mm. To obtain centre
positions of the targets, the targets were automatically
fitted in the point cloud after manual pre-positioning
usingalgorithms oftheLcicaCyclonesoftwa re.
3.2 Staticterrestrial las er scanning
The data acq uisitio n by static terrestrial laser scanning started in September 2006. During applic at ion in the
Historic Peninsula stree ts it Turned out that only the
HDS4500 were ableto scaninthisspecial environment.
As mentioned before the ILRIS-3D and HDSJ OOO
scann er could not scaneffic ient ly III the narrow stree ts
dueto the limitation inthe field of view, distancesthat
were too sho rt and insuffici ent scanni ng speed. Furthermore, the registration of the po int clouds of the
ILRIS~3D ca used prob lems with tilted scans from the
same scan stations, and requir ed match ing with the Itera tive Close st Point (ICP) algo rithm and needed
initial values for its computa tion. Consequ ent ly, the
dail y laser scanning was carried out with four. or
somet imes with three, HDS4500. Figure 4 shows an
examp le ofa colo ured point cloud ofbuild ing facades
at theHistoricPeninsula.
,
.
•
•
-Figure 3 Exampleofacoloured pointcloudof buildingfacades at the HistoricPen insula
Ingeneral.asatisfying spatia l (geometrical) distributio n of the targets on the object or around the obj ect was guarantee d for the requi red descr iption of the detailed
object. The coordinates ofall targets were determined
by geodetic met hods using total stations. The target
-based reg istration and gee-referencing of the point clouds, which are acquired by the HDS4500 scanners, worked without any problem s using five Cyclon e so ftware co mpo nen ts asfollowing : (a ) regi strationofall
scans and quality co ntrol of the resul t (check of residuals) , and (b) gee -re ferencing usi ng all control
points inclu d ing quali tycontro lby chec ki ngresidua ls.
80ha of the proj ect area (of in total 1500ha) could be
scanned within the first six months using the existing
produ ction capacit y. which clearly indicated , that the
scanning would nee d more than eight yea rs for the entire area of the project. if this current scan rate of approximately0.7ha per day could not be incre ased .It
wasobviou sthat the projectdeadlinecouldnotbe met;
therefo re it was decided to increase the produ ction rate
by the integ rationof amobile system.
3.3 Mob il e terrestrial laser sc anning
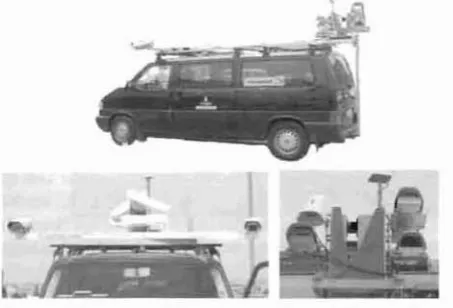
As a consequence the scan progress was significantly
increased by the introduction ofa mob ile mapp ing van
(G ajda mowicz et al. 200 1) fro m the Swedish co mpan y VISIMIN DAS (Figure 4)inJune2007usin g a hybrid sensorsystemon the vehicle consisting of a terrestrial
laser scanning system HDS4500. supp orted by
GPS/IMU and digital cameras. The sensor integr ation
and the calibration of the syste m in the stree ts of
Istanbul too k some weeks, but the data acq uisitio n in
the field was working by the end ofJune 2007. The laser scariner's orient ation was fixed in the horizo ntal
direction , scanni ng only in the profile perpendicularto
the direct ion ofmovemen t of the vehicle. It has been
operated with25 scan profiles/second ,laterimpro ved to
a spee dofup to 40profiles/seco nd (possi ble maximum
by instrume nt spec ificatio n: 50 profiles/second). The
distan ce betw een neigh bourin g profile s was 2-3cm in
the beginning, corr es ponding to a van speed during scanningofO.5m1sec up100.75m/sec or 1.8km/h upto
2.7kmlh.
Figure 4 Senso r configu ra tion on the mobilemapping
vanofVISIMINDAS
Due toproble mswith the recepti o n of the(iPS signal in
the narrow stree ts of the Historic Peninsula cont rol
points were marked on the buildings every five meters
alon g each side of the stree t. Some targets were
remo ved or de stro yed before scanni ng and were
repl ac ed by natural points such as window co rners.
Some target s have been destroyed after scanning. but before the geodetic determ ination of the object coord inates. they also had to be replaced by natu ral points.
The sticking on of the targets was carried out by
BIMTASstaff(4-5 people), while the determi nation of
the targetcoo rdinat es was performedby 81MTAS staff
and additional subco ntrac tors. SIMTAS staff measur ed addi tional natural ground control points. we ll
distributed on the facades, inorder to stabilise the in
-house data processin g of the mob ile mapping syste m.
-For photog rammetric documentation of the building facades as mentioned before. pre-calibrated SLR cam eras Nikon D70 with 14 mm and28mm lenseswere used. The acquired Image s were proce ssed tn combination with the static terres trial laser scanning data. When the mobile system was used for data acquisition, only the imag es of the integrated oblique and horizontal cameras were used for mapping. The upper side wa rd looking camera is vertically ro tated against the lovver camera by approximately 34", enlarging the vertical field of view of the camera system to approximately 86". sothat thecamerasystem starts atan angle lookingdown tothe stree t.
the projec t in order to complete the data acquisition.At leasttwo months will be needed for scannin g by stat ic TLS usin g allava ilabl elaser-scanningsystems.
3.4 Digital photog rammetry
while thesubcontractors only measured the targets. Not allcontrol points have been identifi ed correctly in the point clouds caus ing geometrica l problems for the directgoo-r eferencingand some geom etri cdeformation of the point clouds (Fig ure 5: misfit at block co rners, swmglrtg building facade, erc.). Nevertheles s, the technical parameters of the hybrid systems were optimised on thejob due to these problem s with the qualityof the pre-processed point clouds.
---Figure 5 Geometricprob lems fromdirect geo-referenci ng ofpoint clouds(from leftto right: swinging facade, misfitatblockcomer,and deformation of afacade)
For problematic facades where control points were missing, VISIMI~D recently developed with the so
called 'image tracking tool' an automati c
photcg rammetricbund le adjustment enablingabridgin g oflo ngerdistanceswithoutcontrolpoints (Figure 6).
Figure6 Imagetracking tool for"p rob lematic" facades without contro l points
The speed of data acquisition by terrestr ial laser scannmg with the mobile mapp ing system of VISIMIND could be increas ed signific antly.33 blocks could be scanned in 33 working days until the end of August 2007. Usua lly. scanning could be carried out five days per week (Mo- Fr, plus Sunday) sta rt ing at 6.30amuntil2pm ofeach workingday.Conseque ntly, the laser scanning of the remain ing 50 blockscould be completed with the mobile system with the impro ved to tal production rate of -600 m per hour. while post processing of the multiple sensor data took until early 2008.Theproduct ion rate wasmainly I:10, i.e.forone hourscanning 10 hourspost processing was needed. In total. 12 operators of the laser-scanning group were suppo rting the data post process ing of the mobile mapping system during the major processing phase. Nevertheless, approximately 2% of the area (30 ha) could not be scanned by mobile terrestrial laser scann mg (TLS ) due 10 traffic restrictions and environmental condition s. This remai ning 2% of the totalarea must be scanned by static TLS at the end of
3.5
Mappin g off
a cades
The gee-referenced point clouds from the laser scanmng group were used for line mapping of the facades in a plot scale I:200. The point clouds were
seg mented by two people using Cyclon e software
befor e mappi ng to eliminate unnecessary points and to
reduce the data volume 10 the requested minimal
po rtions forthemappingso ftware.
In this proj ect generatio n of facade maps with 1:200 plot scaleis required.This extre medemandcorres ponds to a standard deviation ofthe position swith 0.2mm in the mapand 4cm in the object space. but this extreme accuracy IS requi red only as relative accuracy; for the absol uteaccuracy astandard deviatio n of0.5mm in the map.corresp onding to 10cm in obje ctspace should be suffi cient.As a tolerance limit three times the sta ndard deviation has been accept ed, Therefor e, the control point configu ration and accuracy must always be checked to obtain this accuracy. While all problem s of static and mobilescann ing were solved.thedelay in the control point determinat ion was a bottleneck in the product ion.
Figure 7 Segmentation of pointclouds
4.0 3D SPATIAL DATABASE
~
! , I[j
~
--=i:i
LJ
L
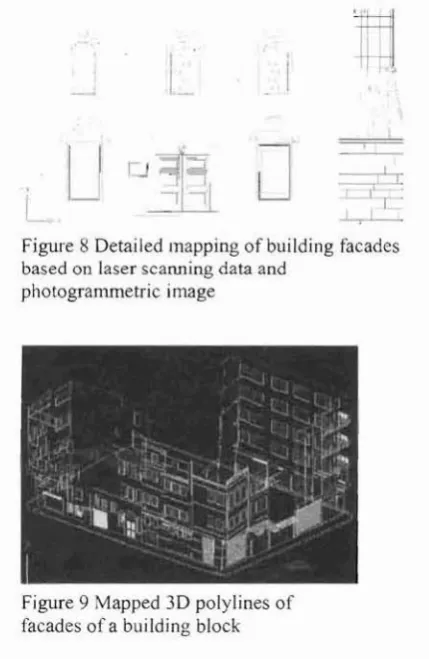
Figu re8Deta iled mappin g of buildingfacades
based on laserscanningdataand
photogrammetric image
Operatio nal 3D G1S still requ ire extens ive efforts as revealed fromthe recentresearch outputand workshop
(see Abdul-Rahman. ct al. 2006). It was interesting to
note that works on fundam ental aspectslike 3Dspatial
database management still not much have been
addressed up 10 the level whcre an operational 3D
system could be realiz ed .Recen tresearch development
shows that 3D spatial modeling is becom ing vrry important fo r many advanced GISapplications and the
scenario is being enhanced by tbe advancement in
computer graphics (hardwa re and software),
visua lization, etc. and also influenced by development in OpenGIS consortium (OGC 1999;OGC, 1999a;
OGe, 2001). 3D visualization environments such as
Google Earth (2008) or 3D navigation software have
already made some contributio nwhere more and more
users could utilize such visualization tools. Until vel)' recently,only very specia lizedapplications wereableto
manage and analyse 3D spatial data. The third
dimension has been mostly used for VIsualization and na vigation. However, we have seen users are looking
for applications that have one or more 3D GIS functionality. Due to the complexity of real-world
spatial objects, various kinds of representation s (c.g. vector, raster. constructive solid geometry, etc.),spatial
data models (topology, and geometry) have been
investigated anddeveloped. including e.g.Pilouk, 1996;
Zlatanova, 2000; and Kada cr al, 2006. The
management of 3D spatial objects has also been
discussed in Orenstein (1986), Pcnnin ga (2005 ),
Figure9Mapped 3D po lylines of facades of a building block
line mapping with limited AutoCAD function ality. It
was estimated that approxima tely 5 million m2 of
facades have to be mapped . The product ion rate was
similarto the static laser scanninggroup: 80 ha with32 operators III approximately 6 mo nths,With regards the
facade area, III total 81.000 m2could be finished in 39 days. which corresponds to 65 m2 per person per day. The production rate could be increased from 60 m:> of facade/day /operator (March 2007) on average to 140
m'zo ay(Octo ber2007),which is more thana factorof a 2 time increase. If one assumes in total 5 million m'
facade area for mapping of the Historic Peni nsula, it
corresponds to an estimated mappmg time of
approximately five yearswith 34 opera tors working on 210 days per year. This estimation indicated that the mapping could not be finished before the deadline of theproject.
For data processing in Z-MAP all related data of the
segmented part (point cloud, Nikon imagers}. camera
calibration file) was saved in one directory using the
name of theblock plus a suffix, e.g. 900_01. Thisblock
name is defined in the cadas tre map. The HP
workstations xw8200 used arc equipped with dual
XEON Processors (3.6 GHZ), 4 G8 RAM and nvidea GraphicCardswith256 ,\1 8 RAM.Forfacademapping the point cloud and one oriented image of the facade were used.Thus,the orientation ofthe photogrammetric image (us uallyrecordedwiththe 14 mm lens) hadto be
determinedby resection inspace usingat leastfive well distributed corresponding po ints (usually corners of windows) in the point cloud and in the image. For the adjustment of the spatial resection thecalibratio n data of the pre-calibrated NIKO N 070s arc used. Usua lly
the residu als ofthecontrol po ints were in the range of
some milhmetres,whichindicated that sufficientresults
have beenachieved. To carryout mapping with Z-MAP the images had to be rectified to the main plane of the
facade.Therefore,the plane was defined by more than three points, which were measured in the point cloud and in the image.Thus. the photos were rectified10the ma in planeof the facad es and shifted to parallel planes
based 011 the point clouds. Based on the dense po int
clouds from the Leica HDS4 500 scanners. the mapping was oftenpossiblewithoutsupport ofthe photos,using justthegrey values ofthepointcloud. Neve rthe less, the co lour photos arc a significantsuppo rt particularly for
the detailed mappmg of bricks and stones, One major
pro blem is the very detailed mapping of bricks and
stones. which rcducc d the speed of mapping
significantly. Unfortunately. thearchitects as the major
clients could not be convinced to usc digital
orthophotos ofthe facades instead of the detailed maps in the scale of I :200. Final product could be der ived
from 3D polylincs as illustrated in Figure 9. Currently, themapp ingof the building facades is stillnot finished.
-Penn inga et st. (2006), Penninga. and van Oosterom (2007), Pu (2005), Pu, and Zlatano va (2006). and
Rignuxet st.(2002).
A universa l and practica l spatial data model that capable of addressing more than one applicat ion are rather hardly available- a model normally serves well for an application. One of the reasons is due to the complexity ofthe real world objects and situations .On the other hand.differentdisciplines emphasize different aspects of information e.g. including different in requirements and output. Thus, a data model could be considered good for a certain application but not so appropriate for other tasks. Different aspects and characteristics of real objects have led to the existence
of several variations in object definition.The solution
for these problems has directly referred to GIS
standardization
Current 3D GIS offer predominantly 2D functionali ty
with 3D visualization and navigation capability.
However, promising deve lopments were observed in
the DBMS domain where more spatial data types, fu nctio ns and indexing mech anism were supported
(PostGIS,2008; Oracle Spatial,2008). In this respect, DB\1S are expected to become a critical component in
deve loping of an operational 3D GIS. However. extend ed research and developments are needed to achieve native 3DsupportatDBMS level.
4.1 Existin g GEO-DBMS for 3D Mod elin g
Existing DBMS provides a SQL schema and fu nctio ns thatfacilitate thestorage,retrieval.update,andquery of
collections of spatial fe atures. Most of the existing spatial databases support the object-or iented model for representing geometries. The benefits of this model is that it support formany geometrytypes,including arcs, circles, and different kinds of compound objects
Therefore, geometries could be model1ed in a single row and single column. The modelalso able to create
and maintain indexes, and later on, perfor m spatial
queries efficiently. In the next section, Oracle Spatial will be discussed. in term of their characteristics,
capabi lities and limitations In handling
multi-dimensional datasers.
4.2 Oracle Spatia l
Oracle Spatial is designed to make spatial data management easier and more natural to users of
locatio n-enabled applications and geographic information system (GIS) applications. Once spatial
data is stored in an Oracle database, it ca n be manipulated, retrieved, and related to all other data storedin thedatabase.Types of spatial data (other than
GIS data) that can be stored usingSpatial include data
from computer-aided design (CAD) and computer
-aided manufacturing (CAM) systems.The Spatial also
stores.retrieves,updates,or queries some collection of featuresthat have both nonspatial andspatialattributes.
Examples of nonsparial attributes are name, soiljype. Ianduseclassificarion. and pan_number. The spatial
attribute is a coordina te geometry, or vector-based representation of theshape of the feature.
Spatial supports the object-relational model for
representing geometries. The object-relational model
uses a table with a single column of
SDO_GEOM ETRY and a single ro w per geometry
instance. The object-relational model corresponds to a "SQL with Geometry Types"implementationof spatial feature tables in the Open GIS ODBC/SQL specification for geospatiat features.
4.3 Mod elin g 3DSolid Using MultiPoly gon
IntheOracle Spatialobject-relational mode l,a3Dsolid
object from 3D primitive is not possible. However, it
could be done by implementing the Multil'olygon that
bou nd a solid. The geometric description of a spatial
objectis stored in a singlerow and in a single column of object type SDO_GEOMET RY in a user-defined
table. Any tables that have a column of type SDO_GEOMETRY must have another column, or set of columns, that definesa unique primary key for that table.Tables of this son are sometimes referred to as geometrytables.
Oracle Spatialdefines theobject type
SDO GEOMETRY as:
CREATETYPEsdo_geometry ASOBJECT (
SDO_OTY PENUM BER.
SDO_SRJDNUM BER,
SDO_PO INTSDO] OINT_TYPE,
SDO_ELEM_I:"JFO
MDS YS.SDO_ELEM_ INFO_ARRAY, SDO ORDINAT ES
MDSYS.SDO_ORDIN ATE_ARRAV);
The advantage of implementing the multipolygon In
DBMS is that the integration between CADandGIS is
possible for 3D visualizat ion, i.e. Oracle (or called Spatial) spatial schema is supported by Bentley
MicroStatic n (2008) and Autodesk Map 3D (2009) .
This is due tothe geometrycolumn provided by Spatial
is directly access to the 3D coordinates of the object. which allow the display tools retrieve spatial
information from the geometry column.
4.4 The Implementation of Geo-DBMS
The implementation of geo-DBMS approac h for laser
scanner data is the main objective for th isstudy.Thus,
the 3Dspatialobjects werestored within Oracle Spatia l
denot es one of the buildings captu red using the laser
scanningsystem(TLS).
NOT NUll NUHRER ( 6)
UARGMAR?(50) NU«RFR( 4j UARC HAR?( lo)
UARCHAR2(10j
«UlIRE R(lo) NU«OE R( 12,3)
tiUHOER(12,3 )
tiUIIAER(12 ,3)
- .MD$y S_ SIlO~G lOfiETRy
,,
,,
,
"
-
--
- ---- - .
--- -~ ,,
,
,
,
,
,
,
,
,
,
CREAn: iAR1..£ 501su ac :
I
10 r.umr.l' t( 1 ) r.ct.
null,
shar<' ,
md ,.ys.!,d -> ce-ooe c ','
GEO~E
TRY
30
Imple m en
Feature
_
_
.
D
..
..
n
Objectn
,
, I). :
-
,
_
0.:
::~"'_:==-,'
"
OWNER
YEII R
HISTORI CAL UUllllitiC
NRHRIRl
-OUl l ll_LE UFl
PE RHtl lER RREA
1J.DLIU1E._ ~C!'!,!"1~l!
f<f--Raw data
SQL) IlESe 8U l lDING._3 1l;
"I
...
..
Nu ll? '\.11'"colu m n
Figur e 12Ageo metrytab le describes allrelated
attribute columns
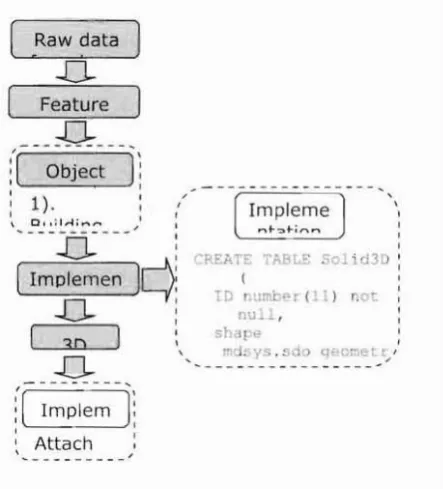
Thc method o logy for the complete implement ation is
giveninFigure 13.
The geo-DBMS approach could provid e spatia l query
related to the specific condit io n. Forthis researc h, the spat ial could be performed using SQL lan guage as shown in Figure 18. Inthe follo wing spatial query , the
expe rimentdefinedall related histori calbuildin g,which
is constructedbefore the yearof 1920.
(b)
I
I
I
I
I
I
I
I
I
Although the comple te coverage of the spat ial data capture d for the buildin g coul d be obtainedoracquired
via the technique , the result of3D point-cl oud sdo not
provide any semant ic related to the building itself, in
terms of spa tia!geometry. object's behaviour(c.g. door is open fro m ins ide the build ing), or related attribute
information (e.g . year of construction),Thus, the laser
scanner data need to be processed in orde r to create
usefulspatia linformation.Thefirst stage cfthcprocess
is relatedto featu reextractionand thediscus sion onthis
aspectcould be found inOudc Elbenn kand vossetman
(2006 ); Tcunissen (1991); vossehn an (2003). Thc result from object extrac tion and reconstruct ion is show n
i
n
Figure II.The implem ent ati on ofgeo-D B!vtS approach for lase r
scanne r data starts with the datab ase cre ati on . A
geo met ry tab le was created inorder to store the spatial
object (secFigu re 12),The GEOMETRY columnsto res
theimpo rtant coordinat e struc tureof3Dspatia lobjects.
For this paper, some of the impo rtant attributes. e.g.
inform ation related to historical building, material of
building construct ion, etc .will also be stored within the
database.
Figure 10The rawdatasetfrom laser scanner figu re13Theworkflow
Figure 11Feature extractionfromlaserscanned data (30 view and 20 planar view
5.0 THE VISUALIZATION OF RETRIEVED 3D SPATIAL OBJECTS
Any spatial quer ies from datab ase wou ld only provid e geometric and seman tic informa tionifthe visualizatio n
facto r is not considere d. DBMS only provides a
medium for themanagem ent ofdata set, and it certai nly
requires a front-en d tool for visu alizing for that
information , as one perceives ill the real world . The data from DBMS nee ds to be integrated into
visualiza tion tool so that itcould be viewed as graph ic.
The 3Dspatial data sto resin the spatialcolumn (within
DBMS), and a connec tion needs to be built so that a
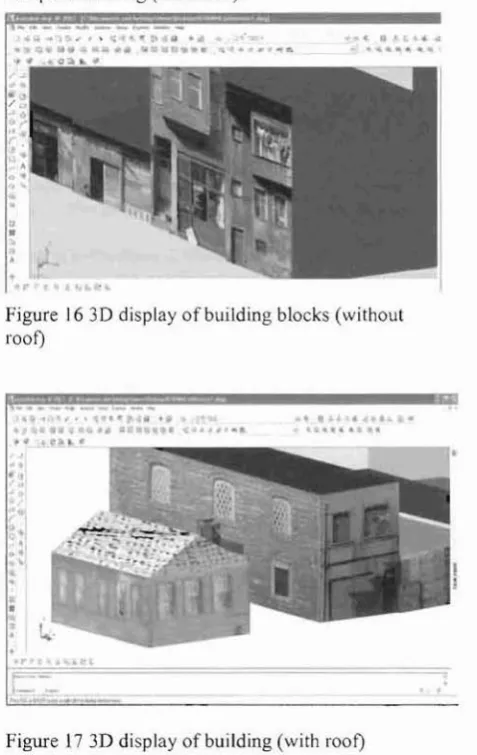
-The initia l3D display of build ingblock only manage s
to prov ide standard co lou rs from Map 3D library.
However , 3D texture s could be attach edinto the spatial objects. This provides the realistic appearance of 3D building blocks as appear ed 111 vari ous city models.
Figure 16 denotes the impleme ntatio n of textures into the 3D spatial object (sim ple build ing without roof).
Figure 17 denotes the simiJar implemen tat ion for
com ptex building (withroof) ,
disp lay too lmana ges to access the spatia l column and
retrieve the datafor 3Dvisualization,
IIis also importa nt 10 no te thar 3D objects need to be visualiz ed in reali sm.With the benefitofthe computer
graphic techn ology , GJS could provide a good display
with tex tur es and co lours . Some web applicat io n, e.g.
Goog le Earth (GE) maintains the texture of spatial
obje ct over the Internet. Here, we used Autcdcsk Map
3D fordisplay ing the3Dspa tialobj ec tinthis resea rch.
' h 4 U • ••~••·".~ ••
.
...
.
~ ~..
•• . e~• •
.
.
'.
.
..
5,1 Oracle SpatialandMap3D schemesIn order to visua lize Oracle spat ial databas e
success fully within the Map 3D enviro nme nt,
synchronization between Oracle spatial and Map 3D
schema is requ ired. However, sampl e spatial datasets
withinOracleSpatialis givenas follows:
~Ol)unet"tlflM1 fMllll tuttOtll: "
2 '.Ut tt •\1911; .
• r • • ...
Figu re 1630displayofbuildin gblocks(w ithout
roof)
.
.
.
.
.
..
e:.
...
"""
.
•J "~ ~• • •• •••.
.
,
.
•
··
...
,
'.
,
:~
.,
..
•
·
..
..
.
~OOCIOl(tRVP" ' ,~ltl . eu,SODfll " t'ft~•• •1(1 , 1113,1, 10.1I11:l, 1,31, tOIl:l.1,Wi,111:1 , I),~OOO.Ollllt! ~RROVl'11m.l_ , _SlJIIIIUu,I. /It/,l1261ol . 1:', l\'''1'3.21,1.1611, lm ....n,'llJ OU.l,1.1111,"1611.98,'1'2l1li1. 16.a./
Afterdetasctsarc insertedmto Oracledatabase, thefirst stageof integra tion is tologininto Map 3D.Thesecond stage of integrati on is to con nect Oracl e schema table
intoMap3D'ssche ma administration.The Map 3D will
prompt user for Oracle database login name and
password. From the Oracle database lists, select the
appropriat edataba sefor visualization .
Figure 14 The extraction of geometricdarasers
After the integration was include d into the Map 3D, databas es arc imported from Oracl e schema table to Map3D. Fea tures sel ec tio n must be identified in order to displaytheappropriatedataset.
5.2 RealTextu re Mapping Figure 173Ddisp lay of building(withroof)
Real texture mapping prov ides good realism of the
obj ects and able to enhance the aest heti c appea ranc e and the understanding ofthe obj ects such as bui ldings, etc.Fritsch (2003) describe sthe conceptof texturing of objects from terrestrial images, and basical ly it is a
process of transforming distorted image to rectified
Image . We used the available tools, Adobe Phoros hop
Paint module to recti fy the distorted image s as
illustratedinFigure J5.
6.0 CONCLUDINGREMARKS
The paper had discussed the implem entation of geo
-DBMS approach pertaining to the 3D spatial data modellin g and management usin g the data generated from the laser sca nning sys tem. The discu ssion s cove r
the implementation of 3D geometry fro m Orac leSpatial.
However, there arc many issues still need to be
addressed inorder to improve the current situat ion of 3Dspatial modeling ofobject sfrom laser scanner data. One of the issues is obj ec ts reconstruction from the
laser scanning system. At the mom ent, most systems
only provide pri miti ve means for obj ect creation (i.e.
manual technique). Out' researc h experi ence shows that
a lot of effort s still need to bedone inorder tocreate the 3D objects automaticall y. The other issue is rela ted to
polyhedron for building block, and tetrahedron for ter ra in mod elin g. This aspe ct can be solve d by implementing the user-de fineddata type within the geo
-DBMS envi ro nment. The most important issue for 3D spa tia l data modeling is the standardization and
specifica tion ofGISthatrelated to theOpen Gcospa tial Consortiu m (OGC standard), from feature ex tracti o n to
fina l 3D dis play. The implementation of 3D spatia l
operations could also be done in geo-DB MS
environment. The spatialope rato rsshould invo lve some proced ures that ab le to usc. quer y, crea te. modify. or delete spatialobjec ts.
Zlatano va S, and Coors V (eds). Lec tu re Note 011 geoinfo rman on and cartog rap hy - innovations in 3D Gco infonn auon systems. Springer-Verlag. pp. 405-41 5.
OGe (1999). Abstract spcciticstioas OHYl'iel~:
Avail ab leathttp:Iw v,.w. ('ll)I.'n gi~.ll rg .
OGC (1999a). OpenGIS simp le ICMures
s
pcciticetion
lorSQL.A vailablc atbltp:/'w\\ \\.IIPcllr;is.org.
OGe (200I). The Ope/1CIS TM Abstract
s
occiticstion.
topic I:tcsturc gcomcoy(ISO 19107Sp,1tialSchema )
Version 5.
Orens tein J (19S6). Spatial query proccssmg 111 all
object-oriented dstsbssc system. In: Proceed ings of 1986 ACM S[G MO D International Con fer enc e on
Ma nage ment ofData , pp.326-336.
Other cha lle nges and issu es in the near futur e incl ude the interopcrabilit y between differ ent app lica tions, data model,the integrat ionbetw een DBMSand visua lizat ion, and the real-time linkage betw eendata mod el and data
acqu isition .
ACKNOWLEDGMENT
Oracle Spatial (2008). h!!n;//\\ww.oraclc.com/.
Availab le
ThankstotheIsta nbul Met ropolit anPlanningUnit (IMP)and BIMTASGISdivisio n espec iallythedata acquis ition unit.
Oude Elber ink S" and vosselman G., (2006) , Adding the third dimension to a topographic dmsbssc using sirb omc laser scsrmcr data.Photogrammctr!c Compu ter Visio n 2006. IAPRS.Bonn.Germany.
REFERENCES
Abdu l-R ahm an A, Zlatanova S. Coors V (2006). Lecture Note on gcomtomuuion ,1IId c.1rtogmphy
-lnnovstia ns in3D Ceo
tnt
ormstion
System s.Springer -Verlag.Abdul-Rah man , A., S, R. Karas. I. B37., and G. Buyuksalih (200R). Mana g ing 3D Geospatial Obj ects
-case stu dy: Istan bu l Historical Peninsula Reg ion.
Proceed ings of Intern at io nal Conferenc e on G[S for Developin g Countries (GISDeco) 2008 . 4 -
7'
''.
June, Istanbul,Turkey.Penuinga F (2005 ). JD toj1og raphic data moddling: why njpd iry is prctcmblc to prsgmetism. In: Spatia l Information Theory, Cosit ' 05, Vol. 3693 of Lecture NOles on Compute rScience, Springer.pp409-425.
Pen ninga F. van Oos terom PJM .Kaza r BM (2006 ).A TEN-based DBMS sppronch ror JD tOjJogmph ic data modclling.In :SpatialData Hand ling2006.
Pen ninga F. van Oos terom PJM (2007 ). A compact topological DBMS dat,1 structure lor JD topogmphy. In. Fabrika nt S. Wacho wic z 1\-1 (eds.), Lecture Notes in Geoinformatio n and Cartography. ISBN: 978-3-540 -72384-4.
Fritsch. D. (2003). Photogram met rie Week Workshop. Stuttgart,Germany
Kada M, Haala N, Becke r S (2006). Impro ving the rcs lism olcx':~tl/1gJD city model In.Abdu l-Rah man A, Arens. C, J. Sroter, and P. v. Oostcrom (2005).
Modelling of 3Dspat ialobjects in ageo- DBMS using a 3Dprimitive. Compu te rsand Geo scienc esJou rna l, Vol. 3I,No . 2, Elsevier,pp. 16 5-177
Goo gl e Earth (2008).
~:/(cart h:RC2.og k.corw.
Available
Riga ux P., Scho ll M, Voi sard A (2002). Snstist
dstoosscs • wit heoplicetion to GIS. MorganKaufmann
Publ ish ers, San Francisco . Pos tGIS (2008).
htlI!;.':/Jlllstgls.rl.'lraClion~!d .
PuS (2005). MaJ1<1g ing trcctormcurves andsurtsccsIii
asP,1t'~11DBMSMscThesis ,TU Delft.
Pilouk M (1996) . tntcg rstc d modelling ror 3D GIS. PhDThesis,
Ir
e.
The Net herlands.PuS, Zlatauova S (2006). IntegrationorCISand CAD
s
r
DBIl,fStc
vct.
In: E. Fendel E, Rumor M {ed s), Proceedin gs ofUO MS' 06 Aalbo rg, Den ma rk ,TUDelft . pp9 .61-9.71.Available
Availa ble
Available
(200 9).
(200H). Aurodcsk Map 3D
hltp:!iu~a.DutQQ~~.tsollll.
Bentley MicruSt ation hUll} ~:~~'\\.bentley.C21l1.
-Teurussen P.1.G. (199 1). An inft'grity and quality
c
ontrol
procedurelorli
se
inmatti sensor
intcgrstioo.In:ProceedingsofIO N GPS-90, 19-2 1 September 1990.pp.
513-522. Colorado Spri ngs,USA .
vossclman G.•(2003).3D reconstruction ofroads and
trees
lor city modelling. ISPR S working group 111/3workshop 3-D reconstruction from airborne laser
scanner and InSAR data. IAPRS, Dresden, Germany. pp.2JI-2:\6.
Zlata nova S (2000). 3D GIS for urban development. PhD thesis,lTC,TheNetherlands.
AUTHORSBIOGRA PHY
Alias Abdul Rah m an
currently is a UTM Professor of 3D GIS and academic staff
member of the Faculty of Geoin formauo n Science and Engineer ing. He received his
PhDand MScfrom University of Glasgow, UK in 2000 and ITC
the Netherlands III 1992
respe ctively.3D G1S is his main research inte rest and has produced 1\\"0 books with
SpringerVerlag onthe subject.Currently he isa Chair for ISPRS Commission II WG 5 on Multidimensional
GIS and Mobile DataMode l for 2008 to2012.
Gurcan Buyuksalih IS
consultant fo r the Istanbul Greater Munici pality. He was
an academic member of
Karaelmas University,
Zo nguldak,Turkey.Hereceived his PhD from University of
Glasgow III 1999 in Photogrammetry. He was a Secretary for ISPRS
Com mission I