This Manuscript is currently under review
National Health-GIS Portal-
A conceptual framework for effective epidemic management and control in India
Vikram Ranga1, Padmini Pani1, Shruti Kanga2, Gowhar Meraj2,3, Majid Farooq2,3, M. S.
Nathawat4 and Suraj Kumar Singh5*
1Center for the Study of Regional Development (CSRD), School of Social Sciences,
Jawaharlal Nehru University, New Delhi -110067
2Centre for Climate Change & Water Research (C3WR) Suresh Gyan Vihar University,
Jaipur, Rajasthan, 302017
3Department of Ecology, Environment and Remote Sensing, Government of Jammu and
Kashmir, Kashmir 190018
4Department of Geography, Indira Gandhi National Open University (IGNOU), New Delhi
5Centre for Sustainable Development, Suresh Gyan Vihar University, Jaipur, Rajasthan,
302017
Phone no. +91-6350504632
*Corresponding author email: [email protected]
Conflict of interest statement: The authors declare no conflict of interest
Running headline:National Health-GIS Portal-A conceptual framework for effective epidemic management and control in India
Abstract
This short note proposes a national Geographic Information System (GIS) - based health infrastructure to deal with epidemics and pandemics. Currently, there is no pan-India health infrastructure available that can compile, update, and report the spread of epidemic diseases. It not only curtails the opportunity of finding the real-time data on the spatial distribution of a disease but prevents one to inquire into the causes of the disease through epidemiological analysis. The proposed infrastructure in this study is a pan-India one and can broadly be divided into two parts, hotspot mapping and accessibility to services. In the first part, hospitals are proposed to act as nodes of data collection, sending data to a national GIS portal. This portal shall have the capabilities of plotting the data using map rendering services such as Google and Bing Maps. This way, hotspots can be visualized in no time, benefitting the government and common citizenry alike. The second part deals with the accessibility of citizenry to a wide range of services, i.e., healthcare services, grocery outlets, emergency services, baby food, and many other essential services of the day to day life. In order to implement this, we propose that the government need to enforce a mandatory submission of locational coordinates of all Goods and Services Tax (GST) enrolled service providers. Once the coordinates are submitted, the government can effectively control the opening and closing of services and inform the citizenry at the same time. The proposed infrastructure is going to help deal with the extraordinary situations during epidemic and pandemics similar to what the world is currently facing in the form of Corona Virus Disease 2019 (COVID-19). Furthermore, the infrastructure can be scaled up or down as per the spread of a disease. The health-GIS platform proposed in this concept paper, shall help India in controlling and managing the epidemic more efficiently.
Background
The use of mapping in studying public health was initiated by the efforts of Dr. John Snow in 1854, where he ended a Cholera epidemic by plotting the death rates on a cadastral map in a part of London city (Anamzui-Yam 2012). He is considered as the father of epidemiology, although the modern methods of studying public health had dramatically evolved since then, especially with the use of statistics and later with spatial sciences such as Geographic Information System (GIS) (Rushton 2003).
Use of GIS in public health concerns two significant areas, e.g., disease pattern studies and health care provider studies. Disease patterns studies include two kinds of approaches, i.e., point pattern analysis (Diggle 2003; Waller and Gotway 2004) and lattice-based analysis (Waller and Gotway 2004) on the other hand health care providers mainly includes evaluation of accessibility. Access, itself, generally described as the ability of people to use health services when and where they are needed (Aday and Andersen, 1974; McLafferty, 2003; Ranga and Panda, 2014). In India, the health infrastructure is divided into sub-centers, primary health centers (PHCs), and community health centers (CHCs) (Chokshi et al. 2016).
Today, the whole world is going through an unprecedented situation whereby a microscopic virus has taken a toll on human lives, which is so vast that the modern world has rarely seen it before (Merrin 2020). It all began when a pneumonia of unknown cause detected in Wuhan, China, was first reported to the World Health Organisation (WHO) country office in China on 31 Dec. ’19 (Phan 2020). The real fangs of the disease started appearing when it spread outside China. Consequently, the WHO declared the disease as a public health emergency of international concern on 30 Jan. ’20. The Corona Virus Disease (COVID-19) kept on increasing; this led the WHO to characterize the COVID-19 as Pandemic, i.e., a worldwide outbreak of a disease, on 11 March’20 (Zhang et al. 2020).
Till now, there is no medication or vaccine for COVID-19 disease (Casadevall and Pirofski 2020). Worldwide trials are underway for inventing a cure for it, but till now, as such, there is no full-fledged medication available (Zhang and Zhong 2020). COVID-19 has crossed all bounds of human existence. Beyond borders, cultures, and societies, currently, no one is safe from the contagion of this disease (Wang 2020). Though from observations, it has been found that specific age-groups and people that already have certain pulmonary and cardiovascular issues are particularly more vulnerable to the lethality of this virus (Santesmasses et al. 2020). Even the environmental factors such as temperature are not showing any significant role in restricting the spread of this virus in India (Meraj et al. 2020). Worldwide, people dying from this disease as of 24 June 2020 are 480210, and confirmed positive cases have reached to 9,376,431. India, notably, witnessed as of this date, 14,490 deaths due to this virus, and the number of positive cases ascended to 456,926 (Worldometer 2020).
India started lockdown strategy way too early than its other Southeast Asian neighbors such as Bangladesh, Pakistan, and Nepal. Initially, the lockdown strategy worked fine; however, due to some variety of region-specific factors such as labor migrations, poverty, and economic slowdown, relaxation in the lockdown strategy was administered by the governments. Although some workers had suggested flexible lockdown strategies (Kanga et al. 2020), but due to labor migrations, state governments and the central government were forced to provide relaxations. Due to these reasons, in India, even after 80 days of lockdown, seemingly, there is no stopping of coronavirus cases and the deaths taking place due to it (Ray and Subramanian 2020).
It has hence, necessitated at the country level to formulate confident policy frameworks that are beyond stringent lockdowns (Alfano and Ercolano 2020). In a country like India, lockdown strategy cannot work for long, and the government has to devise specific measures so that the pandemic such as COVID-19 is managed more effectively, and the public at large is provided a means of respite from being severely affected by this disease both healthwise and economically (Ray and Roy 2020). In this context, we in this paper have put forth a policy framework suggestion to the Government of India to establish a National GIS-based health framework to map pandemics such as COVID-19 as a long term strategy to deal with any future epidemics in India. We have discussed how this can be implemented as well as the advantages of the commissioning of this strategy.
Health-GIS portal
The concept – Accurate geocoding of the affected persons
The key to active management of an epidemic is the precise locational data of the patients that we propose to involve in this framework. Our conceptual framework revolves around the hospitals that shall act as the central nodes in the Health-GIS portal. When an epidemic such as COVID-19, SARS, MERS, and Ebola takes place, hospitals are the centers where patients first approach. We propose that the hospital staff, in addition to asking for the essential patient details, also ask essential address information such as prominent landmarks of the patients so that such address details could be converted into locational coordinate information, a process known as geocoding, when uploading such data in the Health-GIS portal.
Mechanism of implementation.
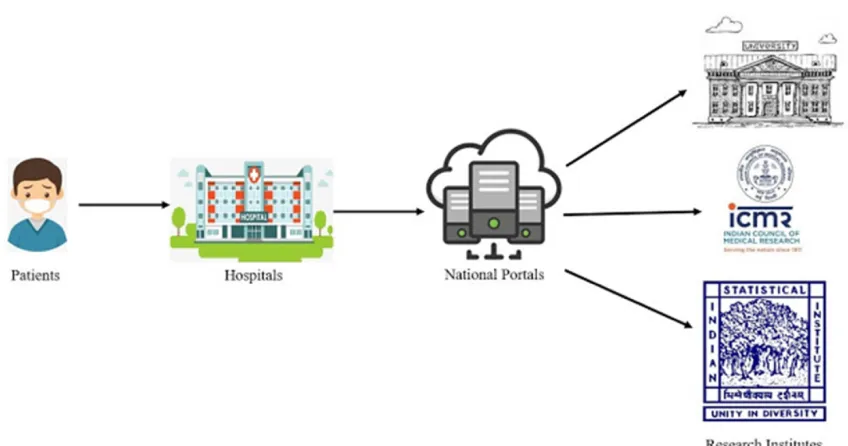
In India, there is already a mechanism in place where the patient information is incorporated into a national health portal. If such information is supplemented with the location data, we shall be able to transform our already existing health portal into a GIS-based epidemic mapping portal. One of the first-hand benefits of using location data is the spatial understanding of the pandemic. By plotting the location data on any map rendering services, such as Google and Bing Maps, epidemiologists and statisticians can rapidly analyze the data to find out where the epidemic started and where is the possibility for its spread (fig. 1).
Fig. 1 A graphical representation of how the flow of information can be planned
The primary task of this framework is the establishment of the national health-GIS portal, encompassing all hospitals in the country and can be effectively achieved by passing a law by the parliament or issuing an ordinance by the President of India.
Advantages of Health GIS portal Mapping of pandemic hotspots
Once the health GIS portal is established, the direct benefits shall be in two main ways. First is the hotspot identification in no time, and second is the spatial data dissemination to various institutes that monitor and frame policies for epidemic control in India. In the case of pandemics such as the current COVID-19, mapping hotspots in no time shall serve immediate intervention in stopping the contagion of this disease (Van Bavel et al. 2020).
Essential Service Control
Accessibility to a service is the reach-ability to a service. If services are within reach, accessibility is termed to be useful (Doetsch et al. 2017). In cases of pandemics (COVID-19), timely and efficient accessibility to not only hospitals but also to all other goods such as grocery, milk, vegetable, and pharmacies and services such as banking, education, insurance, transportation, and medical treatment within and outside hotspots is essential (Smith et al. 2020).
In order to control these services during the pandemic, we propose that all GST (Goods and Services Tax) enrolled service providers to register their location coordinates to the government. It shall be another GIS information layer within the health GIS portal. The government, in turn, shall use these locations to control their services in extraordinary circumstances. For example, which grocery shop or pharmacy to be opened in which hours can easily be regulated through the health GIS portal (fig. 2).
bringing transparency in the management of the pandemic. Additionally, the data and information will empower the government to have more control over the resources of the nation and will be better prepared to tackle the epidemic or pandemic situations.
Fig. 2 A graphical representation of how the service providers can be geo-located and put in an App.
Hence after the establishment of the health GIS portal, wherever the infection happens, it will be marked quickly over the map. Moreover, GIS will help in buffering the extent of the spread, e.g., an infected person can go to 300-500 meter and can spread infection, but if the area is designated as a hotspot with different zones for limiting the activities in the area, the pandemic can be effectively managed (Kanga et al. 2020). Additionally, which service providers are nearest or safest can be judged, and the same information can be communicated to the public. This strategy can help designate different areas into red, orange, and green zones based on the evidence-based spatial modeling approaches (Kanga et al. 2020).
Discussion and conclusions
Geographic information system (GIS) has since long helped the epidemiologists working in the field of spatial epidemiology to understand flow patterns during the spread of an epidemic such as SARS and COVID-19 (Kraemer et al. 2020). The role of GIS is not limited to epidemiology alone, rather foundational fields of medicine such as oncology and environmental epidemiology have used it for understanding the disparities and several other factors that form the basis for the widespread occurrence of diseases (Calvert et al. 2010; Walker 2016).
The spread of epidemics like COVID-19 can be modeled for its contagion in GIS using techniques such as proximity analysis, spatial aggregation, interpolation, and regression (Auchincloss et al. 2012; Leslie 2020). During the current pandemic of COVID-19, once the health GIS is setup, authorities can identify the pandemic clusters, i.e., the spatial distributions of COVID-19 cases to evaluate its incidence and prevalence in areas that are not infected yet with this disease. Based on the scale of infection and other environmental factors (global, local, and focal), GIS can further use different clustering techniques to perform the analysis (Unwin 1996; Clennon et al. 2004; Yeshiwondim et al. 2009).
trypanosomiasis, malaria, and onchocerciasis. Disease mapping is an efficient tool to optimize the efforts of governments for containing the spread of an epidemic since it helps in the identification of disease distribution irrespective of the local boundaries and helps in the observation of the control measures employed (Carroll et al. 2014; Caprarelli and Fletcher 2014; Alimi et al. 2015).
One of the crucial strategies in controlling the current epidemic in India and elsewhere in the world is restricting the number of new infections of COVID-19. Though lockdowns have substantially stopped its spread, but its efficiency has not been outstanding in a densely populated country like India, Bangladesh, and Pakistan (Dhama et al. 2020; Tröster, 2020). We have observed that the R0 (R-Naught) has shown peak and dips throughout the lockdown period in India. In order to reduce the R0, GIS can help in advocating scientific means to restrict the flow of the super spreaders from the hotspots of disease (Kanga et al. 2020).
Health GIS portal, once successfully implemented in India, shall serve as a link between medical science and the geographical factors associated with the disease outbreak (Curtis et al. 2000; Asheim and Gertler 2005; Arcury et al. 2005). India being geographically diverse, health-related issues, when mapped using GIS, shall help in tracing the susceptible populations, outcomes of health interventions, and evaluation of the risk factors associated with any current and future epidemic using GIS-based spatial modeling approaches and the relationships between them (Sadler et al. 2001; Chacko 2004). Already organizations such as National Remote Sensing Centre (NRSC) through the Bhuvan portal have all the environmental information mapped for pan India, and once such a system is integrated with the Health GIS, a new realm of progression in the Indian healthcare system will commence. Additionally, it has even been made mandatory by the United Nations through the SDG-3 to set up the specialized health care system for promoting the health and well-being of the people. India being at the forefront of development, has introduced several initiatives in the health sector to promote reduced inequalities and better healthcare for one and all (WHO 2015; Campbell 2017; Hall et al. 2018). The health GIS concept for epidemic control shall supplement India’s efforts in this direction.
Conflict of interest statement: The authors declare no conflict of interest References
Aday, L.A., Andersen, R., 1974. A Framework for the Study of Access to Medical Care. Health Serv. Res. 9, 208–220.
Alfano, V., & Ercolano, S. (2020). The Efficacy of Lockdown Against COVID-19: A Cross-Country Panel Analysis. Applied Health Economics and Health Policy, 1.
Alimi, T. O., Fuller, D. O., Quinones, M. L., Xue, R. D., Herrera, S. V., Arevalo-Herrera, M., ... & Beier, J. C. (2015). Prospects and recommendations for risk mapping to improve strategies for effective malaria vector control interventions in Latin America. Malaria Journal, 14(1), 1-15.
Asheim, B. T., & Gertler, M. S. (2005). The geography of innovation: regional innovation systems. In The Oxford handbook of innovation.
Auchincloss, A. H., Gebreab, S. Y., Mair, C., & Diez Roux, A. V. (2012). A review of spatial methods in epidemiology, 2000–2010. Annual review of public health, 33, 107-122. Boulos, M. N. K. (2004). Towards evidence-based, GIS-driven national spatial health
information infrastructure and surveillance services in the United Kingdom. International Journal of Health Geographics, 3(1), 1.
Calvert, G. M., Mehler, L. N., Alsop, J., De Vries, A. L., & Besbelli, N. (2010). Surveillance of pesticide-related illness and injury in humans. In Hayes’ Handbook of Pesticide Toxicology (pp. 1313-1369). Academic Press.
Campbell, D. A. (2017). An update on the United Nations millennium development goals. Journal of Obstetric, Gynecologic & Neonatal Nursing, 46(3), e48-e55.
Caprarelli, G., & Fletcher, S. (2014). A brief review of spatial analysis concepts and tools used for mapping, containment and risk modelling of infectious diseases and other illnesses. Parasitology, 141(5), 581-601.
Carroll, L. N., Au, A. P., Detwiler, L. T., Fu, T. C., Painter, I. S., & Abernethy, N. F. (2014). Visualization and analytics tools for infectious disease epidemiology: a systematic review. Journal of biomedical informatics, 51, 287-298.
Casadevall, A., & Pirofski, L. A. (2020). The convalescent sera option for containing COVID-19. The Journal of clinical investigation, 130(4), 1545-1548.
Chacko, E. (2004). Positionality and praxis: fieldwork experiences in rural India. Singapore Journal of Tropical Geography, 25(1), 51-63.
Chokshi, M., Patil, B., Khanna, R., Neogi, S. B., Sharma, J., Paul, V. K., & Zodpey, S. (2016). Health systems in India. Journal of Perinatology, 36(3), S9-S12.
Clennon, J. A., King, C. H., Muchiri, E. M., Kariuki, H. C., Ouma, J. H., Mungai, P., & Kitron, U. (2004). Spatial patterns of urinary schistosomiasis infection in a highly endemic area of coastal Kenya. The American journal of tropical medicine and hygiene, 70(4), 443-448.
Curtis, S., Gesler, W., Smith, G., & Washburn, S. (2000). Approaches to sampling and case selection in qualitative research: examples in the geography of health. Social science & medicine, 50(7-8), 1001-1014.
Dhama, K., Sharun, K., Tiwari, R., Sircar, S., Bhat, S., Malik, Y. S., ... & Rodriguez-Morales, A. J. (2020). Coronavirus disease 2019–COVID-19.
Diggle, P.J., 2003. Statistical analysis of spatial point patterns., Second. ed. Edward Arnold, London.
Doetsch, J., Pilot, E., Santana, P., & Krafft, T. (2017). Potential barriers in healthcare access of the elderly population influenced by the economic crisis and the troika agreement: a qualitative case study in Lisbon, Portugal. International journal for equity in health, 16(1), 184.
Eisen, L., Coleman, M., Lozano-Fuentes, S., McEachen, N., Orlans, M., & Coleman, M. (2011). Multi-disease data management system platform for vector-borne diseases. PLoS Negl Trop Dis, 5(3), e1016.
Hall, N. L., Ross, H., Richards, R., Barrington, D. J., Dean, A. J., Head, B. W., ... & Hill, P. S. (2018). Implementing the United Nations’ sustainable development goals for water and beyond in Australia: A proposed systems approach. Australasian journal of water resources, 22(1), 29-38.
Kanga, S., Sudhanshu, Meraj, G., Farooq, M., Nathawat, M. S., & Singh, S. K. (2020). Reporting the Management of COVID-19 Threat in India Using Remote Sensing and GIS-Based Approach. Geocarto International, (just-accepted), 1-6. https://doi.org/10.1080/10106049.2020.1778106
Kanga, Shruti, Sudhanshu, Gowhar Meraj, Majid Farooq, M. S. Nathawat, and Suraj Kumar Singh. “Reporting the Management of COVID-19 Threat in India Using Remote Sensing and GIS-Based Approach.” Geocarto International just-accepted (2020): 1-6. https://doi.org/10.1080/10106049.2020.1778106
Kraemer, M. U., Yang, C. H., Gutierrez, B., Wu, C. H., Klein, B., Pigott, D. M., ... & Brownstein, J. S. (2020). The effect of human mobility and control measures on the COVID-19 epidemic in China. Science, 368(6490), 493-497.
Lauer, S. A., Grantz, K. H., Bi, Q., Jones, F. K., Zheng, Q., Meredith, H. R., ... & Lessler, J. (2020). The incubation period of coronavirus disease 2019 (COVID-19) from publicly reported confirmed cases: estimation and application. Annals of internal medicine, 172(9), 577-582.
Lee, V. J., Chiew, C. J., & Khong, W. X. (2020). Interrupting transmission of COVID-19: lessons from containment efforts in Singapore. Journal of Travel Medicine, 27(3), taaa039.
Leslie, D. (2020). Tackling COVID-19 through responsible AI innovation: Five steps in the right direction. Harvard Data Science Review.
McLafferty, S.L., 2003. GIS and Health Care. Annu. Rev. Public Health 24, 25–42. https://doi.org/10.1146/annurev.publhealth.24.012902.141012
Meraj, G., Farooq, M., Singh, S. K., Romshoo, S. A., Nathawat, M. S., & Kanga, S. (2020). Coronavirus Pandemic vs. Temperature in the context of Indian Subcontinent–A preliminary statistical analysis. https://dx.doi.org/10.21203/rs.3.rs-35809/v1
Merrin, W. (2020). Anthropocenic war: coronavirus and total demobilization. Digital War, 1-14.
Number of COVID-19 cases on 24/06/2020.
https://www.worldometers.info/coronavirus/about/
Phan, T. (2020). Novel coronavirus: From discovery to clinical diagnostics. Infection, Genetics and Evolution, 79, 104211.
Ranga, V., Panda, P., 2014. Spatial access to in-patient health care in northern rural India. Geospatial Health 8, 545–556.
Ray, D., & Subramanian, S. (2020). India’s Lockdown: An Interim Report (No. w27282). National Bureau of Economic Research.
Ray, S., & Roy, M. (2020). Susceptibility and Sustainability of India against CoVid19: a multivariate approach. medRxiv.
Sadler, G. R., Dhanjal, S. K., Shah, N. B., Shah, R. B., Ko, C., Anghel, M., & Harshburger, R. (2001). Asian Indian women: knowledge, attitudes and behaviors toward breast cancer early detection. Public Health Nursing, 18(5), 357-363.
Santesmasses, D., Castro, J. P., Zenin, A. A., Shindyapina, A. V., Gerashchenko, M. V., Zhang, B., ... & Gladyshev, V. N. (2020). COVID-19 is an emergent disease of aging. MedRxiv.
Smith, A. C., Thomas, E., Snoswell, C. L., Haydon, H., Mehrotra, A., Clemensen, J., & Caffery, L. J. (2020). Telehealth for global emergencies: Implications for coronavirus disease 2019 (COVID-19). Journal of telemedicine and telecare, 1357633X20916567. Tröster, B. (2020). Commodity-dependent countries in the COVID-19 crisis (No. 25). ÖFSE
Briefing Paper.
Unwin, D. J. (1996). GIS, spatial analysis and spatial statistics. Progress in Human Geography, 20(4), 540-551.
Van Bavel, J. J., Baicker, K., Boggio, P. S., Capraro, V., Cichocka, A., Cikara, M., ... & Drury, J. (2020). Using social and behavioural science to support COVID-19 pandemic response. Nature Human Behaviour, 1-12.
Walker, B. B. (2016). Towards a suburban spatial epidemiology: differentiating geographical patterns of cancer incidence, patient access, and surgical treatment in Canada’s urban fringe (Doctoral dissertation, Environment: Department of Geography).
Waller, L.A., Gotway, C.A., 2004. Applied Spatial Statistics for Public Health Data. John Wiley & Sons.
Wang, T. (2020). The COVID-19 Crisis and Cross-Cultural Experience of China’s International Students: A Possible Generation of Glocalized Citizens?. ECNU Review of Education, 2096531120931519.
World Health Organization. (2015). Trends in maternal mortality: 1990-2015: estimates from WHO, UNICEF, UNFPA, World Bank Group and the United Nations Population Division. World Health Organization.
Yeshiwondim, A. K., Gopal, S., Hailemariam, A. T., Dengela, D. O., & Patel, H. P. (2009). Spatial analysis of malaria incidence at the village level in areas with unstable transmission in Ethiopia. International Journal of Health Geographics, 8(1), 5.
Zhang, J., Litvinova, M., Liang, Y., Wang, Y., Wang, W., Zhao, S., ... & Ajelli, M. (2020). Changes in contact patterns shape the dynamics of the COVID-19 outbreak in China. Science.
Zhang, J., Litvinova, M., Wang, W., Wang, Y., Deng, X., Chen, X., ... & Wu, Q. (2020). Evolving epidemiology and transmission dynamics of coronavirus disease 2019 outside Hubei province, China: a descriptive and modelling study. The Lancet Infectious Diseases.