The Use of the ORANI Model in the Immigration Debate
11
0
0
Full text
(2) Abstract. Since 1985, a number of influential studies on the economic effects of immigration have been based on the ORANI model of the Australian economy (eg Baker-CEDA, 1985; CIE-CAAIP, 1988; CIEBIR, 1990). The results have generally been interpreted as showing that the economic effects of immigration are favourable. Critics of the use of ORANI argue that the model's results are too dependent on assumptions built into the model or imposed for particular experiments. This paper considers the influence of the assumptions on the results in the studies and reports results from simulations with alternative assumptions.. i.
(3) CONTENTS. Abstract. i. Introduction. 1. The Baker-CEDA Study. 1. The CIE-CAAIP Study. 3. The Welfare Implications of CEDA and CIE-CAAIP. 3. The CIE-BIR Study. 4. Concluding Remarks. 7. References. 8. TABLES. Table 1. Table 2. Economies of Scale and Immigration: Results from ORANI. 3. The Short-run Macroeconomic Effects of a 1.0 per cent Immigration-induced Increase in Population. 6. ii.
(4) The Use of the ORANI Model in the Immigration Debate by Matthew W. PETER1 Centre of Policy Studies Monash University. Introduction Since 1985, three influential studies on the economic effects of immigration have been based on the ORANI model of the Australian economy (Baker-CEDA, (Baker, 1985); CIE-CAAIP, (CIE, 1988); CIE-BIR, (CIE, 1990)2. The results have generally been interpreted as showing that the economic effects of immigration are favourable. Critics of the use of ORANI (e.g., Wooden 1990, pp.122-3) argue that the model's results are too dependent on assumptions either built into the model or imposed on it for particular experiments. In this paper, the Baker-CEDA, CIE-CAAIP and CIE-BIR studies are examined with special attention to the influence of critical assumptions. The Baker-CEDA Study The Baker-CEDA study aims to assess the effect of immigration on GNP per household. CEDA constructed a preferred scenario which included an annual immigrant intake of 100,000 over the period 1985 to 2001, compared with a control scenario of 50,000 immigrants per annum. Two ORANI simulations were performed using the preferred scenario. One used a standard configuration of ORANI with constant returns to scale. The second allowed for economies of scale in production. Not surprisingly, GNP per household remained unchanged from the control scenario in the first simulation but increased in the second. ORANI recognises 112 industries covering all production within Australia. One problem is the lack of empirical estimates of economies of scale for these 112 industries. On the basis of a literature review, CEDA classified industries as having high, medium or low economies of scale. Industries were assigned to the medium category where 'guesstimates' were not possible (Miekle, 1985). Where industries were assigned to the high category, ORANI was configured with a scale elasticity of 1.11. This means that a 1 per cent increase in inputs leads to a 1.11 per cent increase in output. Industries with medium and low economies of scale were assigned scale elasticities of 1.05 and 1.01 respectively.. 1. The author is grateful to B. Parmenter, R. Birrell, P. Dixon, M. Malakellis, G.A. Meagher and J. Menon for their comments.. 2. The citations name the study's author followed by the commissioning agency. The acronyms are Committee for Economic Development of Australia, Centre for International Economics, Committee to Advise on Australia's Immigration Policies and Bureau of Immigration Research.. 1.
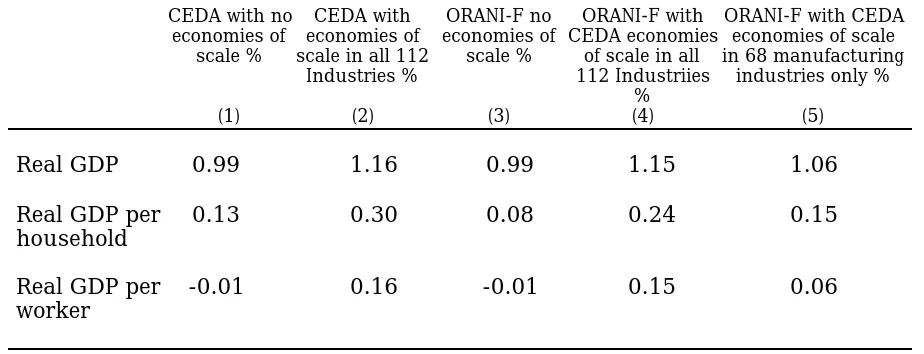
(5) 2. Matthew W. Peter. At the broad sectoral level, the weighted average scale elasticities for primary, manufacturing and service industries were 1.03, 1.06 and 1.05 respectively. Peter (1991) estimated scale elasticities for ORANI's manufacturing industries from a literature survey by Pratten (1989). The weighted average of the Peter elasticities for manufacturing is 1.06, similar to the figure used by CEDA. Evidence suggests that economies of scale in service-sector industries are well below those in manufacturing (Pratten, 1989). CEDA arbitrarily assigned all service industries the medium scale elasticity of 1.05. In the ORANI database used by CEDA, the service sector commands 49 per cent of the economy's resources (Blampied, 1985). Therefore, CEDA's assumption of relatively large economies of scale in the service sector is likely to be influential in their simulations. A similar criticism can be made of the scale economies assigned to primary sector industries. Seventeen primary sector industries are recognised in ORANI. CEDA assigned low economies of scale to five and medium economies of scale to twelve. Of the twelve, CEDA had information on only one (Coal and Crude Oil), with the remaining eleven arbitrarily assigned medium economies of scale. CEDA's version of ORANI has been superseded and it has not been possible to reproduce the CEDA simulations exactly. But, as an indication of the quantitative influence of CEDA's assumptions about economies of scale, simulations using the most recent version of ORANI (ORANI-F) were performed, with the long-run economic environment used by CEDA replicated as closely as possible. The CEDA study choose GNP as its reported measure of aggregate output. ORANI-F does not report GNP, however, both the CEDA version of ORANI and ORANI-F calculate the closely related GDP measure of aggregate output. Therefore, the analysis that follows uses GDP in place of GNP. Table 1 reports the effects on the growth rates of real GDP, real GDP per capita and real GDP per worker of a 1.0 per cent immigration-induced increase in the rate of growth of the workforce. As in the CEDA study, it is assumed that employment growth matches workforce growth. Column 1 reports the CEDA results with the standard ORANI assumption of no economies of scale. Column 2 reports the CEDA results with economies of scale in all industries. The influence of economies of scale is significant, with 0.17 percentage points being added to the growth rates of real GDP, real GDP per household and real GDP per worker. In particular, the assumption of economies of scale reverses the sign of the labour productivity result as measured by real GDP per worker. Columns 3 and 4 reproduce the CEDA studies using ORANI-F. With ORANI-F, the impact on GDP of the CEDA economies of scale in all industries is to add 0.16 percentage points to the GDP growth rates. The figures in the column 5 are results from the ORANI-F simulation where the CEDA economies of scale are assumed in manufacturing industries only. The results in column 5 reveal that when economies of scale are applied only to manufacturing industries, the economies of scale effect is halved from an additional 0.16 percentage points to an additional 0.07 percentage points. These results are confirmed by Peter's medium-run ORANI-F study. Using the Pratten based estimates of economies of scale in manufacturing industries, Peter finds that the economies of scale effect adds about 0.03 percentage points to GDP growth compared to growth with no economies of scale..
(6) The Use of the ORANI Model in the Immigration Debate. 3. Table 1 Economies of Scale and Immigration: Results from ORANI. Effects on Growth Rates of 1% Immigration-induced Increase in the Rate of Growth of the Workforce ORANI-F with ORANI-F with CEDA ORANI-F no CEDA with no CEDA with economies of economies of economies of CEDA economies economies of scale of scale in all in 68 manufacturing scale % scale in all 112 scale % 112 Industriies industries only % Industries % % (5) (4) (3) (2) (1). Real GDP. 0.99. 1.16. 0.99. 1.15. 1.06. Real GDP per household. 0.13. 0.30. 0.08. 0.24. 0.15. Real GDP per worker. -0.01. 0.16. -0.01. 0.15. 0.06. The CIE-CAAIP Study This study also used ORANI to measure the influence of immigration on aggregate output per capita. In addition, it assessed the influence of the skill levels of immigrants on economic performance. However, given the simple set of assumptions underlying the CIE-CAAIP simulations, their results can be reproduced with a very simple aggregate model. The CIE-CAAIP assumptions are: that aggregate private consumption expenditure (C), aggregate investment expenditure (I) and aggregate government expenditure (G) move in the same proportion; that the trade balance is fixed; that exports move proportionally with employment; that capital stocks adjust to maintain industries' relative rates of return; that the real wage adjusts to ensure that employment moves with the labour force; and that immigration-induced employment growth is greater than immigration-induced population growth. The first two assumptions imply that growth in GDP and C, I and G are equal. The first three assumptions ensure the economy experiences balanced growth. The last assumption means that the workforce participation rate of immigrants is higher than that of the pre-immigration population. Given these assumptions, it is inevitable that GDP per capita should increase with immigration. The CIE-CAAIP study also finds that the increment to GDP per capita from additional immigration is positively related to the immigrants' workforce skill level. In testing this proposition with ORANI, CIE-CAAIP simulate an increase in effective employment of 5.0 per cent by the year 2030 due to assumed high labour productivity of additional immigrants. Given the other (above mentioned) assumptions of the simulations, the additional productivity naturally results in higher GDP and GDP per capita in 2030 of approximately 5.0 per cent..
(7) 4. Matthew W. Peter. The Welfare Implications of CEDA and CIE-CAAIP The CEDA and CIE-CAAIP studies use respectively, GNP and GDP per capita as their indicator of economic welfare. Parmenter (1990) argues that assessing the economic welfare effects of immigration on the basis of changes in measures of output per capita, such as GNP per capita or GDP per capita, can be misleading. For example, where additional immigrants have lower workforce participation rates or lower skills than the per-immigrant population, but where industry is subject to economies of scale, output per capita may fall if the low productivity of immigrants dominates the economies of scale effect. However, if workers are paid their marginal product, immigrants would be paid less than the pre-immigrant workforce who may experience an increase in pay due to the scale effects. According to Parmenter, we can assume, via their choice to migrate, that the immigrants are better-off than had they not migrated. Hence, if pre-immigrant population's income rises (despite the fact that aggregate income per capita falls), both the immigrants and the pre-immigrant population are better-off. However, Parmenter and Peter (1991) show that in the CIE-CAAIP study, despite an increase in aggregate income per capita (that is, the combined per capita income of immigrants and the pre-immigrant population), the pre-immigrant population's income decreases. There are two main reasons why ORANI produces this result. First, even in the long-run, ORANI recognises that agricultural land is a fixed factor in the production process. Growth in employment and the capital stock in response to immigration, increases the returns to the scarce factor, land, but reduces the returns to the abundant factor labour. The returns to capital in the long-run are fixed by assumption. Second, the assumed expansion of exports in the CIE-CAAIP study drives down the world price of exports in markets where Australia faces demand curves that slope downwards (e.g. wool). This results in a decline in the terms of trade which reduces returns to both labour and land. Using the industry results on returns to land and labour from the CIE-CAAIP simulation and making allowance for additonal income generated by the increase in the pre-immigrant population's ownership of capital, Parmenter and Peter calculate that the pre-immigrants population's income per capita falls by -0.70 per cent. In this case, the increase in the immigrants' welfare would have to be assigned a higher weighting than the decrease in the welfare of the pre-immigrant population's to conclude, as does CIE-CAAIP, that additional immigration leads to increased economic welfare. The CIE-BIR Study In 1990, the CIE reported ORANI simulations of the short-, medium- and long-run effects of immigration on Australia's foreign trade account (CIE-BIR, 1990). This section concentrates on the short-run simulation which showed immigration improving the trade balance. The short-run can be thought of as a period of between one and two years. In the CIE-BIR short-run simulation, growth in employment is assumed to absorb the immigration-induced growth in the workforce. The user of the model determines the growth in employment and the workforce and the model then projects a real-wagerate adjustment compatible with the employment assumption. This is the standard assumption adopted when ORANI is used for long-run simulations where it is thought that enough time has elapsed for excess demand or supply conditions in the labour.
(8) The Use of the ORANI Model in the Immigration Debate. 5. market to be eliminated. ORANI can also be used to model labour markets with real wage rigidities which are a more typical short-run phenomenon. In this setting, the real wage outcome is specified by the user and the model determines the employment growth which is compatible with the wage assumption. In the recessionary phase of the business cycle, rigidities, such as centralised wage agreements, cause the real wage rate to remain above the market clearing rate. This results in an excess supply of labour, that is, unemployment. If the workforce is increased by immigration, the rigidities keep the real wage at the pre-immigrant level, with the consequence that unemployment increases. In the recovery phase, however, real wages are typically assumed to be flexible. The wage rigidity places a floor under the real wage rate when the supply of labour exceeds demand, but it does not inhibit the real wage from rising when demand exceeds supply. Some economists, for example, Wooden (1989, p141) and Ackland and Williams (1992), maintain that immigration-induced expenditure on goods and services creates jobs. These new jobs absorb the additional workforce even in a recession with wage rigidities. Immigrants generate consumption expenditure even if they initially have difficulty finding employment. For example, immigrants transfer funds on moving from their country of origin to Australia and these funds may be used by to finance initial setting-up expenditures. Also, the government may spend to supply the immigrants with services. An alternative scenario is that, with real wages fixed, additional demand creates price and wage inflation which results in a loss of international competitiveness. Consequently, demand is satisfied by imports and a reduction in exports rather by an increase in production and employment. Another line of argument is based predominantly on the interpretation of statistical results. Ackland and Williams (1992) use the Granger causality technique3 to examine the most recent three recessions and to confirm earlier findings of Withers and Pope (1984 and 1985) and Chapman, Pope and Withers (1985). Ackland and Williams present these results as evidence that immigration does not affect the unemployment rate, even in a recession. However, Granger causality is not causality in the usual sense of the word. Granger causality is more a test of precedence, and caution should be taken in interpreting results in the usual cause and effect way. For example, the farmer rises before dawn (which means that there is Granger causality between the farmer and the sun rising), but the farmer does not cause the sun to rise. These cautionary observations are not intended as an outright dismissal of the results from Granger tests. Rather, they are a caution that in the absence of confirming results from more convincing theoretically-based models, the results from the Granger causality studies are not sufficient for us to ignore the possibility that immigration may cause unemployment in a recession. The relevance of the preceding discussion for studies of the short-run effects of immigration is that two extreme labour market scenarios should be tested: (i) where it is assumed that workforce growth and employment growth move together and the real wage is free to adjust; and (ii) where the real wage is fixed and the employment. 3. See, for example, D. Gujarati (1988) pp541-543, for a description of Granger Causality..
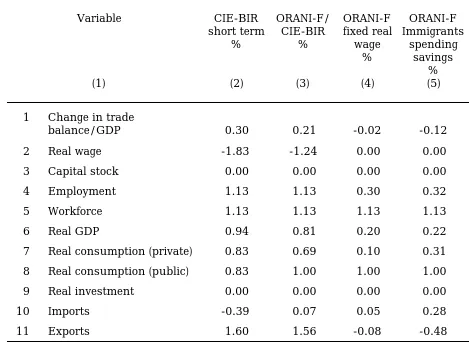
(9) 6. Matthew W. Peter. response, if any, is determined by immigration-induced changes to demand for goods and services. Now consider how the two alternative assumptions affect the CIE-BIR's short-run results. Column 2 of Table 2 reports the macroeconomic results of the CIE-BIR simulation, adjusted to show the effect of additional immigration which adds 1.0 percentage point to the population. The figures in Table 2 are the percentage point Table 2 The Short-run Macroeconomic Effects of a 1.0 per cent Immigration-induced Increase in Population.. 1. Variable. CIE-BIR short term %. ORANI-F/ CIE-BIR %. (1). (2). (3). 0.30. 0.21. -0.02. -0.12. -1.83. -1.24. 0.00. 0.00. Change in trade balance/GDP. ORANI-F ORANI-F fixed real Immigrants wage spending % savings % (4) (5). 2. Real wage. 3. Capital stock. 0.00. 0.00. 0.00. 0.00. 4. Employment. 1.13. 1.13. 0.30. 0.32. 5. Workforce. 1.13. 1.13. 1.13. 1.13. 6. Real GDP. 0.94. 0.81. 0.20. 0.22. 7. Real consumption (private). 0.83. 0.69. 0.10. 0.31. 8. Real consumption (public). 0.83. 1.00. 1.00. 1.00. 9. Real investment. 0.00. 0.00. 0.00. 0.00. 10. Imports. -0.39. 0.07. 0.05. 0.28. 11. Exports. 1.60. 1.56. -0.08. -0.48. additions to the values the variables listed in column 1 would have taken had the additional immigration not occurred. In the CIE-BIR study (column 2), employment was assumed to increase by 1.13 per cent (row 4) necessitating a fall in the real wage of 1.83 per cent (row 2). The decline in the real wage reduces the domestic costs of production which favours the traded-goods sector. The result is a rise in exports of 1.60 per cent (row 11) and a fall in imports of 0.39 per cent (row 10). The trade balance improves by 0.30 per cent of GDP (row 1)..
(10) The Use of the ORANI Model in the Immigration Debate. 7. In column 3, the CIE-BIR study is simulated using ORANI-F configured, as closely as possible, to the version of ORANI used by the CIE.4 The results are qualitatively similar to those of the CIE-BIR study. Differences occur because of the assumptions in the ORANI-F simulation that government consumption expenditure moves with population, rather than with real private consumption expenditure, and that the government maintains a fixed ratio of the public-sector-borrowing-requirement to GDP The ORANI-F replication of the CIE-BIR simulation is used as a benchmark against which two further ORANI-F simulations can be compared. The results in column 4 are from a simulation where only the employment/real wage assumption of the CIE-BIR study is reversed to capture the effects of a real wage rigidity in recession. In this simulation, the additional demand associated with immigrants (i.e., government consumption expenditure and private consumption expenditure) results in inflationary pressure as prices and nominal wages rise due to the real wage rigidity. Higher costs in the economy cause imports to increase and exports to decrease (rows 10 and 11). The immigration-induced increase in domestic demand results in only a small increase in domestic production (row 6) and employment (row 4). Employment growth is less than the growth in the workforce (row 5) resulting in an increase in the unemployment rate. Additional demand is satisfied by imports and by a diversion of resources from exports. Therefore, with real wages fixed, the trade balance result of the ORANI-F/CIE-BIR simulation is reversed. As mentioned, another source of expenditure that some commentators believe can contribute to job creation is funds transferred by immigrants on arrival in Australia. If immigrants were to spend their transferred savings, consumption expenditure could be higher. In column 5, an additional shock to nominal consumption expenditure, equal to immigrants transferred funds, was applied. Real consumption expenditure in column 5 (row 7) increases relative to column 4, but is largely satisfied by a deterioration in the trade balance (row 1), rather than by an increase in domestic production (row 6). The higher level of domestic demand simply generates more inflationary pressure which further reduces the international competitiveness of domestically produced goods. Concluding Remarks This paper has shown that assumptions can be critical in determining the results that ORANI produces in studies of the aggregate effects of immigration. The three studies under investigation made assumptions which were generally favourable to immigration and the model's results were generally favourable. By changing these assumptions within plausible limits, the results of the studies could be reversed. Far from being a weakness, this is a strength of ORANI as it indicates to policy makers the conditions under which immigration can be expected to yield favourable or unfavourable economic outcomes. If policy makers are to make informed decisions, they must be aware of the options.. 4. In the simulations reported in Table 2, the capital accumulation relationship linking investment and capital growth in ORANI-F is discarded and both capital and investment are determined exogenously as in the CIE-BIR version of ORANI..
(11) 8. Matthew W. Peter. References Ackland, R. and L. Williams (1992), Immigration and the Australian Labour Market: The Experience of Three Recessions, AGPS, Canberra. Baker, L. (1985), 'The ORANI Simulations', Ch. 9 in Norman, N. and K. Meikle eds., The Economic Effects of Immigration. Vol. 2, CEDA, P Series no. 27, Melbourne. Blampied, C.W. (1985), 'A Listing of the 1977-78 Balanced ORANI Data Base with the Typical-Year Agriculture Sector Implemented', Impact Project Research Memorandum ORANI Database, Melbourne. Chapman, B., D. Pope and G Withers (1985), 'Immigration and the Labour Market', ch. 4 in Norman N. and K. Meikle eds., The Economic Effects of Immigration on Australia. Vol. 2, CEDA, P Series no. 27, Melbourne. CIE (1988), "The Relationship Between Immigration and Economic Performance", in Immigration: A Commitment to Australia: Consultant's Reports, The Committee to Advise on Australia's Immigration Policies, AGPS, Canberra. CIE (1990), Immigration, Trade and Capital Flows, AGPS, Canberra. Gujarati, D. (1988) Basic Econometrics 2nd ed., McGraw-Hill. Meikle, K. (1985), 'Industry Structure, Investment, Scale Economies and Technology", Ch. 7 in Norman N. and K. Meikle eds., The Economic Effects of Immigration on Australia. Vol. 2, CEDA, P Series no. 27, Melbourne. Parmenter, B.R. (1990), "The Economics of Immigration', Economic Papers, 9, 2, pp39-50. Parmenter, B.R. and M.W. Peter, (1991), 'A Reinterpretation of the CIE Projections of the Long-Run Economic Effects of Immigration', Economic Record, 67, 199, pp331-337. Peter, M.W. (1991), 'Some Economic Consequences of Changes in the Size and Composition of the Australian Population: Immigration, Ageing and Scale Economies', in National Population Council ed., Population Issues and Australia's Future, AGPS, Canberra. Pratten, C (1989), "A Survey of the Economies of Scale", chapter 2 in Commission of the European Communities, Research on the Cost of NonEurope. Basic Findings. Vol. 2. Luxembourg. Withers, G. and D. Pope (1984), 'Post-war Immigration and Australian Unemployment', Working Papers in Economic History. No. 24, Department of Economic History, ANU, Canberra. Withers, G. and D. Pope (1985), 'Immigration and Unemployment', Economic Record, 61, 173, pp554-563. Wooden, M. (1990), 'The Economic Impact of Immigration', ch. 3 in Wooden, M., R. Holton, G. Hugo and J. Sloan eds., Australian Immigration: A Survey of the Issues, AGPS, Canberra..
(12)
Figure
Related documents
A high intake of milk more than doubled fasting serum insulin concentrations, which caused the relative insulin resistance to increase similarly, as there was no increase in
This systematic review of the literature on willingness to pay for social and community-based (non-commercial) health insurance in low- and middle income countries has shown that
Baseline experiment here is the Resnet50 when it is trained by using only Camelyon16 dataset. As shown in Fig. 4, predicting domain specific tasks as pretext tasks in the pro-
Till 2005, State Life Insurance Corporation (SLIC) and National Insurance Company Limited (NICL) constituted 74% of the total insurance market. There are 5 life insurance
1) As there is little evidence of the merger in literature we answer “to what degree does Lean thinking and risk management thinking align?” Our method was to recast the principles
Not all pricers in a law firm are created equal, which is why I have been a strong proponent for years of firms establishing a pricing cartel, as well as appointing a Chief
The final project (I*Teach scenario) should be developed and presented to the other teams using the native PCM characteristics and components (competence development
In addition, we verify the respective contributions of these experienced soccer players according to their participation in the playoff match- es (i.e., STARTER, START/SUBST,
