LIU, QIANG. Fundamental Study and Method Development for Surface-based Laser Desorption Ionization Imaging Mass Spectrometry. (Under the direction of Lin He).
Fundamental Study and Method Development for Surface-based Laser Desorption Ionization Imaging Mass Spectrometry
by Qiang Liu
A dissertation submitted to the Graduate Faculty of North Carolina State University
in partial fulfillment of the requirements for the Degree of
Doctor of Philosophy
Chemistry
Raleigh, North Carolina February 25, 2009
APPROVED BY:
Lin He Morteza G. Khaledi Assistant Professor, Chemistry Professor, Chemistry Chair of Advisory Committee
Dedication
To my wife Wei Yue, my lovely daughters Joanna and Judy, my parents Huanxin Liu and
Weijun Fan, my parents-in-law Jun Yue and Ruling Liu, and my brothers and sisters
Yong Liu, Dan Gao, Qing Yue, and Yan Kou, I appreciate all of your love,
Biography
Born: October 14, 1973, Jinan, Shandong, China Parents: Weijun Fan and Huanxin Liu
Siblings: Yong Liu and Dan Gao
Married: September 25, 1998 Spouse: Wei Yue
Daughters: Joanna Y Liu and Judy Y Liu Parents-in-law: Ruling Liu and Jun Yue Siblings-in-law: Qing Yue and Yan Kou
Acknowledgments
My advisor, Professor Lin He, provided guidance, patience, and financial support
during my graduate studies. North Carolina State University Department of Chemistry
and Canon, Inc also provided financial support.
Dr. Zhong Guo, Yongshen Xiao, Yu Chiu, Coral Pagan-Miranda and John F.
Cahill also contributed on the imaging mass spectrometry (IMS) project. Weiming Zheng
helped with IMS software installation and upgrade. Dr. Hirokatsu Miyata and Mr.
Kimihiro Yoshimura contributed to the development of titania substrate.
I would like to thank Dr. Michael Dykstra for training me the preparation of
frozen tissue section. I appreciate Dr. Gary M. Pollack, Dr. Jeannie Padowski, Dr. Wei
Yue and Ms. Welker for providing mice tissue samples. I am also thankful to Dr. Markus
Stoeckli for the help with MS imaging software. I would like to acknowledge Mr. Fred
Stevie and Mr. Matthew M. Lyndon for the help with MS data collection. I thank Drs.
Ade’s and Feldheim’s groups for the usage of optical microscopes.
I also thank the other former and current members of the He group, Nancy Finkel,
Amel Ganawi, Abhilasha Shah, Fredrick Jaeger, Peng He, Geoffrey Okelo, Mark Eckert,
Hong Qian and Yafeng Wu.
The members of my committee made suggestions and comments during my
graduate studies. These faculty members are Professors Edmond F. Bowden, Morteza G.
Khaledi and David C. Muddiman. The graduate school representative is Professor Peter
I would also like to acknowledge all the teachers and professors during my
educational journey that helped me get to this point today. I am grateful to my fellow
graduate students and postdocs within the department, especially the Gorman group.
Members of the support staff provided prompt assistance with regard to
equipment repairs and administrative matters. These persons include Mr. Eddie Barefoot,
Mr. Alan Harvell, Ms. Brenda Burgess and Ms. Maria D. Moreno.
Finally, I’d like to sincerely thank all my family and friends. I am indebted to my
parents and parents-in-law, who have been taking care of my daughters since they were
born with their love and patience. Without the support and love from them, I would not
have been able to successfully finish the Ph.D. program. I am very grateful to all
brothers and sisters in Chapel Hill Chinese Christian Church. My wife and I will always
remember your love and support when Joanna and Judy were born.
Table of Contents
List of Tables ... viii
List of Figures... ix
List of Schemes... xii
Chapter 1: Introduction... 1
1.1.Matrix Assisted Laser Desorption Ionization (MALDI) ... 1
1.2.Surface Assisted Laser Desorption Ionization (SALDI) ... 7
1.3.Two-Dimensional Imaging Mass Spectrometry (IMS) ... 10
1.4.Research Overview... 13
1.5.References... 14
Chapter 2: Mass Spectrometry Imaging of Small Molecules Using DIOS ... 19
2.1.Introduction... 19
2.2.Experimental Section... 21
2.3.Result and Discussion... 25
2.4.Conclusion ... 37
2.5.References... 38
Chapter 3: Quantification of Environmental Factors in DIOS ... 41
3.1.Introduction... 41
3.2.Experimental Section... 41
3.3.Result and Discussion... 43
3.4.Conclusion ... 57
Chapter 4: Metabolite Imaging Using Matrix-Enhanced Surface-Assisted Laser
Desorption Ionization Mass Spectrometry (ME-SALDI-MS)... 60
4.1.Introduction... 60
4.2.Experimental Section... 62
4.3.Result and Discussion... 66
4.4.Conclusion ... 81
4.5.References... 81
Chapter 5: Ionic Matrix for Matrix-Enhanced Surface-Assisted Laser Desorption Ionization Imaging Mass Spectrometry (ME-SALDI-IMS)... 84
5.1.Introduction... 84
5.2.Experimental Section... 86
5.3.Result and Discussion... 90
5.4.Conclusion ... 99
5.5.References... 99
Chapter 6: Ordered Mesoporous Titania Film in Matrix-Enhanced Surface-Assisted Laser Desorption Ionization Imaging Mass Spectrometry (ME-SALDI-MS) ... 102
6.1.Introduction... 102
6.2.Experimental Section... 104
6.3.Result and Discussion... 107
6.4.Conclusion ... 114
List of Tables
Table 2.1 Calculated RSD% of the molecular ion peak of DTMA detected atop DIOS or 50 nm mouse liver tissue... 31
Table 3.1. Calculated proton donating effectiveness of the solvent ... 46
Table 3.2. Calculated proton donating effectiveness of the surface... 51
Table 5.1. Calculated Relative Standard Deviation (RSD%) of UV Absorbance of
Sublimation-coated Matrix Thin Film at 337 nm ... 94
List of Figures
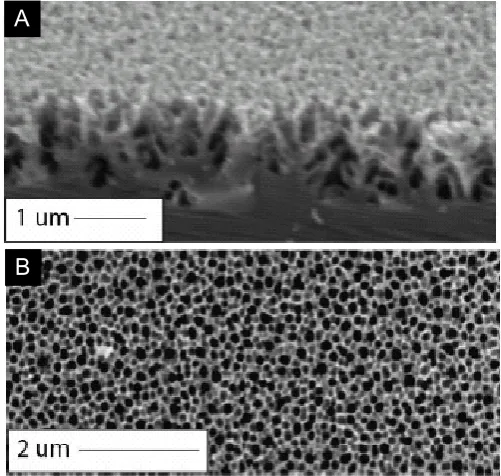
Figure 1.1. (A) Cross section and (B) top view of SEM image of porous silicon... 9
Figure 2.1. Optical microscopic images of laser footprint and a plot of laser spot sizes as a function of laser radiation energy and the pinhole open sizes. ... 26
Figure 2.2. Optical images of patterned laser burn marks on the DIOS substrates with a stage moving step of (A) 30 μm and (B) 20 μm. ... 29
Figure 2.3. DIOS mass spectra of des-Arg-Bradykinin, Angiotensin I, reserpine and Bradykinin atop detected atop of 50-nm thick mouse liver tissue or directly atop of the DIOS substrate, respectively... 30
Figure 2.4. (A) A DIOS spectrum and (B) the chemical structure of DPPC; (C) an optical image of a reference copper grid on top of a DIOS substrate; and (D) the corresponding reconstructed ion imaging of the DPPC... 33
Figure 2.5. A typical TEM image of a stained mouse liver tissue section. ... 34
Figure 2.6. The reconstructed ion maps collected from a mouse liver tissue
section. ... 35
Figure 2.7. (A) An optical image and (B) the corresponding MS ion map of HEK 293 cells grown on the DIOS... 36
Figure 2.8. (A) Optical and (B) fluorescence images of HEK 293 cells; (C) a typical mass spectrum and (D) overlaid ion maps of PC and PI fragments
collected from HEK 293 cell detection... 37
Figure 3.1. Mass spectra of TEA collected from a DIOS substrate (A) immersed in a TEA/H2O solution, (B) immersed in a TEA/D2O solution, (C) re-loaded
with ethanol, and (D) reloaded with D2O again... 44
Figure 3.2. The calculated RIs of [M+2]+ peaks plotted as a function of storage
time of the substrates s under 2×10⁻⁷ Torr. ... 47
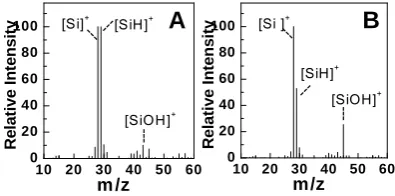
Figure 3.3. SIMS mass spectra of (A) a HF-rinsed DIOS substrate and (B) a H2O2-modified DIOS substrate... 55
Figure 3.4. Mass spectra of (A) DPPC in methanol solution from unmodified DIOS, and (B) DPPC in 2,4-pentadione/methanol from an oxidized DIOS. ... 56
Figure 4.2. MS spectra of DMPC collected with (A) ME-SALDI, (B) MALDI and (C) SALDI... 67
Figure 4.3. (A) MSE scores for DMPC detection using MALDI and ME-SALDI; (B) Survival yields of DMPC molecular ion using MALDI, ME-SALDI and
SALDI... 68
Figure 4.4. A representative MS spectrum of insulin (m/z=5734.6) and
thioredoxin (m/z=11674.5) using ME-SALDI-MS. ... 70
Figure 4.5. A standard solution of three amino acids (valine, aspartic acid and
phenylalanine) with CHCA in 1:1:1:3 molar ratios were examined by MALDI and ME-SALDI... 72
Figure 4.6. MS spectra of CHCA collected under the same MS conditions in (A) ME-SALDI and (B) MALDI in a negative mode... 73
Figure 4.7. Signal intensities of the DMPC molecular ion using (A) MALDI and (B) ME-SALDI MS. (C) The MSE scores of DMPC detection using MALDI and ME-SALDI. (D) The survival yield of DMPC molecular ion using ME-SALDI. ... 74
Figure 4.8. The signal intensity of L-lysine detected from the tissue atop of (A) a porous silicon substrate in ME-SALDI and (B) the flat silicon in MALDI... 76
Figure 4.9. Representative spectra, optical image and reconstructed 2-D images
collected from a mouse heart tissue section using MALDI and ME-SALDI. ... 77
Figure 4.10. Optical images, representative MS spectra and reconstructed 2-D ion images of mouse cerebrum and cerebellum sections... 79
Figure 5.1. Reconstructed 2-D images for ions at m/z=155.0 (A) and 104.1(B) for a garlic tissue. (C) Signal intensities and normalized signal intensities of analytes from DHB-coated chicken liver sections were plotted against the
absorbance of DHB... 91
Figure 5.2. Optical images of sublimated (A) solid ionic matrix (CHCA/ANI) layer and (B) conventional matrix (DHB) layer. Representative UV-Vis spectra of (C) CHCA/ANI layer and (D) DHB layer collected before and after
vacuum storage. ... 93
Figure 5.3. Representative spectra of quinidine collected with (A) CHCA/ANI using MALDI, (B) CHCA/ANI contained 0.1% TFA using MALDI and (C)
Figure 5.4. The usage of solid ionic matrix without acidic additive in complex biological sample was also examined through the detection of garlic extracts using (A) ME-SALDI and (B) MALDI... 97
Figure 5.5. Optical image and reconstructed 2-D ion images collected from garlic sections with CHCA/ANI using ME-SALDI IMS. ... 99
Figure 6.1. SEM images of titania film and porous silicon. ... 108
Figure 6.2. Representative spectra of insulin were collected from the titania film
prepared under different conditions. ... 109
Figure 6.3. The Representative ME-SALDI MS spectrum on titania mesoporous film prepared with different surfactants (A) P123, (B) F127 and (C) F108. ... 110
Figure 6.4. (A) Representative spectrum and (B) calibration curve for Atenolol.
Representative spectrum of peptides (C) mixture 1 and (D) mixture 2... 111
Figure 6.5. Representative spectrum of bradykinin using (A) freshly prepared titania film, (B) titania film after 10-months storage, (C) fresh prepared porous Si and (D) porous Si after one-day exposure in air... 112
Figure 6.6. Optical image, reconstructed ion maps and representative spectrum
List of Schemes
Scheme 1.1 Schematic drawing of MALDI ionization Source... 1
Scheme 1.2 Schematic drawing of Time-of-flight mass analyzer ... 2
Scheme 2.1 Schematic drawing of 2-D DIOS imaging ... 25
Scheme 5.1 Competitive reaction of TFA with solid ionic matrix CHCA/ANI... 96
Chapter 1 Introduction
1.1Matrix Assisted Laser Desorption Ionization (MALDI)
The use of organic acids as matrix in laser desorption ionization, so-called MALDI, dramatically softens and facilitates the desorption/ionization process of analyte. Therefore, the detectable mass range has been extended to hundreds of thousand (even millions in certain cases) Dalton and the low limit of detection (LOD) routinely reached the low femtomole to attomole range. MALDI, along with electrospray, has
revolutionized the use of mass spectrometry in biological science and material sciences. Their applications have expanded to forensics, genomics, proteomics, most recently metabolomics and beyond.1-5 For instance, MALDI-based peptide mass fingerprint analysis has become one of the primary high-throughput protein identification methods.6 The application of MALDI MS in targeted detection of neuropeptide families within single cells has led to the discovery of over 400 invertebrate neuropeptides.7
Extraction voltage Laser
Matrix
Analyte Scheme 1.1. Schematic drawing of MALDI ionization source
R R R R R R R R R R R R R R R R R R R R R R R R R R R R R R R R R R R Extraction voltage Laser Matrix Analyte Scheme 1.1. Schematic drawing of MALDI ionization source
R R R R R R R R R R R R RR
R R R R R R R R R R R R R R R R R R R R R R R R R R R
R RR
R R R R R R R R R R R R R R R R R
R RR
Scheme 1.1 describes a simplified outline of a MALDI ionization source: the analyte is co-crystallized with an organic matrix before depositing on a solid support.
Upon irradiated by a pulsed laser beam, the analyte molecule desorb to the gas phase, along with matrix molecules, and ionize. The charged analyte molecules are extracted into the mass analyzer by a high voltage and their chemical nature are analyzed based on their mass-to-charge ratios. The MALDI ion sources are catogorized into UV-MALDI or
IR-MALDI based on the equipped laser and the matrice to be used varied accordingly. The research and discussion will be focused on the use of N2 lasers (337 nm) in this thesis. Li nea r det e c to r R e fle c tin g d e te c to r S a m p le Extraction Voltage (V)
Drift tube (length L)
Scheme 1.2. Schematic drawing of time-of-flight mass analyzer
Li nea r det e c to r R e fle c tin g d e te c to r S a m p le Extraction Voltage (V)
Drift tube (length L)
Li nea r det e c to r R e fle c tin g d e te c to r S a m p le Extraction Voltage (V) Li nea r det e c to r R e fle c tin g d e te c to r S a m p le Extraction Voltage (V)
Drift tube (length L)
Scheme 1.2. Schematic drawing of time-of-flight mass analyzer
Various mass analyzers have been successfully interfaced with MALDI-MS. Time-of-flight (TOF) mass analyzer is the most widely used one and is used in this thesis.
sensitive.8 As shown in Scheme 1.2, species of different mass-to-charge ratios exhibit different velocities when they travel inside of the vacuum tube. This difference in the
initial velocity allows ions to arrive the detector at different time and to be differentiated. Techniques such as delayed extraction, reflectron detector and orthogonal extraction/acceleration have been developed to significantly improve the resolving power of the TOF analyzer.9,10 Additional mass analyzers, such as FT-ICR allow analyte detection of sub part-per-million (ppm) mass accuracy and triple quadrupole enable quantitative analysis of pharmaceutical compounds in a sensitive, high-throughput, and inexpensive fashion.11-14
The selection of proper matrix and sample preparation method is crucial for a
successful MALDI experiment. An aromatic carboxylic acid moiety with a strong absorption coefficient at 337 nm is the common structure shared among most UV-MALDI matrices. It is worth pointing out that the selection of suitable matrix is still a very much empirical task due to the insufficient understanding of their structural roles in
MALDI. Compounds with similar chemical structures, such as 2,5-DHB and 3,5-DHB, have been found to behave with stark differences in MALDI experiments.15
Although the detail mechanism of MALDI is still under debate, matrix is believed serving both as a photon trap and a proton donor in the MALDI process. Systematic
matrix selection. Several theoretical models have been suggested to explain the MALDI process, including thermal desorption of molecules, surface layer by layer sublimation
and volume ablation.17-19 A more complex and mixed process was also reported and was believed to be one step closer to the truth.20 Briefly, analyte molecules are believed to be surrounded by matrix molecules and isolated from each other in the matrix/analyte co-crystal structure. When a laser is fired on co-co-crystals, matrix molecules absorb the photon energy and convert it to thermal/mechanic energy. The local temperature of
co-crystals could raise up to 600 ℃ within nanoseconds. When the input rate of photon
energy is significant larger the energy consuming rate (thermal energy diffusion, matrix melting, matrix evaporation/sublimation, stress relaxing and so on), volume ablation
would then occur through phase explosion. During the subsequent sublimation (thermal) /spallation (mechanical) the matrix molecules carry the analyte molecules into the gas phase and protect them from destructive heating.
The ionization process in MALDI could be roughly divided into two stages:
primary ion formation and secondary ion formation.16 The primary ions are directly generated from neutral molecules in condense phase, which are generally matrix ions. Formation of free ions directly from neutral molecules is energetic challenging. Several theoretical models have been proposed for the primary ions formation in MALDI process. For examples, Hillenkamps et al suggested the formation of matrix radical ions
where direct deposition of three N2 photons (3.68 eV each) is required to overcome the ionization energy barrier. An energy pooling model has also been proposed that suggests
multiple excited matrix molecules pool all energy together to generate one matrix radical ion, by which the energetic barrier would be much lower for primary ion formation.22 Preformed ion during sample preparation is another possible source for primary ions since the formation of ions in solution is easier.22 However, the charge separation of pre-existing ions from their counter ions also needs high energy input, as high as 4.8 eV for
separating Na+Cl-. Last but not the least, primary ions can be formed during thermal desorption when the local temperature of matrix crystal raises rapidly during laser irradiation.23 Complex and mixed pathways leading to primary ion formation likely happened in parallel during actual MALDI experiments.
Secondary ions are generated through charge (proton) transfer between matrix-matrix and matrix-matrix-analyte in the MALDI plume (gas phase). It is widely accepted that a high density plume is generated, where proton transfer through collision is possible.16 In a typical MALDI experiment, a thermal equilibrium could be reached for ion and
ion-molecule interaction. For instance, a linear correlation between ion intensities of amino acids with their gas phase basicities has been reported, supporting the suspected equilibrium for proton transfer in gas phase.24 Gas-phase based secondary ionization also explains the dominant observation of singly charged ions, protonated or deprotonated, in MALDI because large excess of electrons/protons in MALDI plume could easily
to present only a very small fraction of total desorbed molecules further corroborates its importance.26 An interesting and useful phenomenon, called matrix suppression effect, has been well explained by the secondary ion reaction in plume where the matrix signal could be dramatically suppressed by the analyte signal at certain matrix to analyte ratio.22,27 Analytes with high gas phase basicity would deplete protons from matrix ions and result in significant decrease of matrix signal. Similar suppression was also commonly observed between analytes with different gas phase basicity in the detection
complex sample using MALDI MS.
Regardless exact roles played by matrix molecules during MALDI-MS remains elusive, their importance in enhancing desorption/ionization efficiency of analytes is without a doubt. However, the employment of matrix molecules raises several issues that
may adversely impact MALDI applications. Dried-droplet method is a routinely used
sample preparation method, where matrix and analyte are pre-mixed in an acidic aqueous or organic solution. The concentration of matrix is typically thousands of times higher than the concentration of analyte. The analyte/matrix solution is then loaded onto a
MALDI target and co-crystallized together. Improved detection has been reported by using fast evaporation technique, where concentrated matrix solution in volatile organic solvent is loaded onto MALDI target first.29-32 The analyte solution is then loaded and co-crystallized only with the top thin matrix layer, by which the analyte could be more
from different spots of same sample, so called sweet spot phenomenon, by which the reproducibility and quantification capability of MALDI-MS could be significant
impaired.28 This results in a poor spot-to-spot reproducibility, an extended analysis time and a poor performance in quantitative analysis. A new class of matrix has been developed by mixing conventional MALDI matrix with one equivalent organic base, so called ionic matrix, which provides uniform crystal film and have been demonstrated as
an attractive approach in quantitative analysis using MALDI MS.6,33-36
Another drawback of using matrix is the strong noise background caused by the matrix signal interferes with analyte at low mass range. Great efforts have been made to improve the MALDI detection of small molecules, where matrix additives (such as amino
compounds and ammonium salts) are most commonly used approach for suppressing matrix signals.37,38 Binary matrix by mixing two matrices of different basicity has been successfully applied in the detection of small bio-molecules.39 Matrix has also been incorporated into silica so-gel to reduce the overlapping of matrix signal with low mass analyte. Matrix with higher molecular weight has been synthesized in order to shift the
background noise in to higher mass range. Nevertheless the success is still very limited in the analysis of complex small molecules mixture such as metabolite.
1.2Surface Assisted Laser Desorption Ionization (SALDI)
low-mass bioactive compounds. Surface-assisted laser desorption ionization mass spectrometry (SALDI-MS) is a matrix-free Laser Desorption/Ionization (LDI) technique,
which was developed in parallel to well-known MALDI-MS. SALDI-MS was first demonstrated using a suspension of 30-nm cobalt particles in glycerol as the matrix, resulting in detection of proteins with masses greater than 20,000 Dalton.40 Since then different materials have been tested as potential SALDI substrates, including graphite,
carbon nanotubes, Au, Sn, Si, TiO2 nanoparticles, etc.41-45 In addition, the use nanoparticles with or without affinity capping agents could combine the sample purification, analyte enrichment and detection into one single step, which significantly simplifies the sample preparation and improves the detection.42,46-48 The most successful SALDI medium was reported by Siuzdak et al. in which porous Si was used. The approach is also known as Desorption Ionization on Silicon Mass Spectrometry (DIOS-MS), which has been successfully employed in DIOS-MS to profile metabolites, identify active drug components, monitor organic synthetic products, and image small molecules
in biological sample.49-55 Figure 1.1 displays the scanning electron microscopy (SEM) image of porous silicon substrates, where typical pore size is about 50-200 nm. Inspired by the success of DIOS, liquid initiator compounds was developed and absorbed into porous silicon, by which significantly improvement in the MS performance was achieved
in a means of detectable mass range and detection sensitivity. 56,57
In SALDI, the analyte was directly loaded onto (or mixed with) the SALDI surface/particle without addition of organic matrix. Elimination of matrix molecules in
biologically significant small molecules (MW<500). The fact that most SALDI experiment could be easily performed on any conventional MALDI instrument makes it
an attractive alternative to SIMS, another low-mass molecule detection method.
In general, the low limit of detection (LOD) of SALDI is in the low picomole to femtomole range, which is not as sensitive as MALDI. Lack of fundamental
understanding in desorption and ionization processes of SALDI-MS is the primary cause behind this unsatisfied MS performance. Several groups have initiated the efforts and have proposed the contribution from substrate surface morphology, porosity or roughness to analyte ionization.58-62 The surface chemical properties of porous substrates have also been investigated, which are found to affect ionization threshold but not on molecular fragmentation. Surface derivitization has been applied to change the wet-ability of a
A
B
surface to selectively concentrate target molecules, to extend substrate stability by surface passivation, and in some cases, to provide protons. Cleaner MS spectra have also been
collected from modified surfaces with little background signals, thus better signal-to-background ratios obtained. However, continuous study, especially on quantitative characterization of the contribution from each physical and chemical parameters involved in DIOS/SALDI is imperial to make the matrix-free MS method competitive in small
molecule detection.
1.3Two-Dimensional Imaging Mass Spectrometry (IMS)
By providing both the chemical identities and the spatial organization of each
component on a surface, chemical Imaging Mass Spectrometry (IMS) has created new research opportunities in many fields, such as microelectronics, materials science, and geochemistry.63 For instance, the imaging secondary ion mass spectrometry (SIMS) has become a standard method in the elementary analysis of various surfaces since the
commercialization of instrument in 1960’s. New developments in mass spectrometry have dramatically extended the detectable mass range and have enabled the applications of IMS to clinic and pharmacological studies. Comparing to the optical imaging techniques commonly used in medical fields, IMS can track multiple species
simultaneously and unveil unknown species involved in cellular communication without the requirement of tagging optically distinctive labels to the molecules of interest. Molecular specific information can be obtained and parent compound can be
radio-autographic images. IMS is normally conducted in a point-to-point scanning fashion where a laser beam rasters across a sample surface with a MS spectrum collected at each
point. Later reconstruction of the 2-D ion maps of the molecules of interest reveals their spatial distributions and the local concentrations.
MALDI-IMS has shown unique advantages in biomarker discovery and become the major player among IMS techniques since Capriole et al. pioneered the use of
MALDI-IMS in 1996.64-66 Most work in MS imaging has been focused on protein and peptide mapping in biological tissue samples to take advantages of effective analyte ionization using MALDI-MS, and also partially due to the limitation of MALDI-MS in small molecules detection as discussed in previous section. Great efforts have been made
to improve analysis of small molecules with MALDI IMS. For example, with careful selection of appropriate matrix systems, pharmaceutically compounds with known structures have been profiled and imaged to study metabolite activity and drug efficacy.67,68 Application of high resolving power MALDI FT-ICR instrument and tandem mass spectrometry MS/MS have also been demonstrated in small bio-molecules imaging.69-71 However, success is still limited in imaging complex unknown small molecule mixtures, such as metabolites in biological sample.
From the practical aspect, sample preparation for IMS experiment, including the
different matrix crystal sizes or different matrix to analyte ratios, homogeneous matrix deposition is another critical factor to minimize distortion in analyte spatial distribution.
Automated dropping and electro-spray are two commonly used matrix deposition approach, where potential redistribution of analyte is the major concern for all solution based methods.72,73 Therefore, a solvent free approach, homogeneous matrix deposition through sublimation, has shown great potential in the IMS analysis of small molecule attracted great research interest by completely eliminates the possibility of
redistribution.74
In recent years, serious research efforts from both industry and academia have been devoted to improving the imaging interface of MALDI-MS instruments. For instance, the equipped laser foot-print has been reduced to 20 μm with the precision of
translation stage movement has reached <5 μm in routine operation. Sherrod et. al. have demonstrated the use of digital micromirror device (DMD) in imaging MALDI-MS that exhibits great potentials in improving imaging spatial resolution, laser homogeneity and throughput.75 Imaging specific software for hardware control and data analysis have been developed for all major MALDI instruments since a huge number of spectra (tens of thousand) would be collected during imaging experiment.
Since its first demonstration in 1999, DIOS has opened the opportunities of
SIMS, direct adoption of the MALDI-MS interface in DIOS imaging reduces the instrument cost associated with SIMS imaging, especially when the use of cluster beams
is required. Therefore, this dissertation is devoted to a systematic study and method development for DIOS-based IMS techniques.
1.4Research Overview
This dissertation entails my effort in understanding the mechanism behind
SALDI-MS technique and employing it as a complementary approach to MALDI-MS for 2-D small biomolecules mass spectrometry imaging. Chapter 1 describes the concept-proof investigation on using SALDI-MS to image mouse liver tissues and HEK 293
cancer cells. Basic imaging parameters, such as the laser footprint and the stage movement, on the quality of DIOS imaging, have also been studied.
To further improve the detection sensitivity, the fundamental understanding of ionization mechanism of SALDI is conducted. In Chapter 2, I have shown a systematic
investigation of proton transferring pathways by using deuterated chemical reagents as a MS-distinctive tag and have semi-quantitatively assesses contributions from the local chemical environment surrounding analytes.
Based on the finding on the SALDI mechanism, a hybrid ionization approach has
matrix-analyte interference and the improved imaging capability through analysis of mouse brain and heart sections.
To further improve the performance of ME-SALDI in imaging-based applications, the impact of vacuum stability of matrix was investigated in Chapter 4. Experimental conditions for sublimation deposition of several matrix molecules were systematically studied and the results rationalized. Improved vacuum stability has been reported for
sublimation-coated ionic matrix. Employment of ionic matrix in ME-SALDI IMS has been successfully demonstrated and an improved MS detection of small molecules was observed in comparison to conventional MALDI using.
Last but not the least, Chapter 5, a new generation of meso-porous oxide substrate
was developed as a novel ME-SALDI substrate through collaborations with Canon. Preliminary results show it exhibiting benefits of providing a superior storage stability, extended detectable mass range and robust substrate preparation.
1.5References
(1) Dunn, J. D.; Allison, J. J. Forensic Sci. 2007, 52, 1205-1211.
(2) Ragoussis, J.; Elvidge, G. P.; Kaur, K.; Colella, S. PLoS Genet 2006, 2, e100. (3) Nakazawa, T.; Yamaguchi, M.; Okamura, T.-A.; Ando, E.; Nishimura, O.;
Tsunasawa, S. Proteomics. 2008, 8, 673-685.
(4) Rainer, M.; Najam-ul-Haq, M.; Huck, C. W.; Vallant, R. M.; Heigl, N.; Hahn, H.; Bakry, R.; Bonn, G. K. Recent Pat. Nanotechnol. 2007, 1, 113-119.
(5) Szpunar, J. Analyst. 2005, 130, 442-465.
(7) Hummon, A. B.; Sweedler, J. V.; Corbin, R. W. TrAC Trends Analyt. Chem. 2003, 22, 515-521.
(8) Doig, M. V.; Higton, D. M. Princ. Pract. Bioanal. (2nd Ed.) 2008, 193-222. (9) Uphoff, A.; Grotemeyer, J. Eur. J. Mass Spectrom. 2003, 9, 151-164. (10) Vestal, M. L. NATO ASI Ser., Ser. C 1997, 504, 239-262.
(11) Peters, E. C.; Brock, A.; Phung, Q.; Fitchett, J.; Horn, D. M.; Ericson, C.; Ficarro, S. B.; Salomon, A. R. Am. Pharm. Rev. 2002, 5, 72, 74, 76, 78, 80-81.
(12) Jing, L.; Li, C.; Wong, R. L.; Kaplan, D. A.; Amster, I. J. J. Am. Soc. Mass Spectrom. 2008, 19, 76-81.
(13) van Kampen, J. J. A.; Burgers, P. C.; Gruters, R. A.; Osterhaus, A. D. M. E.; de Groot, R.; Luider, T. M.; Volmer, D. A. Anal. Chem. 2008, 80, 4969-4975. (14) Gobey, J.; Cole, M.; Janiszewski, J.; Covey, T.; Chau, T.; Kovarik, P.; Corr, J.
Anal. Chem. 2005, 77, 5643-5654.
(15) Yassin, F. H.; Marynick, D. S. J. Phys. Chem. A 2006, 110, 3820-3825. (16) Knochenmuss, R. Analyst 2006, 131, 966-986.
(17) Johnson, R. E. Inter. J.Mass Spectrom. Ion Proc. 1994, 139, 25-38.
(18) Akos Bencsura, V. N. M. S. A. V. Rapid Commun. Mass Spectrom. 1997, 11, 679-682.
(19) Knochenmuss, R.; Zhigilei, L. V. J.Phys. Chem. B 2005, 109, 22947-22957. (20) Dreisewerd, K. Chem. Rev. 2003, 103, 395-426.
(21) Ehring, H.; Karas, M.; Hillenkamp, F. Org. Mass Spectrom. 1992, 27, 472-480. (22) Knochenmuss, R.; Dubois, F.; Dale, M. J.; Zenobi, R. Rapid Commun. Mass
Spectrom. 1996, 10, 871-877.
(23) Fujii, T. Eur. Mass Spectrom. 1996, 2, 91-114.
(24) Kinsel, G. R.; Yao, D.; Yassin, F. H.; Marynick, D. S. Eur. J. Mass Spectrom. 2006, 12, 359-367.
(26) Curtis D. Mowry, M. V. J. Rapid Commun. Mass Spectrom. 1993, 7, 569-575. (27) McCombie, G.; Knochenmuss, R. Anal. Chem. 2004, 76, 4990-4997.
(28) Tholey, A.; Heinzle, E. Anal. Bioanal. Chem. 2006, 386, 24-37.
(29) Koomen, J. M.; Russell, W. K.; Hettick, J. M.; Russell, D. H. Anal. Chem. 2000, 72, 3860-3866.
(30) Dai, Y.; Whittal, R. M.; Li, L. Anal. Chem. 1999, 71, 1087-1091.
(31) Nicola, A. J.; Gusev, A. I.; Proctor, A.; Jackson, E. K.; Hercules, D. M. Rapid Commun. Mass Spectrom. 1995, 9, 1164-1171.
(32) Vorm, O.; Roepstorff, P.; Mann, M. Anal. Chem. 1994, 66, 3281-3287.
(33) Samuel Carda-Broch, A. B. D. W. A. Rapid Commun. Mass Spectrom. 2003, 17, 553-560.
(34) Fukuyama, Y.; Nakaya, S.; Yamazaki, Y.; Tanaka, K. Anal. Chem. 2008, 80, 2171-2179.
(35) Laremore, T. N.; Zhang, F.; Linhardt, R. J. Anal. Chem. 2007, 79, 1604-1610. (36) Armstrong, D. W.; Zhang, L.-K.; He, L.; Gross, M. L. Anal. Chem. 2001, 73,
3679-3686.
(37) Asara, J. M.; Allison, J. Anal. Chem. 1999, 71, 2866-2870. (38) Kjellstrom, S.; Jensen, O. N. Anal. Chem. 2004, 76, 5109-5117. (39) Guo, Z.; He, L. Anal. Bioanal. Chem. 2007, 387, 1939-1944.
(40) Koichi Tanaka, H. W., Yutaka Ido, Satoshi Akita, Yoshikazu Yoshida, Tamio Yoshida, T. Matsuo, Rapid Commun. Mass Spectrom. 1988, 2, 151-153. (41) Su, C.-L.; Tseng, W.-L. Anal. Chem. 2007, 79, 1626-1633.
(42) Chen, C.-T.; Chen, Y.-C. Anal. Chem. 2005, 77, 5912-5919.
(43) Hoang, T. T.; Chen, Y.; May, S. W.; Browner, R. F. Anal. Chem. 2004, 76, 2062-2070.
(45) Sunner, J.; Dratz, E.; Chen, Y.-C. Anal. Chem. 1995, 67, 4335-4342. (46) Kailasa, S. K.; Kiran, K.; Wu, H.-F. Anal. Chem. 2008, 80, 9681-9688. (47) Shrivas, K.; Wu, H.-F. Rapid Commun. Mass Spectrom. 2008, 22, 2863-2872. (48) Chiu, T.-C.; Huang, L.-S.; Lin, P.-C.; Chen, Y.-C.; Chen, Y.-J.; Lin, C.-C.; Chang,
H.-T. Recent Pat. Nanotechnol. 2007, 1, 99-111.
(49) Wei, J.; Buriak, J. M.; Siuzdak, G. Nature 1999, 399, 243-246.
(50) Go, E. P.; Uritboonthai, W.; Apon, J. V.; Trauger, S. A.; Nordstrom, A.; O'Maille, G.; Brittain, S. M.; Peters, E. C.; Siuzdak, G. J. Proteo. Res. 2007
(51) Okuno, S.; Wada, Y. J. mass spectrum. 2005, 40, 1000-1004.
(52) Xu, S.; Pan, C.; Hu, L.; Zhang, Y.; Guo, Z.; Li, X.; Zou, H. Electrophoresis 2004, 25, 3669-3676.
(53) Budimir, N.; Blais, J.-C.; Fournier, F.; Tabet, J.-C. Rapid Commun. Mass Spectrom. 2005, 20, 680-684.
(54) Deng, G.; Sanyal, G. J. Pharm. Biomed. Anal. 2006, 40, 528-538.
(55) Kraj, A.; Jarzebinska, J.; Gorecka-Drzazga, A.; Dziuban, J.; Silberring, J. Rapid Commun. Mass Spectrom. 2006, 20, 1969-1972.
(56) Northen, T. R.; Lee, J.-C.; Hoang, L.; Raymond, J.; Hwang, D.-R.; Yannone, S. M.; Wong, C.-H.; Siuzdak, G. Proc. Nat. Acad. Sci. 2008, 105, 3678-3683. (57) Northen, T. R.; Yanes, O.; Northen, M. T.; Marrinucci, D.; Uritboonthai, W.;
Apon, J.; Golledge, S. L.; Nordstrm, A.; Siuzdak, G. Nature 2007, 449, 1033-1036.
(58) Alimpiev, S.; Nikiforov, S.; Karavanskii, V.; Minton, T.; Sunner, J. J. Chem. Phys. 2001, 115, 1891-1901.
(59) Luo, G.; Chen, Y.; Siuzdak, G.; Vertes, A. J. Chem. Phys. B 2005, 109, 24450-24456.
(60) Chen, Y.; Vertes, A. Anal. Chem. 2006, 78, 5835-5844.
(62) Alimpiev, S. S.; Nikiforov, S. M.; Karavanski, V. A.; Grechnikov, A. A.; Sunner, J. Proc.SPIE 2004, 5506, 95-106.
(63) Chaurand, P.; Schwartz, S. A.; Caprioli, R. M. Curr. Opin. Chem. Biol. 2002, 6, 676-681.
(64) Chaurand, P.; Schwartz, S. A.; Billheimer, D.; Xu, B. J.; Crecelius, A.; Caprioli, R. M. Anal. Chem. 2004, 76, 1145-1155.
(65) Caldwell, R. L.; Caprioli, R. M. Mol Cell Proteomics 2005, 4, 394-401. (66) Zhang, H.; Caprioli, R. M. J Mass Spectrom 1996, 31, 690-692.
(67) Rubakhin, S. S.; Greenough, W. T.; Sweedler, J. V. Anal. Chem. 2003, 75, 5374-5380.
(68) Chandra, S.; Tjarks, W.; Lorey, D. R., II; Barth, R. F. J. Microsc. 2007, 229, 92-103.
(69) Koestler, M.; Kirsch, D.; Hester, A.; Leisner, A.; Guenther, S.; Spengler, B. Rapid Commun. Mass Spectrom. 2008, 22, 3275-3285.
(70) Taban, I. M.; Altelaar, A. F. M.; van der Burgt, Y. E. M.; McDonnell, L. A.; Heeren, R. M. A.; Fuchser, J.; Baykut, G. J. Am. Soc. Mass Spectrom. 2007, 18, 145-151.
(71) Naito, Y.; Miyabayashi, K.; Tsujimoto, K. Int. J. Mass Spectrom. 2002, 221, 83-92.
(72) Aerni, H.-R.; Cornett, D. S.; Caprioli, R. M. Anal. Chem. 2006, 78, 827-834. (73) Altelaar, A. F. M.; Van Minnen, J.; Jimenez, C. R.; Heeren, R. M. A.; Piersma, S.
R. Anal. Chem. 2005, 77, 735-741.
(74) Hankin, J. A.; Barkley, R. M.; Murphy, R. C. J. Am. Soc. Mass Spectrom. 2007, 18, 1646-1652.
Chapter 2 Mass Spectrometry Imaging of Small Molecules
Using DIOS-MS
2.1 Introduction
More and more small biomolecules (MW<500) have been found to play important
roles in regulating cellular functions.1-4 Development of novel tools to map the distribution of these molecules in cells is imperative to probe spatial organization of intercellular processes and investigate signal transduction pathways. In spite of great strides being made in optical imaging techniques to directly visualize selected
biomolecules, the requirement in tagging optically distinctive labels to molecules of interest has limited their applications in unveiling unknown species involved in cellular communication and in tracking multiple species (>10) simultaneously. In this regard, mass spectrometry (MS) is an ideal tool that offers highly specific structural information
to discover unknown molecules involved in bioprocesses and provides a multiplexing capability to monitor concurrent molecular fluctuations in complex biological systems. Indeed, growing academic and commercial interest has been evident in the development of two dimensional MS imaging.5-11
Caprioli et al. have pioneered the use of matrix-assisted laser desorption/ionization (MALDI) MS imaging in biomarker discovery.12-14 It is normally conducted in a point-to-point scanning fashion where a laser beam rasters across a sample surface with a MS spectrum collected at each point. Later reconstruction of the 2-D ion
mapping in biological tissue samples to take advantages of effective analyte ionization in MALDI-MS. With the careful selection of appropriate matrix systems, pharmaceutically
important small molecules of known structures have also been profiled in a similar fashion to study metabolite activity and drug efficacy at the molecular level by the same group.7, 15 Various groups have since joined the efforts to further exploit the applications of MALDI-MS imaging in low-mass molecule studies. For example, Takach et al. have
successfully identified the dosed drug and metabolites in rat tissue sections that accompanied with an increase of phospholipids after the treatment.16 Atkinson et al. have studied lipid variations between tumor cells and liver tissues and have validated the results with conventional histology (H&E) staining.17 In parallel to MALDI-MS, another MS technique, secondary ion MS (SIMS), has been well-demonstrated in mapping of small molecules and atomic ions as well. By electromagnetically focusing a high energy ion beam to a smaller foot-point, SIMS exhibits a better imaging resolution than MALDI-MS and has allowed detailed investigations of local chemical conditions at a subcellular
level.10, 18-21 The recent uses of cluster ion beams have further improved its performance in larger molecule detection (MW>1000), as well as in 3-D depth profiling of active drug components.22-26 The third MS imaging method, matrix-enhanced SIMS, combines the better ionization efficiency in the presence of a matrix and a smaller foot-print of an ion
that have also started to attract attention.11, 29, 30
In this section, I report the employment of a laser beam-based MS imaging
concept using Desorption/Ionization on Silicon (DIOS) as the MS ionization source. Since its first demonstration in 1999, DIOS has opened the opportunities of MS-based small molecule profiling.31-33 It has reportedly exhibited advantages in reducing background noise in the low mass region (MW <500), which makes DIOS-based MS
imaging a potentially attractive approach to detecting unknown small molecules that are not always addressable with the conventional MALDI-MS techniques.31, 34-38 The elimination of the matrix addition step in DIOS further circumvents the potential problem of analyte dissolvation, which has been the most challenging step during sample
preparation in MALDI-MS and ME-SIMS imaging. In comparison to SIMS, direct adoption of the MALDI-MS interface in DIOS imaging reduces the instrument cost associated with SIMS imaging, especially when the use of cluster beams is required. This report details our study of the imaging parameters, such as the laser footprint and the
stage movement, on the quality of DIOS imaging. The concept-proof imaging of mouse liver tissues and HEK 293 cancer cells on a DIOS substrate is conducted as well.
2.2 Experimental Section
Materials Antimony-doped (100) single-crystalline silicon wafers at 0.005-0.02 Ω/cm were purchased from Silicon Sense, Inc. (Nashua, NH), and stored under vacuum upon use. 1,2-Dipalmitoyl-sn-glycero-3-phosphocholine (DPPC) was purchased from Avanti
dodecyltrimethylammonium chloride (DTMA), and propidium iodide (PI) were purchased from Sigma Aldrich (St. Louis, MO). Human embryonic kidney (HEK) 293
cells were received as a gift. The DER 736 Epoxy Resin mixture was purchased from Electron Microscopy Sciences (Hatfield, PA). The TEM reference copper grids were purchased from Ted Pella, Inc. (Redding, CA). Hydrofluoric acid (HF, 49%), H2SO4 and H2O2 (30%) were purchased from Fisher Scientific (Pittsburgh, PA). Ethanol (EtOH, CH3CH2OH) was purchased from Aaper Alcohol (Shelbyville, KY). DI H2O of 18 MΩ
(Millipore, PO) was used throughout the experiments.
DIOS Substrate Preparation. DIOS were prepared as previously described.38 Briefly, the Si wafer was cut into squared chips at the size of approximately 1x1 cm2 and dipped into 5% HF/EtOH solution for 1 min to remove the oxidized layer prior to etching. The surface was electrochemically etched in a 25% HF/EtOH solution for 1 min at a current density of 5 mA/cm2, followed by long-term storage in EtOH. Prior to the MS applications, the DIOS substrates were dipped into 15% H2O2 for 1 min, followed by a 1-min dip in a 5% HF/EtOH solution to refresh the surface.
MS Instrument Parameters. An Applied Biosystems Voyager DE-STR MALDI-TOF mass spectrometer (Framingham, MA) was operated at an accelerating voltage of 20 kV in a linear mode. A 20-Hz N2 laser was used, and the delay time was varied from 100-250 ns to achieve optimal MS performance. An adjustable pinhole was placed close to the laser entrance window to adjust the diameter of the laser beam. The laser radiant energy was adjusted by a neutral density filter wheel. The actual laser footprint, i.e. the
signal-to-background ratio (S/B) of different ion peaks were calculated by the instrument manufacture.
In the tissue thickness studies, two standard solutions (a solution of 100 pmol/µL DTMA and 100 pmol/µL Angiotensin I and a mixture of 100 pmol/µL of reserpine and 200 pmol/µL of Bradykinin) were drop-coated onto the substrates coated with or without 50-nm thick mouse liver tissue samples. The typical laser fluxes of 44 μJ/mm2 and 14
μJ/mm2 were used for tissue-coated DIOS and direct pSi imaging in detection of DTMA, respectively; and fluxes of 119 μJ/mm2 and 60 μJ/mm2 were used in detection of reserpine/bradykinin on tissue-coated DIOS and direct PSi, respectively, to achieve the best S/B ratios of the targeting analytes. The irradiation energy indicated here was
measured outside of the sample chamber using a FieldMax-P laser energy meter (Coherent Inc.). Six spectra were collected from each substrate, and five substrate replicates were studied. Relative standard deviation (RSD%) were calculated based on the absolute mass peak intensity of DTMA.
Mass Spectrometry Imaging To prepare the copper grid sample for MS imaging, a DIOS substrate was first dipped into a 300 pmol/µL DPPC/EtOH solution for 30 min. A copper grid (pitch width 450 µm; bar width 50 µm) was then placed atop the dried substrate, and stabilized by a double-sided tape on the edge. The Cu grid was imaged
with a laser beam size of 25 µm in diameter.
Fixed mouse liver tissue was first embedded with DER 736 Epoxy Resin. Specifically, 6.3 g of DER 736 were mixed with 100 g ERL 4221, 26 g NSA and 0.4 g
and baked at an approximately 70°C for 8 hrs to allow the resin to solidify. A thin slice of the tissue cross sections (50 nm) was prepared by cutting the resin-coated tissues using
a Leica UCT ultramicrotome and transferred onto a DIOS substrate. Another piece of 50-nm liver tissue was transferred to a flat Si wafer as the control sample. The mouse tissue samples were also imaged with a laser beam size of 25 µm in diameter. Electron and optical microscope imaging was also conducted on the slices from the same tissue
sample.
HEK 293 cells were cultured in Dulbecco’s modified Eagle’s medium (DMEM, Sigma) supplemented with 10% fetal bovine serum (FBS, Sigma) and antibiotic. Exponentially growing HEK 293 cells were digested with trypsin and seeded onto the
DIOS substrates that were placed at the bottoms of a 6-well plate. After 24 h of culturing, the cells were washed with phosphate buffered saline (PBS) and fixed with 70% EtOH for MS analysis. The staining of the cell nucleus with PI was conducted by incubating cells with 300 nM PI solution for 30 min, followed by rinsing with EtOH to
remove any nonspecifically adsorbed dye molecules. The HEK 293 cells were imaged using a 15-µm laser beam size.
All MS spectra in this study were collected in an automatic MS control mode and five laser shots were averaged to yield one accumulated spectrum at each location. Due
to hardware limitation, most MS spectra were collected with a narrow mass window of
Δmass = 50 amu. Mass spectra data were extracted using in-house developed software and imported in an excel spreadsheet. The reconstruction of the 2-D MS ion maps were
function of their corresponding x-y coordination using Origin 6.0 (Microcal Software, Inc.).
The bright-field images of the mouse liver tissue and the HEK 293 cells on the DIOS substrates were collected using a Leica DMRX light microscope in a reflection mode combined with a Donpisha XC-003P CCD camera. Fluorescence images were collected with a Carl Zeiss AxioVert 35 microscope combined with a Nikon Dxm1200
digital camera. A fluorescent filter set with bandpasses at 470±40nm for excitation and 525±50nm for emission was used in the measurements.
2.3 Result and Discussion
X Y m/z Laser beam Cross section of biological sample
MS image of cross section DIOS
ion
MS spectrum Top-down FE-SEM
image of DIOS
X Y m/z Laser beam Cross section of biological sample
MS image of cross section DIOS
ion
MS spectrum Top-down FE-SEM
image of DIOS
Scheme 2.1. Schematic Drawing of 2-D DIOS Imaging.
X Y m/z Laser beam Cross section of biological sample
MS image of cross section DIOS
ion
MS spectrum Top-down FE-SEM
image of DIOS
X Y m/z Laser beam Cross section of biological sample
MS image of cross section DIOS
ion
MS spectrum Top-down FE-SEM
image of DIOS
Scheme 2.1. Schematic Drawing of 2-D DIOS Imaging.
In DIOS imaging, the laser beam rasters across the DIOS surface with a MS profile generated at every sampling point. An ion map of each analyte is reconstructed
afterwards to illustrate its spatial distribution (Scheme 2.1). By eliminating the matrix-induced analyte diffusion and the physical size of MALDI matrix crystals, the resolving power of the 2-D DIOS imaging should be a simple convolution of the laser beam size and the movement consistency of the x-y translational sample stage. An understanding
MS spectra collected therefore is critical in attaining accurate reconstruction of ion distribution on a surface.
Laser Footprint in DIOS Imaging
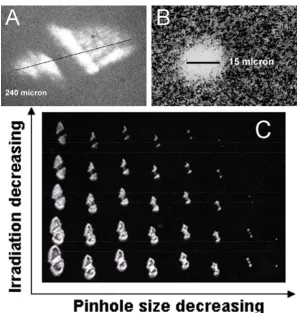
Figure 2.1.Optical microscopic images of laser footprint measurements: (A) a laser spot size of 250 μm in diameter; (B) a laser spot size reduced to 15 μm in diameter; and (C) a plot of laser spot sizes as a function of laser radiation energy and the pinhole open sizes. Panel B was the zoom-in of the smallest spot in C.
Figure 2.1.Optical microscopic images of laser footprint measurements: (A) a laser spot size of 250 μm in diameter; (B) a laser spot size reduced to 15 μm in diameter; and (C) a plot of laser spot sizes as a function of laser radiation energy and the pinhole open sizes. Panel B was the zoom-in of the smallest spot in C.
A commercial MALDI instrument equipped with an inexpensive N2 pulse laser often has a beam diameter of several hundreds of microns. It is a common practice to reduce the laser beam size using an iris in order to tune the diameter of the laser beam
burn marks left behind when the porous Si surface slightly melted upon heating (Figure 2.1). When the pinhole was opened to its fullest extent, an ellipsoidal shaped burning
spot was observed on the surface. The breakage of the laser spot in the middle was due to the presence of the ion-extraction grid close to the DIOS surface that partially blocked the laser beam. Reducing the pinhole size by physically blocking the incoming laser beam using an iris, the size of the laser footprint reaching the substrate became smaller
and smaller, until a perfectly circular shaped laser spot was realized, mirroring the shape of the pinhole aperture. As shown in Figure 2.1B, the laser beam size was reducible to 15
μm, the same length scale of a typical mammalian cell. Further reduction in the laser beam size could be achieved by improving the initial laser beam quality with additional
collimating lenses.9
It is important to note that the size of the burn mark varied with increasing laser irradiation energy (Figure 2.1C). In particular, an increasing laser irradiation slightly enlarged the mark diameter, despite the pinhole remained unchanged. This is attributed
to the fact that a minimal temperature threshold needs to be reached on the DIOS surface in order to leave the burn mark. Considering the lower energy fluence of the peripheral area of the laser beam, it is not surprising that the visible laser footprint was slightly smaller than the actual one when the laser energy borderlined on the threshold. An
increase in the irradiation power could easily elevate surface temperature, making the peripheral area visible. Therefore, consistent laser irradiation energy was applied during each imaging experiment in our subsequent imaging studies to eliminate any possible
was observed beyond certain laser energy, suggesting that at this point the pinhole aperture became the dominant size-controlling factor.
Sample Plate Movement in DIOS Imaging
In most MALDI or DIOS imaging experiments, the laser beam is pre-fixed at certain angle, whereas the sample plate is moved to different locations during scanning in a step-wise fashion. Therefore, the second important factor to the achievable spatial
resolution in DIOS imaging is related to the plate movement, such as the smallest movable step and moving precision. Taking advantage of our capability of imprinting the laser footprint on the surface by melting porous Si locally, optical images showing the burn marks generated at each moving step were obtained to assess this experimental
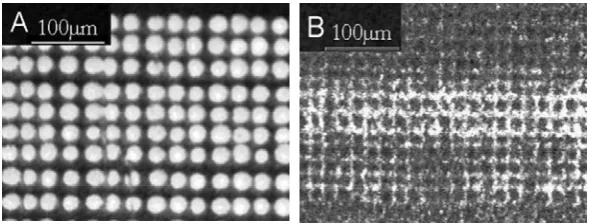
parameter. Figure 2.2 shows the movement of the sample stage at 30 and 20 µm/step with burn marks being generated by a 25 µm diameter laser beam. At 30 µm/step, DIOS imaging was intentionally carried out in an undersampling fashion to illustrate the subtle but nevertheless non-negligible variations in column-to-column and row-to-row spacing.
This unsteady stage movement was mainly due to mechanic inconsistency of the translation stage. An approximately 8% error was calculated from Figure 2.2A. Considering reconstruction of 2-D MS images was built on the assumption of the well-preserved x-y scanning coordinates, this error inevitably comprised final MS imaging
resolution. It is interesting to note that, although the inter-row or inter-column spacing was less consistent, the alignment inside the same row or column was relatively steady. Therefore it is possible to overcome this 8% moving error, if necessary, by generating an
of each row (i.e. the first column) were use to back-calculate the actual imaging coordinates.
Figure 2.2.Optical images of patterned laser burn marks on the DIOS substrates with a stage moving step of (A) 30 μm and (B) 20 μm. The laser footprint was kept at 25 μm in diameter.
Figure 2.2.Optical images of patterned laser burn marks on the DIOS substrates with a stage moving step of (A) 30 μm and (B) 20 μm. The laser footprint was kept at 25 μm in diameter.
While most tissue MALDI-MS imaging was done in an undersampling fashion to achieve high throughput, an oversampling approach could be useful to improve spatial
resolution beyond the resolving limit set by the minimal laser beam size and to better reflect the chemical distribution of analytes.40 Figure 2.2B demonstrated a 20-µm scanning resolution with a laser beam size of 25 µm. The overlapping of the laser footsteps yielded a ~20 µm resolving map of the sample.40 But in comparison to the previous 30 µm scanning steps, extra time was needed to map a sample of similar sizes. A judicious decision on the step size of stage movement should be made based on the needs of detection sensitivity, imaging throughput, and the movement precision.
Sample Thickness in DIOS Imaging
with the Si surface. This unique feature imposes a challenge in DIOS imaging where the biological sample of a certain thickness is placed atop the substrate; thus the surface to be
imaged is not in direct contact with the DIOS surface.
Conceptually it is feasible to image biological samples through tissue blotting, a standard technique used in histological staining experiments. However, the difficulties in keeping the exact spatial relationship between molecules of interest during blotting and in ensuring transferring analytes of different kinds consistently make this approach
800 1000 1200 1400 0 500 1,000 1,500
A
1296.7 904.5 M S In te n s it y m/z600 800 1000 0 500 1,000 1,500 2,000 2,500 3,000 3,500
C
1060.6 608.7 M S In te n s ity m/z800 1000 1200 1400 0 500 1,000 1,500 1296.7 904.5
B
MS Intensity m/z600 800 1000 0 500 1,000 1,500 2,000 2,500 3,000 3,500
D
1060.6 608.7 MS I n tensit y m/zFigure 2.3. DIOS mass spectra of (A) 100 pmol/μL des-Arg-Bradykinin and Angiotensin I detected atop of 50-nm thick mouse liver tissue, (B) 100 pmol/μL des-Arg-Bradykinin and Angiotensin directly atop of the DIOS substrate, (C) 100 pmol/µL of reserpine and 200 pmol/µL of Bradykinin atop of 50-nm thick mouse liver tissue, and (D) 100 pmol/µL of reserpine and 200 pmol/µL of Bradykinin directly atop
of the same DIOS substrate. The typical laser fluxes of 119 μJ/mm2 and 60 μJ/mm2 were used for
undesirable. A direct imaging of the top-layer of the sample is preferred, but the impacts of the natural thickness of any biological samples placed atop the DIOS surface on MS
detection sensitivity needs to be investigated first.
DER 736 Epoxy Resin was used to support mouse liver tissues in our preliminary DIOS imaging following the well-established protocol.39 In particular, the resin-embedded mouse liver tissues were sliced into 50 nm thin layers and were placed atop the
DIOS substrates. Drops of the solutions containing different MS standards, including small peptides (such as bradykinin) and organic compounds (such as DTMA and reserpine), were loaded on the top surface of the tissue samples. No bradykinin, reserpine, or DTMA were detected from the tissue sample before analyte loading; thus
they were chosen as the MS standards to avoid any ambiguity in later MS spectra interpretation. Figure 2.3 shows clear detection of all three analytes placed atop 50 nm tissue samples versus directly deposited on the DIOS surfaces. Higher absolute ion currents for the analytes were observed from the uncoated DIOS surface, but comparable
S/B ratios (S/B = 8064 vs S/B = 7194 from Figure 2.3, parts A and B, respectively) were calculated from both substrates, regardless of the presence of the tissue samples in
peak intensity (m/z = 228.3) was calculated based on six spectra collected from the same DIOS substrate with or without 50 nm thick mouse liver tissue, and the intersubstrate
RSD% values were calculated from five different substrates (Table 2.1). The RSD% values calculated from the tissue surface were similar to those from the DIOS surface, suggesting the negligible impact of thin biological layers on the reproducibility of MS measurements. Note that the DTMA solution was loaded on both surfaces in a
drop-coating fashion; thus, the uneven solvent drying could partially contribute to the large intra-substrate RSD%. It is also interesting to note that a slightly better peak resolution was observed for those detected atop the tissue layer, although the cause is unknown. Further investigation is underway to quantitatively examine the impacts of tissue
thickness in greater details. The possibilities of analyte detection with direct laser desorption/ionization (LDI) was eliminated by the control experiment in which no MS signals were observed when the same sample was placed atop a smooth Si wafer chip and investigated under the same laser fluence.
2-Dimensional DIOS Imaging
The concept-proof of DIOS imaging was first demonstrated in a reversed spectrometric image of a reference copper grid placed on top of a dipalmitoylphos- phatidylcholine (DPPC)-coated DIOS substrate. Phosphatidylcholine (PC) is one of the
most abundant lipid molecules present in animal membranes and its inherent positive charge makes it an ideal MS target. Figure 2.4A shows a typical DIOS spectrum of DPPC with the Na+ adduct of molecular ion peak at m/z=756.1 (a). The phosphoester
([C5H15NPO4]+, b) and m/z=86.1 ([C5H12N]+, c) as the dominant species (Figure 2.4B). In traditional MALDI-MS detection, the molecular ion peak of DPPC was often used,
despite the presence of stronger MS signals from its headgroup fragments. This was mainly due to the presence of the MALDI matrix peaks in the m/z =50-300 region that often overshadowed these two fragment ions. In DIOS, however, the elimination of the matrix reduces the background signals; thus these fragment ion peaks were the logical
choice to be closely monitored in PC detection for their better detection sensitivity. It also eliminates the needs to differentiate the PC molecules of different alkyl chains. Figure 2.4C shows an optical image of the reference copper grid placed on the DIOS substrate. One complete grid window was shown with 475-μm pitch and 50-μm bars.
The MS imaging was conducted using a 25 µm-dia laser beam at a 25-µm scanning step. The reconstructed ion map of one of the DPPC head group ([C5H15NPO4]+, m/z=184.1) Figure 2.4. (A) A DIOS spectrum of DPPC, with the signature peaks labeled; (B) the chemical structure of
DPPC and the corresponding major fragments; (C) an optical image of a reference copper grid on top of a
DIOS substrate; and (D) the corresponding reconstructed ion imaging of the DPPC headgroup fragment b.
The dark gray scale on the right indicates the corresponding ion intensities with the light gray of zero MS intensity. The DIOS spectra were collected at 25 µm stepwise in both X and Y directions with a 25-µm diameter laser beam. Other experimental conditions see the text.
H31C15
O O
O
H31C15
O P O O O O N+ _ c b a B
H31C15
O O
O
H31C15
O P O O O O N+ _ c b a
H31C15
O O
O
H31C15
O P O O O O N+ _ c b a c b a c b a B
was shown in Figure 2.4D. A good correlation to the optical image was evident with a clear-cut TEM grid frame. The rough edge of the reconstructed ion map was probably
due to the inconsistency in the stage movement. The lower ion currents observed near the grid edges were from the shadowing effect of the grids since the laser irradiated the surface at a 45-degree angle.
To examine the actual biological tissues in DIOS imaging, a piece of 50 nm thick DER 736 epoxy resin-fixed mouse liver tissue was placed atop a DIOS substrate. No
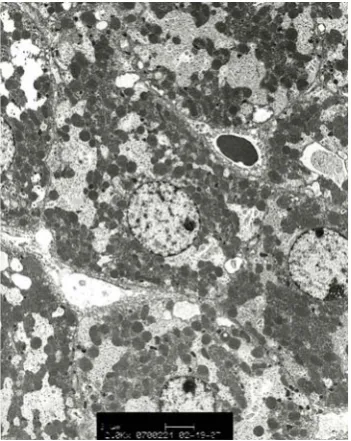
apparent sample texture was visible due to the thin layer of the tissue sample. The tissue texture became visible when a thicker tissue sample was examined optically. The cellular components within the 50 nm tissue sample could also be visualized in electron microscope imaging (Figure 2.5). A typical mass spectrum of the mouse liver tissue
showed numerous intense ions clearly observed. The mouse liver tissue of the same thickness on a smooth Si surface in the control experiment did not yield any detectable
signals. The chemical standard, DTMA (m/z = 228.3), was purposely deposited on the tissue top layer uniformly to examine the spot-to-spot reproducibility of MS
measurements. Its steady detection across the sample suggested relatively consistent MS
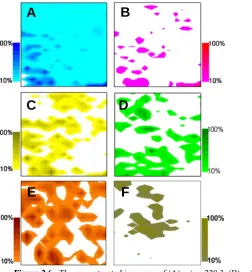
ionization efficiency (Figure 2.6A). Several representative ions detected from the tissue sample were mapped (Figure 2.6B-F): the m/z=184.1 peak was likely from the headgroup
of PC, one of the major animal membrane component (confirmed by the detection of the molecular ion peak at m/z = 758)41. The m/z=218.6 peak may be related to N-acetylserotonin but was not confirmed.42 Additional ions at m/z = 189.2, 203.1, and 214.2 were reconstructed as well, but a tandem MS or a high-resolution mass
spectrometer would be needed for structural identification. The non-overlapping distribution of these ions suggested the presence of chemical heterogeneity in the tissue
A
B
C
D
E
F
Figure 2.6. The reconstructed ion maps of (A) m/z = 228.3, (B) m/z = 184.1, (C) m/z = 218.6, (D) m/z = 189.2,
that was undetectable by the optical means. While further structural analysis is needed to identify these ions, the reconstructed ion maps directly confirmed the feasibility of 2-D
DIOS imaging to profile the biological samples. Under current MS conditions, little background was observed from DER 736 epoxy resin (data not shown). Note that due to the hardware limitation on handling a large stream of data generated during high-resolution imaging, we have focused on collecting MS images with a narrow MS window
of Δm/z = 50 (e.g., m/z = 180-230). However, for each sample, several full MS spectra (m/z = 50-1000) were collected at random locations to verify PC detection by the presence of the molecular ion peaks and to monitor the presence of other highly abundant ions that may be of interest.
Figure 2.7.(A) An optical image of HEK 293 cells grown on the DIOS substrate; and (B) the corresponding MS ion maps of the PC headgroup (m/z =184.1). The DIOS spectra were collected at 15 µm stepwise in both X and Y directions with a 15-µm diameter laser beam. Other experimental conditions see the text.
Figure 2.7.(A) An optical image of HEK 293 cells grown on the DIOS substrate; and (B) the corresponding MS ion maps of the PC headgroup (m/z =184.1). The DIOS spectra were collected at 15 µm stepwise in both X and Y directions with a 15-µm diameter laser beam. Other experimental conditions see the text.
DIOS-MS imaging was further demonstrated in direct detection of mammalian
cells. Figure 2.7A shows the optical images of several HEK293 cells that were cultured directly on the DIOS substrate and simply fixed with 70% ethanol afterwards. The reconstruction of the ion maps of PC, one of the cell membrane major components, was shown in Figure 2.7B. A good correlation to the optical image was observed. The lack
the detection of the PC headgroup was indeed due to the presence of the active DIOS
surface underneath. In a parallel experiment, the fixed HEK293 cells (Figure 2.8A) were
incubated in a solution containing PI, a nucleic acid specific dye commonly used as a nucleus marker. As showing in Figure 2.8B, a fluorescence image of a cluster of HEK293 cells illustrated the exact staining of cell nucleuses. Figure 2.8C shows a typical DIOS mass spectrum, showing the detection of the cell membrane (PC, m/z=184.1) and
the nucleuses (PI, m/z=128.1). The reconstructed ion maps were overlaid in Figure 2.8D. A reasonable correlation of the reconstructed ion map to the optical images was evident, with the ring-shaped cell cluster clear distinguishable.
2.4 Conclusion
In this report, we have concept-demonstrated the use of DIOS in 2-D MS bioimaging. The preliminary study has shown the ability to directly monitor spatial
80 100 120 140 160 180 0
400 800 1,200
1,600 C *
*
M
S
In
ten
s
ity
m/z


![Figure 3.2. The calculated RIs of [M+2]of storage time of the substrates s under 2×10were pretreated with 20 pmol/µL TEA in D+ peaks plotted as a function -7 Torr](https://thumb-us.123doks.com/thumbv2/123dok_us/1473328.1180427/61.595.136.301.395.555/figure-calculated-storage-substrates-pretreated-peaks-plotted-function.webp)