NUMERICAL INVESTIGATION OF CREEP CRACK GROWTH
BEHAVIOUR IN P92 STEEL WELDMENT
N.A.Alang1, 2, C.M.Davies2 and K.M.Nikbin2
1
Department of Mechanical Engineering, Imperial College London, SW7 2AZ, UK
2
Faculty of Mechanical Engineering, University Malaysia Pahang, 26600, Pahang, Malaysia
ABSTRACT
Components such as steam pipes in power plant that are subjected to creep may contain single or multiple defects. The prediction of creep lifetime of such components requires understanding of the crack growth behaviour. This paper presents the numerical analysis of creep crack growth (CCG) behaviour of P92 steel weldment using C-shaped tension, CS(T), specimens with single and multiple cracks. Finite element analyses employing ductility exhaustion damage model were performed to investigate the creep crack growth behaviour and possible cracks path. The influences of inhomogeneous material properties due to the weldment on creep life were examined. Results revealed that the model with multiple cracks give shorter crack growth life compared to the model with a single crack. The mechanical heterogeneity of the weldment significantly reduces the crack growth life of the material. For the single crack model, the final failure was predicted to occur along the initial crack plane at the weld material region whereas for the multiple cracks model, the final failure occurred along the initial crack plane at the FGHAZ region.
INTRODUCTION
The presence of cracks in welded structures is may be inevitable, especially in the HAZ region. In general, the HAZ can be divided into three distinct regions: coarse-grain HAZ (CGHAZ), fine-grained HAZ (FGHAZ) and inter-critical HAZ (ICHAZ). The discrepancies in microstructures of these regions result in different creep properties and fracture behaviour. The zone containing the crack and surrounding materials may influence the creep damage and creep crack growth direction of the weldment. Yatomi et al. (2010) studied on P92 welds showed that Type IV crack initiates in the FGHAZ during long-term use at high temperatures. Takahashi and Tabuchi (2011) show that Type IV cracking can cause a considerable decrease in the creep strength of the weldment, therefore, this type of cracking may be responsible for weldment failure. When more cracks appear in the weldment structures, the cracks behaviour and possible interaction between all cracks must be understood so that the life of the structure can be accurately predicted. In LEFM, the rate of crack grows can be related to the crack driving force called stress intensity factor, K. Obtaining K near to crack tip, engineers are able to predict the crack growth rate, therefore, the residual lifetime of the materials could be estimated.
MATERIALS
The material investigated in the present study is a P92 steel weldment. The microstructures of the BM, WM, FGHAZ and CGHAZ were observed under an optical microscope after mechanical grinding using grit papers (#600, #800, #1200 and #2500) and polishing !"# $%# &'(# )*$+# ,*-(%.,#
suspension liquid. The polished specimens were then /)-001,#!/*.2#-#3*4414-5/#61-21.$7#-#(*8$!61#%9#
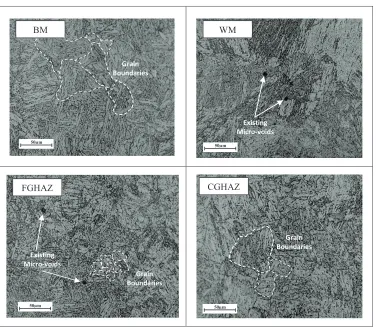
1g of acid picric + 5mL of HCL + 100mL of ethanol for 10-15s to reveal the microstructure of the material. The optical micrographs of investigated material with 500X magnification are shown in Figure 1. The BM of P92 steel exposes the martensitic structures. For direct comparison, some of the grain boundaries are drawn (shown in dashed lines) in each regions except for WM, which the grains not clearly exposed. It was found that the region that close to BM/HAZ region or FGHAZ shows smaller grain sizes compared to one in WM/HAZ region or CGHAZ that may due to the weld thermal cycle. The existing micro-voids were also found in in WM and FGHAZ regions.
Figure 1. Optical micrographs of P92 steel weldment (Magnification of 500X)
Vickers microhardness tests were conducted in order to investigate the hardness distribution of P92 steel weldment. All measurements were performed using a Zwick microhardness machine with diamond shape indenter. The indentation load applied to the specimen is 10kgf with the holding time of 10 seconds. Results of the hardness measurement for the material tested are shown in Figure 2. It can be seen that the average hardness in the WM is higher than that in the BM about 40 HV. The maximum and minimum hardness were recorded at the CGHAZ and FGHAZ, respectively. These regions correspond to the harder and softer regions of the steel weldment. A large variation on hardness measurement in HAZ confirms that the mechanical heterogeneity occurs in this region.
Existing Micro-voids
Grain Boundaries
Existing Micro-voids
Grain Boundaries
BM
CGHAZ FGHAZ
WM
50µm
50µm 50µm
50µm
Figure 2. Vickers hardness profile of P92 steel weldment
FINITE ELEMENT ANALYSIS
Finite Element Models
The CS(T) specimens of P92 steel weldment were modelled using commercial Finite Element (FE) software, ABAQUS v6.13. The welded joint is simplified to have only four distinct regions: BM, WM, FGHAZ and CGHAZ. The ICHAZ was not considered in the analysis due to very limited creep properties reported in the literature. The geometry and detail dimensions of the CS(T) specimen with single and multiple cracks model are shown in Figure 3(a-d). The initial crack length for both Crack 1, ao1 and Crack 2, ao2 is 2mm (ao/W = 0.08). The width of the FGHAZ and CGHAZ is 1mm, respectively.
Figure 3. The geometry and detail dimension of CS(T) models employed in FE analysis: (a) single crack-homogeneous, (b) single crack-inhomogeneous, (c) multiple crack-homogeneous and (d)
multiple crack-inhomogeneous
The load of P=8kN was applied to the model at the pin in the y-direction whereas the other directions were fixed. The FE focused meshes with collapsed elements were applied to the models for linear elastic fracture mechanics analysis in order to accurately model the crack tip singularity. Second order quad-dominate elements type CPE8 using sweep method was applied. Stationary crack models were used to obtain the K-values based on contour integral formulation. All models are assumed to have
140 180 220 260 300 340
-30 -20 -10 0 10 20 30
Vick
er
s
H
a
rdnes
s,
H
V1
0
Distance to the Notch Center, mm
WM PM
PM HAZ HAZ
y
x
25 50 25
12.5
Crack 1
BM
Crack 1
WM BM
Crack 1
BM
Crack 1
WM BM
(a) (b) (c) (d)
Crack 2 Crack 2
ao1
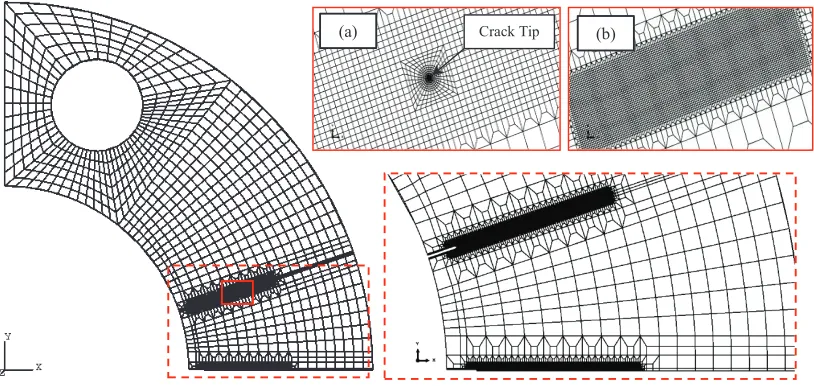
homogeneous material properties (Figure 2a and 2b). For the models with multiple cracks, the crack that located at FGHAZ was modelled as a seam edge, so that the overlapping nodes along a seam will be generated. Meanwhile, for CCG simulation, the CPE4 structured meshes with the size of 50µm were assigned around the crack tip to effectively captured the stress distribution during the analysis. Detailed finite element meshes used in FE simulation and close up to the cracked area are shown in Figure 4. For computational efficiency, symmetry conditions were employed for all analysis, therefore, only half of the specimen was modelled.
Figure 4. Details FE meshes applied for (a) LEFM analysis using collapsed elements ahead the crack tip and (b) creep crack growth simulation
Constitutive Material Model
The elastic-plastic mechanical properties of the P92 steel are taken from Zhou et al. (2012, 2013). The true plastic stress strain data for WM, FGHAZ and CGHAZ are assumed to be the same as those of PM. The true plastic deformation follows the power law hardening relationship which is given by Equation 1:
!"# $%&"'( (1)
where $ and N are power hardening parameter and strain hardening parameter, respectively. In creep crack growth (CCG) simulations, elastic-plastic-creep material model was applied. The creep
,19%6(-$*%.#%9#:;<#/$114#)14,(1.$#%01=/#$+1#>%6$%.5/#"%)16#4-)#-.,#is given by Equation 2:
&) # *!+ (2)
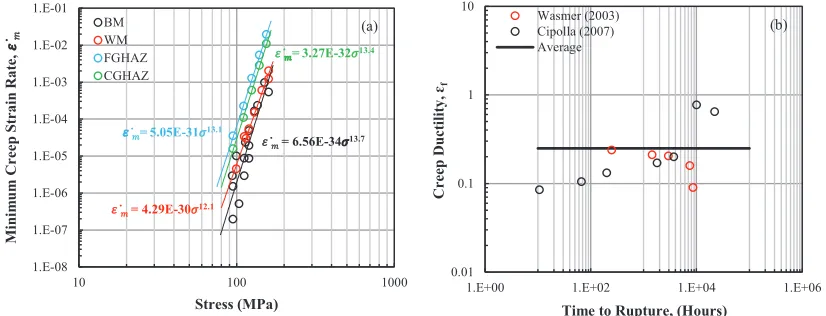
where* and n are material constants that can be calculated by plotting the minimum creep strain rates against applied stresses (in log-log scale) obtained from a series of uniaxial creep tests. In this work, the creep properties for P92 steel weldment were calculated from the tabulated data found in the literature (Wasmer, 2003, Wang, 2009, An, 2011 and Chen, 2015) as shown in Figure 5a. The best fix curves of the tabulated data are drawn for each region in order to determine the creep properties, which were used in a CCG simulation.
Crack Tip
Figure 5. Creep properties: (a) tabulated data of uniaxial minimum creep strain rate against applied stresses and (b) uniaxial creep ductility
To simulate the creep crack propagation, creep damage accumulation based on ductility exhaustion approach was used. Creep damage rate, ,) is defined by the ratio of creep strain rate, &)- and multi-axial creep ductility, &./ and is given the by Equation 3:
,) #0)1
02/ (3)
The damage accumulated at time, 3 is calculated using simple integration rule:
, # 4 ,)53 # 4 0)1
02/53
6 7 6
7 (4)
When the w at the gauss point reaches 0.99, local failure is considered to occur and progressive creep cracking is simulated. The load-carrying capacity of this point is reduced to near zero by simply reducing the elastic modulus to a very small value. In this simulation, the elastic modulus is reduced 99% from the original value when the damage reaches ,=0.99. The progressive failure simulation technique described above is implemented in ABAQUS using the user subroutine USDFLD. The multi-axial creep ductility depends on the uniaxial creep ductility, &. and stress triaxiality (the ratio of mean principle stresses, !8 and equivalent stress,!9) and one of the well-known relationships between these parameters is given by Cocks and Ashby (1982) and is given by Equation 5:
02/
02# :;<= > ?
@A
+B7CD
+E7CDFG H :;<= >I A
+B7CD
+E7CDF
JK
JLG (5)
The constant uniaxial creep ductility &. of 25% is employed in this simulation works, which is obtained from the average value of tabulated data from the literature (Wesmer, 2003 and Cipolla et al. 2007) as shown in Figure 5b. The summary of material properties for P92 steel weldment employed in the present study are shown in Table 1.
Table 1: Metarial properties for P92 steel weldment at 650°C
Material E (GPa) K (MPa) N A (MPa-nh-1) n &.
BM 125
311 0.066
6.56E-34 13.7
0.25
WM 120 4.29E-30 12.1
FGHAZ 90 5.05E-31 13.1
CGHAZ 110 3.27E-32 13.4
&!M= 6.56E-34!13.7
&!M= 4.29E-30!12.1
&!M= 5.05E-31!13.1
&!M= 3.27E-32!13.4
1.E-08 1.E-07 1.E-06 1.E-05 1.E-04 1.E-03 1.E-02 1.E-01
10 100 1000
M in im u m C re ep S tr a in R a te , & !M Stress (MPa) BM WM FGHAZ CGHAZ 0.01 0.1 1 10
1.E+00 1.E+02 1.E+04 1.E+06
" #$ $% &' ( )* +, +* -.& /f
Time to Rupture, (Hours)
Wasmer (2003) Cipolla (2007) Average
RESULTS AND DISCUSSION
Linear Elastic Fracture Mechanics Analysis
The FE analysis was performed to determine the K near crack tip and possible multiple crack interaction that may exist when the two or more cracks are present in the materials. To validate the
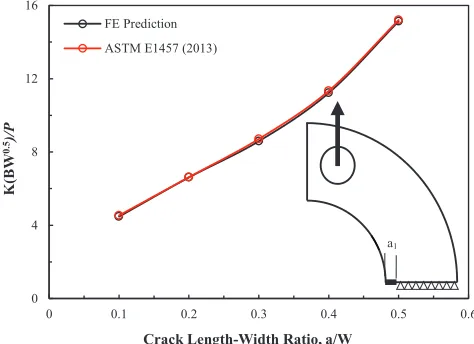
models, the K-value obtained from the simulation results for crack ranging from a0/W = 0.1-0.5 of single crack model were compared to K-solution from the literature (ASTM E1457, 2013). The simulation results show a good agreement with K-solution and the results are shown graphically in Figure 6. Comparing between single and multiple cracks models (Figure 8a), it was found that there is an interaction between the cracks as the later model shows slightly lowers K-values compared to one with single crack. At lower crack length-width ratio a1/W?0.3, the K decreases significantly as the Crack 2 increases. However, when the a1/W>0.3, the Crack 1 tends to give the similar K-value with one in single crack model. This can be concluded that as the cracks apart, the effect of crack interaction on K-value reduces. The K-values plot near crack tip for Crack 2, varying the a1/W is shown in Figure 7(b). In general, the results show that the K-values of Crack 2 increases when the crack length increases. For a1/W= 0.1-0.5, the difference on K-values of Crack 2 are insignificant. The K-values near Crack 2 tip slightly decreases when the length of Crack 2 increases.
Figure 6. Comparison of K-values between FE results and K-solution
Figure 7. Stress intensity factor: (a) Crack 1 and (b) Crack 2 0
4 8 12 16
0 0.1 0.2 0.3 0.4 0.5 0.6
K(
B
W
0.5
)/
P
Crack Length-Width Ratio, a/W
FE Prediction ASTM E1457 (2013)
0 4 8 12 16
0 0.1 0.2 0.3 0.4 0.5 0.6
K(
B
W
0.5
)/
P
Crack Length-Width Ratio, a1/W
Single Crack a2/W=0.1 a2/W=0.2 a2/W=0.3 a2/W=0.4 a2/W=0.5 (a)
0 4 8 12 16
0 0.1 0.2 0.3 0.4 0.5 0.6
K(
B
W
0.5
)/
P
Crack Length-Width Ratio, a2/W a1/W=0.1
a1/W=0.2 a1/W=0.3 a1/W=0.4 a1/W=0.5 (b)
a1
Creep Crack Growth Simulation
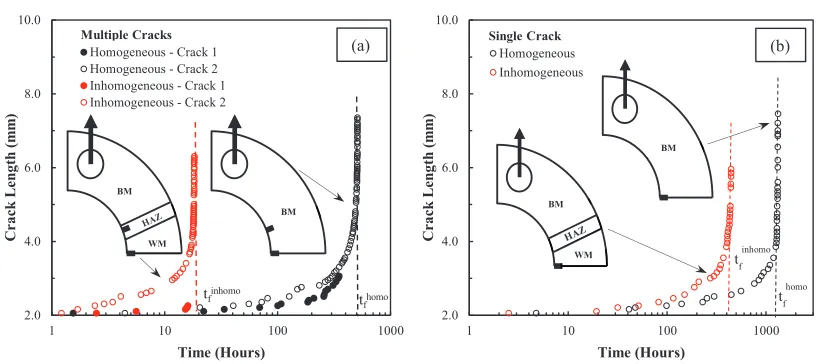
The creep crack growth simulations based on ductility exhaustion damage model were carried out using elastic-plastic-creep material models. The effects of inhomogeneous properties on creep behaviour were studied by assigning different properties to each weldment region. Four different models with homogeneous and inhomogeneous materials (Figure 2) were simulated using the plane strain condition. Figure 8 shows the load line displacement versus time for single and multiple cracks model. For comparison, results of load line displacement without damage are also shown. The results show that inhomogeneous material properties which due to the weld joints give significant effect on the load line displacement. The crack length versus time for both models, single and multiple cracks are plotted as shown in Figure 9. The results show that the effect of inhomogeneous in material properties on crack growth life is remarkable. In this simulation, the predicted creep life of the model with homogeneous material properties is approximately 25 times (for multiple cracks model) and 3 times (for single crack model) compared to the model with inhomogeneous properties. At a given creep time, Crack 2 that located at the FGHAZ region gives longer crack length compared to one in the weld material region. The homogeneous material model also shows similar trends, which predict longer crack propagation of Crack 2. Comparing the crack length at creep failure time, tf, Crack 1 in homogeneous model shows a longer length compared to Crack 1 in inhomogeneous model. In this simulation, the location where the damage starts to initiate was also investigated. The damage is assumed to initiate when the gauss point of any FE element in the model reaches, w = 0.99. In inhomogeneous model, it was observed that the damage starts to initiate at the tip of Crack 2. This is due to the higher triaxility at the tip of Crack 2, corresponds to lower multiaxial creep ductility. In contrast, FE simulation predicts that the damage initiation occurs at the tip of Crack 1 for the case of homogeneous model. Investigation on the triaxility at both crack tips in homogeneous model showing that Crack 1 and Crack 2 have almost similar triaxility values. The accumulation creep strain is higher at the Crack 1, hence, responsible to the damage initiation at this location. As the failure progress, the stress and strain were redistributed and caused higher stress triaxility at the tip of Crack 2. The higher stress triaxility corresponds to lower multiaxial creep ductility, hence, accelerates damage accumulation at the near Crack 2 region. As a result, the final failure occurred at the FGHAZ region, where the Crack 2 is located. Figure 10 shows the stress triaxility distribution at near Crack tip 1 and Crack tip 2 at the time just before crack initiaties, ti and t/tf = 0.5.
Figure 8. Load line displacement versus time: (a) multiple cracks model and (b) single crack model 0 0.1 0.2 0.3 0.4 0.5
1 10 100 1000
L o a d L in e D isp la ce m en t (m m ) Time (Hours)
Homogeneous - w/Damage Homogeneous - wo/Damage Inhomogeneous - w/Damage Inhomogeneous - wo/Damage
Multiple Cracks 0 0.1 0.2 0.3 0.4 0.5
1 10 100 1000
Lo a d Li n e D isp la ce m ent ( m m ) Time (Hours)
Homogeneous - w/Damage Homogeneous - w/o Damage Inhomogeneous - w/Damage Inhomogeneous - w/o damage
Figure 9. Crack length versus time: (a) multiple crack model and (b) single crack model
(a) Multiple cracks model with homogeneous materials
(b) Multiple cracks model with inhomogeneous materials
Figure 10. Stress triaxility contours
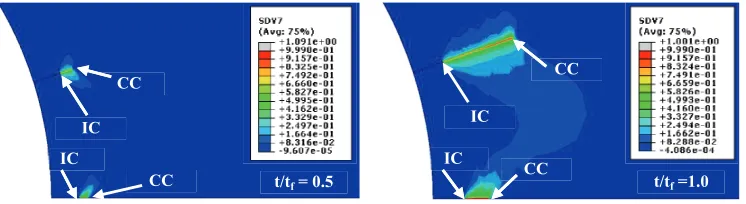
Figure 11 shows the creep damage contours and CCG paths for all cases considered in this study. It can be seen that the crack propagated straight along the initial crack plane. For multiple crack models, the final failure occurs at the crack plane of Crack 2 whereas for single crack model, the final failure occurs at the crack plane of Crack 1. As the damage progress, the interactions of creep damage between Crack 1 and Crack 2 occurs in homogeneous material model. In contrast, there was no interaction observed in the inhomogeneous model. In this model, the creep deformation of the
2.0 4.0 6.0 8.0 10.0
1 10 100 1000
C
ra
ck
L
en
g
th
(
m
m
)
Time (Hours)
Homogeneous - Crack 1 Homogeneous - Crack 2 Inhomogeneous - Crack 1 Inhomogeneous - Crack 2
Multiple Cracks
tfhomo tfinhomo
2.0 4.0 6.0 8.0 10.0
1 10 100 1000
C
ra
ck
L
en
g
th
(
m
m
)
Time (Hours)
Homogeneous Inhomogeneous
Single Crack
(a)
tfinhomo
tfhomo
(b)
t = ti t/tf =0.5
t/tf =0.5
WM BM
t = ti
WM BM
WM BM
BM
WM BM
material in FGHAZ was constraint by the harder CGHAZ and BM materials which lead to higher stress triaxiality at the FGHAZ region. As creep time increases, most of the elements in FGHAZ reach the damage critical value, w= 0.99 whereas the creep damage of the weld and base metal regions still remain at the low value. As a result the damage progressively increases in the FCGHAZ region until the final failure was predicted. For single crack, the damage progress along the Crack 1 plane and no significant damage was observed in other regions including in the FGHAZ.
(a) Multiple cracks model with homogeneous materials: IC @ initial crack, CC @ current crack
(b) Multiple cracks model with inhomogeneous materials
(c) Single cracks model with homogeneous materials
(d) Single cracks model with inhomogeneous materials
Figure 11. Creep damage contours
t/tf =1.0 CC
IC
IC
CC
t/tf = 0.5 t/tf =1.0
t/tf = 1.0
WM BM
t/tf = 0.5
WM BM
t/tf = 0.5
WM BM
t/tf =1.0
WM BM
t/tf = 0.5 CC
IC IC
CC
CONCLUSIONS
The FE analysis based on ductility exhausted damage model was performed to investigate the creep crack growth behaviour in P92 steel weldment of CS(T) specimen. The heterogeneity in material properties due to weldment and apparent of crack in FGHAZ region on creep crack growth behaviour were examined and discussed. The following conclusions are drawn:
.
1. In multiple cracks model with homogeneous material, the creep damage started initiates near the crack tip of Crack 1 before the first damage element was observed near crack tip of Crack 2. As the damage progress, the stress and strain were redistributed and caused higher stress triaxility at the tip of Crack 2, hence, accelerates damage accumulation at the near Crack 2 region. The final failure was predicted to occur along the initial plane of Crack 2.
2. In multiple cracks model with inhomogeneous material, the creep damage in the FGHAZ region is most severe than the WM region. Most of the element in FGHAZ region reached critical value after creeping for 18.5 hours. In contrast, only few damaged elements were observed in weld material region.
3. The creep lifetime for both above cases showing significant difference. The multiple cracks model with homogeneous material gives 25 times higher creep life compared to one with inhomogeneous material. It can be concluded that the influence of HAZ (FGHAZ+CGHAZ) on creep life is remarkable.
4. In single crack model, the final failure occurred along the initial crack plane. The creep life of the model with homogeneous material is 3 times longer compared to one with inhomogeneous material. The influence of HAZ on creep life is less significant compared to one in multiple cracks model.
REFERENCES
An, J., Jing, H., Xiao, G., Zhao, L., and Xu, L., A<BCBDE#FAnalysis of the Creep Behavior of P92 Steel Welded Joint7G J. of Material Engineering and Performance, ASM International 20:1474-1480.
ASTM HCIJK# A<BCLDE# FStandard Test Method for Measurement of Creep Crack Growth Times and
Rates in MetalG7#MNOPE
Q+1.7# RE7# S-.27# RETE7# T+-.27# UESE7# V!-.7# WETE7# -.,# O!7# NEOE7# A<BCJDE# FH991X$# %9# Y.*$*-4# Q6-XZ#
Positions and Load Levels on Creep Failure Behaviour in :;<# N$114# S14,1,# U%*.$G7#Eng.
Failure Analysis, 47 56-66.
Cipolla, L., Gianfrancesco, A., Venditti, D., Cumino, G., and Caminada, S., (2007DE#FMicrostructural Evolution During Long Term creep Tests of 9%Cr Steel Grades7GIn Proceeding of CREEP8, ASME Paper CREEP-2007, 26030.
O-Z-+-/+*7#[E7#-.,#O-0!X+*7#PE7#A<BCCDE#FH\-4!-$*%.#%9#Q611"#N$61.2$+#]1,!X$*%.#W-X$%6/#9%6#S14,1,# U%*.$/#%9#R6-,1#C<<#N$114G7#J. Pressure Vessel Technology, 133(2).
S-.27#VE7#N+*7#TE7#:-.7#^E7#-.,#S!7#_E7#A<BB;DE#F#_*2+-Temperature Creep Properties of Fine Grained
_1-$#M991X$1,#T%.1#*.#:;<#S14,(1.$G7#Trans. Nonferrous Met. Soc. China, 19 772-775. Wasmer, K., (2003). Prediction of Creep Crack Growth in a Range of Steels, PhD Thesis., Imperial
College London.
Yatomi,M., Fuji, A., and Yokobori, T., A<BCBDE# FEvaluation of Creep Crack Growth Rate of P92 Welds Using Fracture Mechanics :-6-(1$16/7GJ. Pressure Vessel Technology, 132(4). Zhao, L., Jing, H., Xu, L., An, J., and Xiao, GE7#A<BC<DE#FNumerical Investigation of Factors Affecting
Creep Damage Accumulation in ASME P92 Steel Welded JointG7#Material and Design, 558 566-575.